Free Statistics

of Irreproducible Research!

Author's title

Author*The author of this computation has been verified*
R Software Modulerwasp_edauni.wasp
Title produced by softwareUnivariate Explorative Data Analysis
Date of computationSun, 26 Oct 2008 16:15:36 -0600
Cite this page as followsStatistical Computations at FreeStatistics.org, Office for Research Development and Education, URL https://freestatistics.org/blog/index.php?v=date/2008/Oct/26/t1225059813d0mmb0w7ln3li4e.htm/, Retrieved Sun, 19 May 2024 13:03:22 +0000
Statistical Computations at FreeStatistics.org, Office for Research Development and Education, URL https://freestatistics.org/blog/index.php?pk=19076, Retrieved Sun, 19 May 2024 13:03:22 +0000
QR Codes:

Original text written by user:
IsPrivate?No (this computation is public)
User-defined keywords
Estimated Impact182
Family? (F = Feedback message, R = changed R code, M = changed R Module, P = changed Parameters, D = changed Data)
F     [Univariate Explorative Data Analysis] [Investigating dis...] [2007-10-22 19:45:25] [b9964c45117f7aac638ab9056d451faa]
F    D    [Univariate Explorative Data Analysis] [Investigating Dis...] [2008-10-26 22:15:36] [dafd615cb3e0decc017580d68ecea30a] [Current]
F    D      [Univariate Explorative Data Analysis] [Q7 task 3] [2008-10-28 07:16:09] [b641c14ac36cb6fee377f3b099dcac19]
-   PD      [Univariate Explorative Data Analysis] [Verbetering: aant...] [2008-11-01 10:58:46] [b85eb1eb4b13b870c6e7ebbba3e34fcc]
-             [Univariate Explorative Data Analysis] [Investigating Dis...] [2008-11-02 23:03:47] [33f4701c7363e8b81858dafbf0350eed]
-   PD      [Univariate Explorative Data Analysis] [Verbetering: aant...] [2008-11-01 11:00:06] [b85eb1eb4b13b870c6e7ebbba3e34fcc]
-             [Univariate Explorative Data Analysis] [Investigating Dis...] [2008-11-02 23:05:37] [33f4701c7363e8b81858dafbf0350eed]
Feedback Forum
2008-11-01 11:24:50 [Ellen Smolders] [reply
Assumptie 1: De student heeft deze vraag niet correct beantwoord. Voor deze assumptie moesten we onderzoeken of de tijdreeks autocorrelatie bevat, hierbij wordt de randomness getest. Voor deze assumptie te testen moeten we de gegevens op het ‘Lagplot’ aflezen. Bijgevoegde links stellen de gereproduceerde gegevens van de student voor met als aantal lags: 1 en aantal lags: 36
- aantal lags: 1: http://www.freestatistics.org/blog/index.php?v=date/2008/Nov/01/t12255371578uniwjs0c0podj6.htm
- aantal lags: 36 http://www.freestatistics.org/blog/index.php?v=date/2008/Nov/01/t1225537232d9wmjinynp3x18z.htm
Uit het aantal lags 36 kunnen we zien dat er een positieve autocorrelatie aanwezig is.

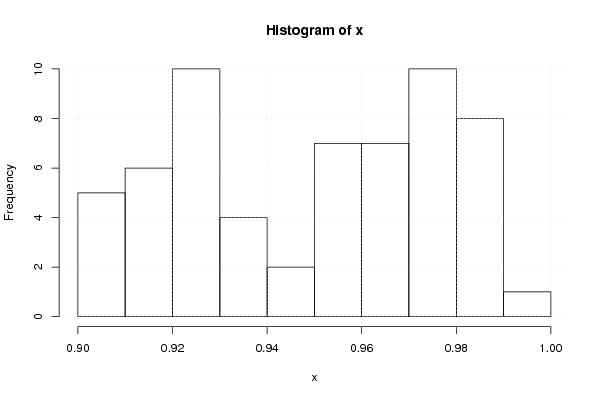
Assumptie 2:De student heeft deze vraag gedeeltelijk correct beantwoord. Het is correct dat de run sequence plot en het histogram eenzelfde spreiding en verdeling hebben, maar dit is geen normaalverdeling. Een normaalverdeling heeft een omgekeerde Ushape vorm. Op de grafieken kunnen we zien dat dit niet het geval is.

Assumptie 3:de student heeft deze vraag niet correct beantwoord.
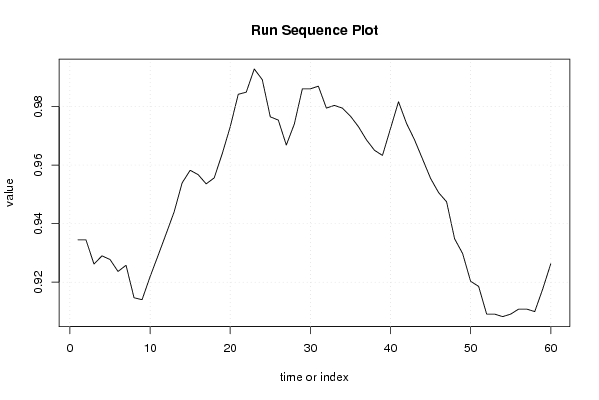
uit de run sequence plot kunnen we afleiden dat de grafiek geen constant niveau heeft. De grafiek vertoont in het midden gedurende een aantal observaties een zeer groot extremum dat nadien gevolgd wordt door een zeer sterke daling.

Assumptie 4: De student heeft deze vraag niet correct beantwoord.
We kunnen waarnemen (op het run sequence plot) dat de grafiek geenzelfde spreiding vertoont.

Er werd niet aan alle voorwaarden voldaan.
2008-11-02 23:10:51 [Jeroen Michel] [reply
Assumptie 1:
lag 1:
Statistical Computations at FreeStatistics.org, Office for Research Development and Education, URL http://www.freestatistics.org/blog/date/2008/Nov/03/t1225667081xutmfb15h2pdl53.htm, Retrieved Sun, 02 Nov 2008 23:04:44 +0000

lag 36:
Statistical Computations at FreeStatistics.org, Office for Research Development and Education, URL http://www.freestatistics.org/blog/date/2008/Nov/03/t1225667185sqhpqbbswqyqz2y.htm, Retrieved Sun, 02 Nov 2008 23:06:29 +0000

Ook bij deze assumptie is er een fout ingeslopen. Dit aangezien er wel degelijk een positieve correlatie aanwezig is dit in tegenstelling tot wat de student beweerde. Bij de eerste lag is dit niet het geval!

Assumptie 2:
Dit heeft inderdaad deels een correct antwoord daar er wel degelijk een gelijkaardige spreiding is tussen eerdergenoemde grafieken, maar er is geen sprake van een normaalverdeling!

Assumptie 3:
De grafiek kent geen constant verloop. Er is op het einde een sterke daling waar te nemen en in het midden zijn enkele extreme waarden waar te nemen.

Assumptie 4:
Er is geen constante spreiding waar te nemen op deze grafieken.
2008-11-03 20:14:36 [Jeroen Aerts] [reply
De student heeft bij zijn oorspronkelijke berekeningen enkele fouten gemaakt. Deze werden echter al besproken in de posts hierboven en hij heeft zichzelf reeds in de posts verbeterd, meer heb ik daar niet aan toe te voegen.

Post a new message
Dataseries X:
0,934438583
0,934438583
0,926204819
0,929003021
0,927756654
0,923664122
0,925784239
0,914681015
0,914020139
0,921875
0,929133858
0,936507937
0,944
0,953920776
0,958230958
0,956738769
0,953586498
0,955631399
0,963855422
0,973066898
0,984182777
0,984915705
0,992844365
0,989208633
0,976491863
0,97538742
0,966850829
0,974025974
0,986046512
0,986046512
0,986964618
0,979477612
0,980392157
0,979477612
0,976744186
0,973123262
0,968634686
0,965073529
0,963302752
0,972477064
0,981651376
0,974264706
0,968634686
0,962072155
0,955473098
0,950605778
0,947467167
0,934844193
0,929791271
0,920303605
0,918560606
0,909090909
0,909090909
0,908230842
0,909090909
0,910815939
0,910815939
0,909952607
0,91769158
0,926275992


Summary of computational transaction
Raw Inputview raw input (R code)
Raw Outputview raw output of R engine
Computing time2 seconds
R Server'Gwilym Jenkins' @ 72.249.127.135

\begin{tabular}{lllllllll}
\hline
Summary of computational transaction \tabularnewline
Raw Input & view raw input (R code)  \tabularnewline
Raw Output & view raw output of R engine  \tabularnewline
Computing time & 2 seconds \tabularnewline
R Server & 'Gwilym Jenkins' @ 72.249.127.135 \tabularnewline
\hline
\end{tabular}
%Source: https://freestatistics.org/blog/index.php?pk=19076&T=0

[TABLE]
[ROW][C]Summary of computational transaction[/C][/ROW]
[ROW][C]Raw Input[/C][C]view raw input (R code) [/C][/ROW]
[ROW][C]Raw Output[/C][C]view raw output of R engine [/C][/ROW]
[ROW][C]Computing time[/C][C]2 seconds[/C][/ROW]
[ROW][C]R Server[/C][C]'Gwilym Jenkins' @ 72.249.127.135[/C][/ROW]
[/TABLE]
Source: https://freestatistics.org/blog/index.php?pk=19076&T=0

Globally Unique Identifier (entire table): ba.freestatistics.org/blog/index.php?pk=19076&T=0

As an alternative you can also use a QR Code:  

The GUIDs for individual cells are displayed in the table below:

Summary of computational transaction
Raw Inputview raw input (R code)
Raw Outputview raw output of R engine
Computing time2 seconds
R Server'Gwilym Jenkins' @ 72.249.127.135


Descriptive Statistics
# observations60
minimum0.908230842
Q10.926099674
median0.954696937
mean0.94988218375
Q30.974085657
maximum0.992844365

\begin{tabular}{lllllllll}
\hline
Descriptive Statistics \tabularnewline
# observations & 60 \tabularnewline
minimum & 0.908230842 \tabularnewline
Q1 & 0.926099674 \tabularnewline
median & 0.954696937 \tabularnewline
mean & 0.94988218375 \tabularnewline
Q3 & 0.974085657 \tabularnewline
maximum & 0.992844365 \tabularnewline
\hline
\end{tabular}
%Source: https://freestatistics.org/blog/index.php?pk=19076&T=1

[TABLE]
[ROW][C]Descriptive Statistics[/C][/ROW]
[ROW][C]# observations[/C][C]60[/C][/ROW]
[ROW][C]minimum[/C][C]0.908230842[/C][/ROW]
[ROW][C]Q1[/C][C]0.926099674[/C][/ROW]
[ROW][C]median[/C][C]0.954696937[/C][/ROW]
[ROW][C]mean[/C][C]0.94988218375[/C][/ROW]
[ROW][C]Q3[/C][C]0.974085657[/C][/ROW]
[ROW][C]maximum[/C][C]0.992844365[/C][/ROW]
[/TABLE]
Source: https://freestatistics.org/blog/index.php?pk=19076&T=1

Globally Unique Identifier (entire table): ba.freestatistics.org/blog/index.php?pk=19076&T=1

As an alternative you can also use a QR Code:  

The GUIDs for individual cells are displayed in the table below:

Descriptive Statistics
# observations60
minimum0.908230842
Q10.926099674
median0.954696937
mean0.94988218375
Q30.974085657
maximum0.992844365


Parameters (Session):
par1 = 0 ; par2 = 0 ;
Parameters (R input):
par1 = 0 ; par2 = 0 ;
R code (references can be found in the software module):
par1 <- as.numeric(par1)
par2 <- as.numeric(par2)
x <- as.ts(x)
library(lattice)
bitmap(file='pic1.png')
plot(x,type='l',main='Run Sequence Plot',xlab='time or index',ylab='value')
grid()
dev.off()
bitmap(file='pic2.png')
hist(x)
grid()
dev.off()
bitmap(file='pic3.png')
if (par1 > 0)
{
densityplot(~x,col='black',main=paste('Density Plot bw = ',par1),bw=par1)
} else {
densityplot(~x,col='black',main='Density Plot')
}
dev.off()
bitmap(file='pic4.png')
qqnorm(x)
grid()
dev.off()
if (par2 > 0)
{
bitmap(file='lagplot.png')
dum <- cbind(lag(x,k=1),x)
dum
dum1 <- dum[2:length(x),]
dum1
z <- as.data.frame(dum1)
z
plot(z,main=paste('Lag plot, lowess, and regression line'))
lines(lowess(z))
abline(lm(z))
dev.off()
bitmap(file='pic5.png')
acf(x,lag.max=par2,main='Autocorrelation Function')
grid()
dev.off()
}
summary(x)
load(file='createtable')
a<-table.start()
a<-table.row.start(a)
a<-table.element(a,'Descriptive Statistics',2,TRUE)
a<-table.row.end(a)
a<-table.row.start(a)
a<-table.element(a,'# observations',header=TRUE)
a<-table.element(a,length(x))
a<-table.row.end(a)
a<-table.row.start(a)
a<-table.element(a,'minimum',header=TRUE)
a<-table.element(a,min(x))
a<-table.row.end(a)
a<-table.row.start(a)
a<-table.element(a,'Q1',header=TRUE)
a<-table.element(a,quantile(x,0.25))
a<-table.row.end(a)
a<-table.row.start(a)
a<-table.element(a,'median',header=TRUE)
a<-table.element(a,median(x))
a<-table.row.end(a)
a<-table.row.start(a)
a<-table.element(a,'mean',header=TRUE)
a<-table.element(a,mean(x))
a<-table.row.end(a)
a<-table.row.start(a)
a<-table.element(a,'Q3',header=TRUE)
a<-table.element(a,quantile(x,0.75))
a<-table.row.end(a)
a<-table.row.start(a)
a<-table.element(a,'maximum',header=TRUE)
a<-table.element(a,max(x))
a<-table.row.end(a)
a<-table.end(a)
table.save(a,file='mytable.tab')