Free Statistics

of Irreproducible Research!

Author's title

Author*The author of this computation has been verified*
R Software Modulerwasp_edauni.wasp
Title produced by softwareUnivariate Explorative Data Analysis
Date of computationSun, 26 Oct 2008 16:11:46 -0600
Cite this page as followsStatistical Computations at FreeStatistics.org, Office for Research Development and Education, URL https://freestatistics.org/blog/index.php?v=date/2008/Oct/26/t1225059206x1iat8dmx98khbp.htm/, Retrieved Sun, 19 May 2024 13:38:45 +0000
Statistical Computations at FreeStatistics.org, Office for Research Development and Education, URL https://freestatistics.org/blog/index.php?pk=19069, Retrieved Sun, 19 May 2024 13:38:45 +0000
QR Codes:

Original text written by user:
IsPrivate?No (this computation is public)
User-defined keywords
Estimated Impact149
Family? (F = Feedback message, R = changed R code, M = changed R Module, P = changed Parameters, D = changed Data)
F     [Univariate Data Series] [Werkloosheid <25 ...] [2008-10-12 15:06:53] [44ec60eb6065a3f81a5f756bd5af1faf]
F RMPD    [Univariate Explorative Data Analysis] [Werloosheid <25 U...] [2008-10-26 22:11:46] [924502d03698cd41cacbcd1327858815] [Current]
Feedback Forum
2008-11-01 12:49:53 [Davy De Nef] [reply
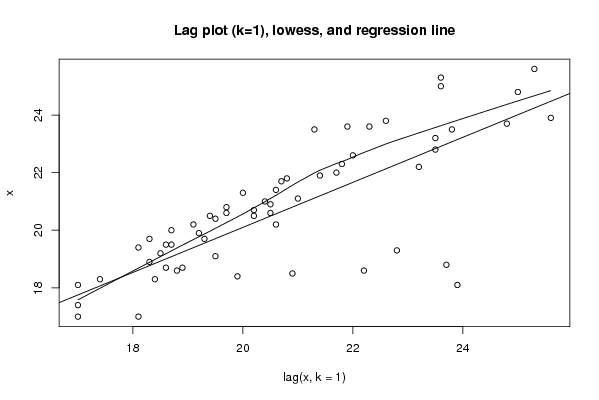
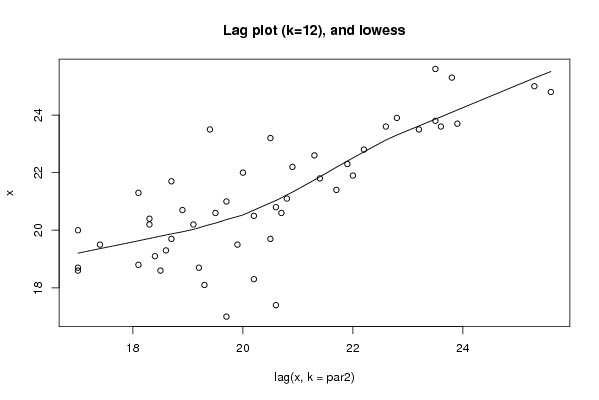
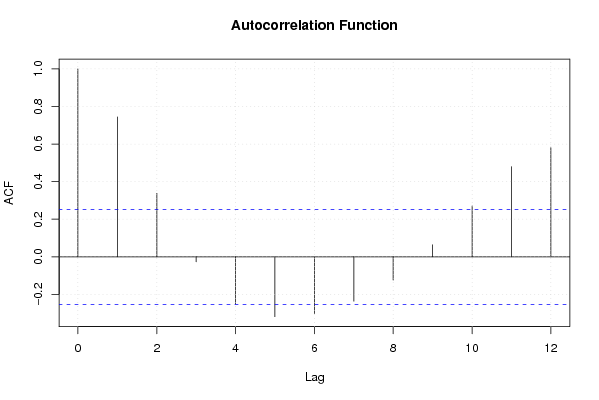
De student past de 4 assumpties toe op zijn eigen reeksen. De 4 assumpties moeten kloppen om een geldige reeks te hebben.

1. Randomness

2. Fixed distribution
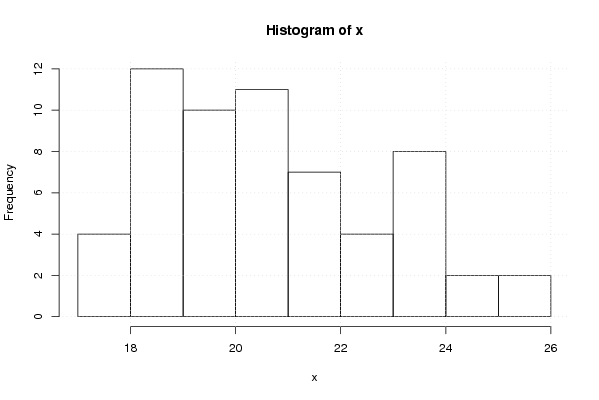
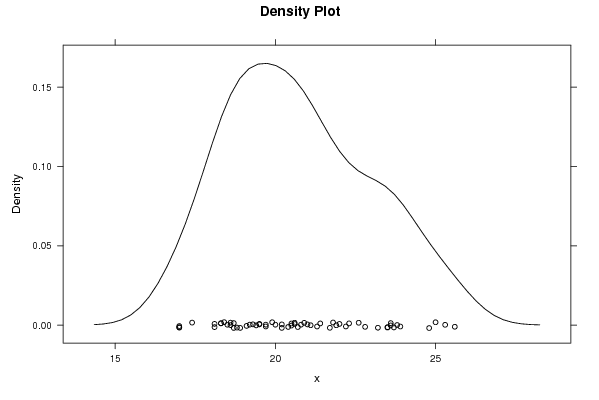
Dit wordt bekeken via de histogram en de density plot. Deze geeft min of meer een normaalverdeling weer.
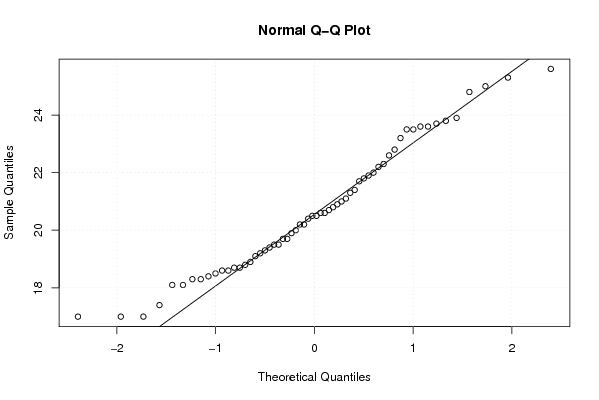
Ook de normal QQ plot kan je in deze context bekijken. We zien dat de meeste punten vrij dicht bij de linieaire rechte liggen.

3. Fixed location
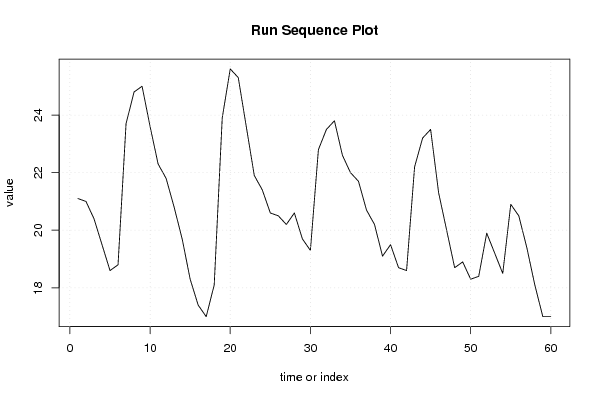
Hiervoor gebruiken we de run sequence plot. Deze wordt door de student weergegeven op langere termijn. Op deze manier kan je zien dat er een licht dalend verloop is. Er is dus geen sprake van een constante.

4. Fixed variation
We gebruiken hiervoor de run sequence plot. Zo kunnen we zien of de spreiding gelijk is of niet. We zien dat de linkerkant van de grafiek grotere schommelingen weergeeft dan de rechterkant.

De conclusie die de student hier maakt, klopt.

Post a new message
Dataseries X:
21.1
21
20.4
19.5
18.6
18.8
23.7
24.8
25
23.6
22.3
21.8
20.8
19.7
18.3
17.4
17
18.1
23.9
25.6
25.3
23.6
21.9
21.4
20.6
20.5
20.2
20.6
19.7
19.3
22.8
23.5
23.8
22.6
22
21.7
20.7
20.2
19.1
19.5
18.7
18.6
22.2
23.2
23.5
21.3
20
18.7
18.9
18.3
18.4
19.9
19.2
18.5
20.9
20.5
19.4
18.1
17
17


Summary of computational transaction
Raw Inputview raw input (R code)
Raw Outputview raw output of R engine
Computing time4 seconds
R Server'Sir Ronald Aylmer Fisher' @ 193.190.124.24

\begin{tabular}{lllllllll}
\hline
Summary of computational transaction \tabularnewline
Raw Input & view raw input (R code)  \tabularnewline
Raw Output & view raw output of R engine  \tabularnewline
Computing time & 4 seconds \tabularnewline
R Server & 'Sir Ronald Aylmer Fisher' @ 193.190.124.24 \tabularnewline
\hline
\end{tabular}
%Source: https://freestatistics.org/blog/index.php?pk=19069&T=0

[TABLE]
[ROW][C]Summary of computational transaction[/C][/ROW]
[ROW][C]Raw Input[/C][C]view raw input (R code) [/C][/ROW]
[ROW][C]Raw Output[/C][C]view raw output of R engine [/C][/ROW]
[ROW][C]Computing time[/C][C]4 seconds[/C][/ROW]
[ROW][C]R Server[/C][C]'Sir Ronald Aylmer Fisher' @ 193.190.124.24[/C][/ROW]
[/TABLE]
Source: https://freestatistics.org/blog/index.php?pk=19069&T=0

Globally Unique Identifier (entire table): ba.freestatistics.org/blog/index.php?pk=19069&T=0

As an alternative you can also use a QR Code:  

The GUIDs for individual cells are displayed in the table below:

Summary of computational transaction
Raw Inputview raw input (R code)
Raw Outputview raw output of R engine
Computing time4 seconds
R Server'Sir Ronald Aylmer Fisher' @ 193.190.124.24


Descriptive Statistics
# observations60
minimum17
Q118.875
median20.5
mean20.7116666666667
Q322.225
maximum25.6

\begin{tabular}{lllllllll}
\hline
Descriptive Statistics \tabularnewline
# observations & 60 \tabularnewline
minimum & 17 \tabularnewline
Q1 & 18.875 \tabularnewline
median & 20.5 \tabularnewline
mean & 20.7116666666667 \tabularnewline
Q3 & 22.225 \tabularnewline
maximum & 25.6 \tabularnewline
\hline
\end{tabular}
%Source: https://freestatistics.org/blog/index.php?pk=19069&T=1

[TABLE]
[ROW][C]Descriptive Statistics[/C][/ROW]
[ROW][C]# observations[/C][C]60[/C][/ROW]
[ROW][C]minimum[/C][C]17[/C][/ROW]
[ROW][C]Q1[/C][C]18.875[/C][/ROW]
[ROW][C]median[/C][C]20.5[/C][/ROW]
[ROW][C]mean[/C][C]20.7116666666667[/C][/ROW]
[ROW][C]Q3[/C][C]22.225[/C][/ROW]
[ROW][C]maximum[/C][C]25.6[/C][/ROW]
[/TABLE]
Source: https://freestatistics.org/blog/index.php?pk=19069&T=1

Globally Unique Identifier (entire table): ba.freestatistics.org/blog/index.php?pk=19069&T=1

As an alternative you can also use a QR Code:  

The GUIDs for individual cells are displayed in the table below:

Descriptive Statistics
# observations60
minimum17
Q118.875
median20.5
mean20.7116666666667
Q322.225
maximum25.6


Parameters (Session):
par1 = 0 ; par2 = 12 ;
Parameters (R input):
par1 = 0 ; par2 = 12 ;
R code (references can be found in the software module):
par1 <- as.numeric(par1)
par2 <- as.numeric(par2)
x <- as.ts(x)
library(lattice)
bitmap(file='pic1.png')
plot(x,type='l',main='Run Sequence Plot',xlab='time or index',ylab='value')
grid()
dev.off()
bitmap(file='pic2.png')
hist(x)
grid()
dev.off()
bitmap(file='pic3.png')
if (par1 > 0)
{
densityplot(~x,col='black',main=paste('Density Plot bw = ',par1),bw=par1)
} else {
densityplot(~x,col='black',main='Density Plot')
}
dev.off()
bitmap(file='pic4.png')
qqnorm(x)
qqline(x)
grid()
dev.off()
if (par2 > 0)
{
bitmap(file='lagplot1.png')
dum <- cbind(lag(x,k=1),x)
dum
dum1 <- dum[2:length(x),]
dum1
z <- as.data.frame(dum1)
z
plot(z,main='Lag plot (k=1), lowess, and regression line')
lines(lowess(z))
abline(lm(z))
dev.off()
if (par2 > 1) {
bitmap(file='lagplotpar2.png')
dum <- cbind(lag(x,k=par2),x)
dum
dum1 <- dum[(par2+1):length(x),]
dum1
z <- as.data.frame(dum1)
z
mylagtitle <- 'Lag plot (k='
mylagtitle <- paste(mylagtitle,par2,sep='')
mylagtitle <- paste(mylagtitle,'), and lowess',sep='')
plot(z,main=mylagtitle)
lines(lowess(z))
dev.off()
}
bitmap(file='pic5.png')
acf(x,lag.max=par2,main='Autocorrelation Function')
grid()
dev.off()
}
summary(x)
load(file='createtable')
a<-table.start()
a<-table.row.start(a)
a<-table.element(a,'Descriptive Statistics',2,TRUE)
a<-table.row.end(a)
a<-table.row.start(a)
a<-table.element(a,'# observations',header=TRUE)
a<-table.element(a,length(x))
a<-table.row.end(a)
a<-table.row.start(a)
a<-table.element(a,'minimum',header=TRUE)
a<-table.element(a,min(x))
a<-table.row.end(a)
a<-table.row.start(a)
a<-table.element(a,'Q1',header=TRUE)
a<-table.element(a,quantile(x,0.25))
a<-table.row.end(a)
a<-table.row.start(a)
a<-table.element(a,'median',header=TRUE)
a<-table.element(a,median(x))
a<-table.row.end(a)
a<-table.row.start(a)
a<-table.element(a,'mean',header=TRUE)
a<-table.element(a,mean(x))
a<-table.row.end(a)
a<-table.row.start(a)
a<-table.element(a,'Q3',header=TRUE)
a<-table.element(a,quantile(x,0.75))
a<-table.row.end(a)
a<-table.row.start(a)
a<-table.element(a,'maximum',header=TRUE)
a<-table.element(a,max(x))
a<-table.row.end(a)
a<-table.end(a)
table.save(a,file='mytable.tab')