Free Statistics

of Irreproducible Research!

Author's title

Author*The author of this computation has been verified*
R Software Modulerwasp_edauni.wasp
Title produced by softwareUnivariate Explorative Data Analysis
Date of computationSun, 26 Oct 2008 12:30:50 -0600
Cite this page as followsStatistical Computations at FreeStatistics.org, Office for Research Development and Education, URL https://freestatistics.org/blog/index.php?v=date/2008/Oct/26/t12250458868wx10zbq8wzd8lp.htm/, Retrieved Sun, 19 May 2024 15:41:35 +0000
Statistical Computations at FreeStatistics.org, Office for Research Development and Education, URL https://freestatistics.org/blog/index.php?pk=19007, Retrieved Sun, 19 May 2024 15:41:35 +0000
QR Codes:

Original text written by user:
IsPrivate?No (this computation is public)
User-defined keywords
Estimated Impact172
Family? (F = Feedback message, R = changed R code, M = changed R Module, P = changed Parameters, D = changed Data)
F     [Univariate Explorative Data Analysis] [Investigation Dis...] [2007-10-21 17:06:37] [b9964c45117f7aac638ab9056d451faa]
F    D    [Univariate Explorative Data Analysis] [] [2008-10-26 18:30:50] [c0a347e3519123f7eef62b705326dad9] [Current]
F    D      [Univariate Explorative Data Analysis] [] [2008-10-26 19:01:54] [29747f79f5beb5b2516e1271770ecb47]
F    D        [Univariate Explorative Data Analysis] [] [2008-10-26 19:04:49] [29747f79f5beb5b2516e1271770ecb47]
-               [Univariate Explorative Data Analysis] [] [2008-10-26 19:07:10] [29747f79f5beb5b2516e1271770ecb47]
F    D            [Univariate Explorative Data Analysis] [] [2008-10-26 19:09:23] [29747f79f5beb5b2516e1271770ecb47]
F    D              [Univariate Explorative Data Analysis] [] [2008-10-26 19:10:36] [29747f79f5beb5b2516e1271770ecb47]
-   PD        [Univariate Explorative Data Analysis] [] [2008-11-02 20:59:59] [29747f79f5beb5b2516e1271770ecb47]
Feedback Forum
2008-10-29 12:35:26 [Ken Van den Heuvel] [reply
Q2: assumpties 3 & 4.

Assumptie 3:
Fixed location:

http://www.freestatistics.org/blog/index.php?v=date/2008/Oct/28/t1225220484jswurbt3ibggf56.htm

Best is om via central tendency dit even te verifieren, louter op het zicht via is nogal riskant. Uit mijn berekening blijkt dat de locatie niet altijd vast is over de gehele termijn, kijk maar naar de winzorised mean plot.

Assumptie 4:
Fixed variation:

Hiervoor kan je bovenstaande link gebruiken, of deze nieuwe waar ik het gemiddelde van de x waarden heb afgetrokken om de error component over te houden.
http://www.freestatistics.org/blog/index.php?v=date/2008/Oct/28/t1225220321std1trcmlbp0m19.htm

Je ziet dat de mean van de errors binnen het betrouwbaarheidsinterval ligt. De variatie zal dus vast zijn.
Je conclusie dat de student gelijk had in het voorbeeld document is dus fout (gezien de student geen echt antwoord formuleerde).
2008-11-03 17:39:58 [Jeroen Michel] [reply
Ook hier maak je de klassieke fout. Het is nodig de verschillende lags in te stellen. Onderstaande link geeft een correcte berekening weer evenals een correcte conclusie en feedback.

Assumptie 1:
Hierbij heb ik deze keer inderdaad gekeken naar de lag plot ipv. de run sequence plot. De resultaten zijn terug te vinden onder deze link:
lag 1: Statistical Computations at FreeStatistics.org, Office for Research Development and Education, URL http://www.freestatistics.org/blog/date/2008/Nov/02/t12256648775yuu0x8xxg6fgch.htm, Retrieved Sun, 02 Nov 2008 22:28:06 +0000 Tevens houden we rekening met de puntenwolken zoals opgesomd door de vorige studente.

lag 12: Statistical Computations at FreeStatistics.org, Office for Research Development and Education, URL http://www.freestatistics.org/blog/date/2008/Nov/02/t1225665259gny0zbzwwq6rpqr.htm, Retrieved Sun, 02 Nov 2008 22:34:28 +0000

lag 36: Statistical Computations at FreeStatistics.org, Office for Research Development and Education, URL http://www.freestatistics.org/blog/date/2008/Nov/02/t1225665398n329mjtqxwani17.htm, Retrieved Sun, 02 Nov 2008 22:36:51 +0000

Assumptie 2:
Hier is inderdaad een foute interpretatie gemaakt. Hier is er inderdaad sprake van een normaalverdeling. Aangezien er in Q1 geen autocorrelatie is, is er hier sprake van normaalverdeling. De resulaten zijn wel op de juiste grafieken afgelezen geweest.

Assumptie 3:
Statistical Computations at FreeStatistics.org, Office for Research Development and Education, URL http://www.freestatistics.org/blog/date/2008/Nov/02/t1225665670l3jnqcbv4p6c0d6.htm, Retrieved Sun, 02 Nov 2008 22:41:15 +0000
In bovenstaande berekening vind u de juiste oplossingen terug. Hier zijn de opmerkingen van voorgaande studente op waar te nemen en zien we op het einde inderdaad de dalende trend.

Assumptie 4:
Hier is er niet gewerkt door de verschillende lags in te stellen. Belangrijk is hier wel dat deze aanpassingen gebeuren om tot volgende voorwaarde te komen: Clothing Production = constant + random component.

Post a new message
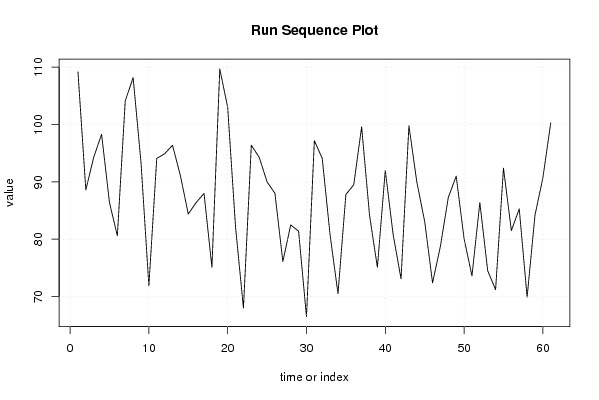
Dataseries X:
109.20
88.60
94.30
98.30
86.40
80.60
104.10
108.20
93.40
71.90
94.10
94.90
96.40
91.10
84.40
86.40
88.00
75.10
109.70
103.00
82.10
68.00
96.40
94.30
90.00
88.00
76.10
82.50
81.40
66.50
97.20
94.10
80.70
70.50
87.80
89.50
99.60
84.20
75.10
92.00
80.80
73.10
99.80
90.00
83.10
72.40
78.80
87.30
91.00
80.10
73.60
86.40
74.50
71.20
92.40
81.50
85.30
69.90
84.20
90.70
100.30


Summary of computational transaction
Raw Inputview raw input (R code)
Raw Outputview raw output of R engine
Computing time2 seconds
R Server'George Udny Yule' @ 72.249.76.132

\begin{tabular}{lllllllll}
\hline
Summary of computational transaction \tabularnewline
Raw Input & view raw input (R code)  \tabularnewline
Raw Output & view raw output of R engine  \tabularnewline
Computing time & 2 seconds \tabularnewline
R Server & 'George Udny Yule' @ 72.249.76.132 \tabularnewline
\hline
\end{tabular}
%Source: https://freestatistics.org/blog/index.php?pk=19007&T=0

[TABLE]
[ROW][C]Summary of computational transaction[/C][/ROW]
[ROW][C]Raw Input[/C][C]view raw input (R code) [/C][/ROW]
[ROW][C]Raw Output[/C][C]view raw output of R engine [/C][/ROW]
[ROW][C]Computing time[/C][C]2 seconds[/C][/ROW]
[ROW][C]R Server[/C][C]'George Udny Yule' @ 72.249.76.132[/C][/ROW]
[/TABLE]
Source: https://freestatistics.org/blog/index.php?pk=19007&T=0

Globally Unique Identifier (entire table): ba.freestatistics.org/blog/index.php?pk=19007&T=0

As an alternative you can also use a QR Code:  

The GUIDs for individual cells are displayed in the table below:

Summary of computational transaction
Raw Inputview raw input (R code)
Raw Outputview raw output of R engine
Computing time2 seconds
R Server'George Udny Yule' @ 72.249.76.132


Descriptive Statistics
# observations61
minimum66.5
Q180.6
median87.3
mean86.8934426229508
Q394.1
maximum109.7

\begin{tabular}{lllllllll}
\hline
Descriptive Statistics \tabularnewline
# observations & 61 \tabularnewline
minimum & 66.5 \tabularnewline
Q1 & 80.6 \tabularnewline
median & 87.3 \tabularnewline
mean & 86.8934426229508 \tabularnewline
Q3 & 94.1 \tabularnewline
maximum & 109.7 \tabularnewline
\hline
\end{tabular}
%Source: https://freestatistics.org/blog/index.php?pk=19007&T=1

[TABLE]
[ROW][C]Descriptive Statistics[/C][/ROW]
[ROW][C]# observations[/C][C]61[/C][/ROW]
[ROW][C]minimum[/C][C]66.5[/C][/ROW]
[ROW][C]Q1[/C][C]80.6[/C][/ROW]
[ROW][C]median[/C][C]87.3[/C][/ROW]
[ROW][C]mean[/C][C]86.8934426229508[/C][/ROW]
[ROW][C]Q3[/C][C]94.1[/C][/ROW]
[ROW][C]maximum[/C][C]109.7[/C][/ROW]
[/TABLE]
Source: https://freestatistics.org/blog/index.php?pk=19007&T=1

Globally Unique Identifier (entire table): ba.freestatistics.org/blog/index.php?pk=19007&T=1

As an alternative you can also use a QR Code:  

The GUIDs for individual cells are displayed in the table below:

Descriptive Statistics
# observations61
minimum66.5
Q180.6
median87.3
mean86.8934426229508
Q394.1
maximum109.7


Parameters (Session):
par1 = 0 ; par2 = 0 ;
Parameters (R input):
par1 = 0 ; par2 = 0 ;
R code (references can be found in the software module):
par1 <- as.numeric(par1)
par2 <- as.numeric(par2)
x <- as.ts(x)
library(lattice)
bitmap(file='pic1.png')
plot(x,type='l',main='Run Sequence Plot',xlab='time or index',ylab='value')
grid()
dev.off()
bitmap(file='pic2.png')
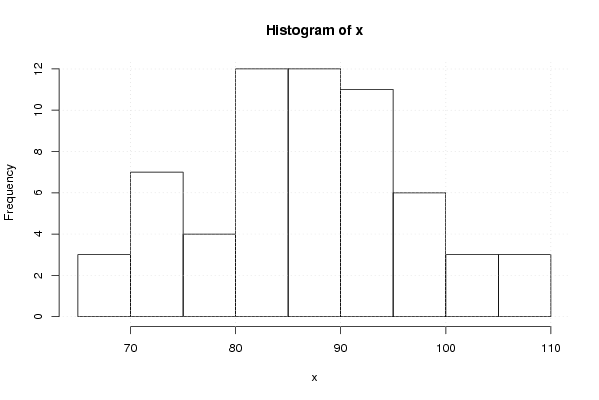
hist(x)
grid()
dev.off()
bitmap(file='pic3.png')
if (par1 > 0)
{
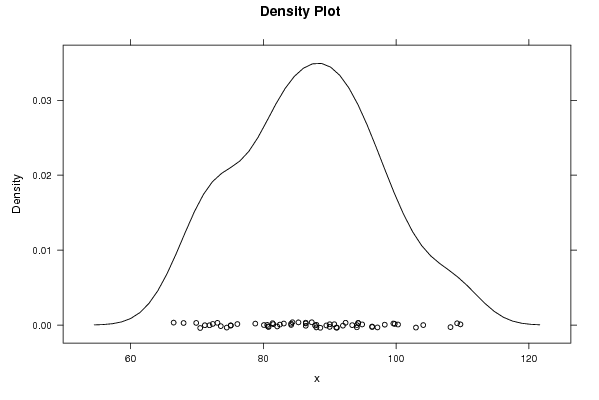
densityplot(~x,col='black',main=paste('Density Plot bw = ',par1),bw=par1)
} else {
densityplot(~x,col='black',main='Density Plot')
}
dev.off()
bitmap(file='pic4.png')
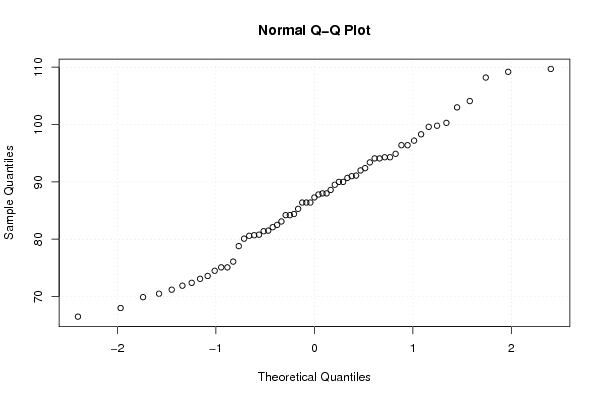
qqnorm(x)
grid()
dev.off()
if (par2 > 0)
{
bitmap(file='lagplot.png')
dum <- cbind(lag(x,k=1),x)
dum
dum1 <- dum[2:length(x),]
dum1
z <- as.data.frame(dum1)
z
plot(z,main=paste('Lag plot, lowess, and regression line'))
lines(lowess(z))
abline(lm(z))
dev.off()
bitmap(file='pic5.png')
acf(x,lag.max=par2,main='Autocorrelation Function')
grid()
dev.off()
}
summary(x)
load(file='createtable')
a<-table.start()
a<-table.row.start(a)
a<-table.element(a,'Descriptive Statistics',2,TRUE)
a<-table.row.end(a)
a<-table.row.start(a)
a<-table.element(a,'# observations',header=TRUE)
a<-table.element(a,length(x))
a<-table.row.end(a)
a<-table.row.start(a)
a<-table.element(a,'minimum',header=TRUE)
a<-table.element(a,min(x))
a<-table.row.end(a)
a<-table.row.start(a)
a<-table.element(a,'Q1',header=TRUE)
a<-table.element(a,quantile(x,0.25))
a<-table.row.end(a)
a<-table.row.start(a)
a<-table.element(a,'median',header=TRUE)
a<-table.element(a,median(x))
a<-table.row.end(a)
a<-table.row.start(a)
a<-table.element(a,'mean',header=TRUE)
a<-table.element(a,mean(x))
a<-table.row.end(a)
a<-table.row.start(a)
a<-table.element(a,'Q3',header=TRUE)
a<-table.element(a,quantile(x,0.75))
a<-table.row.end(a)
a<-table.row.start(a)
a<-table.element(a,'maximum',header=TRUE)
a<-table.element(a,max(x))
a<-table.row.end(a)
a<-table.end(a)
table.save(a,file='mytable.tab')