Free Statistics

of Irreproducible Research!

Author's title

Author*The author of this computation has been verified*
R Software Modulerwasp_edauni.wasp
Title produced by softwareUnivariate Explorative Data Analysis
Date of computationSun, 26 Oct 2008 11:36:04 -0600
Cite this page as followsStatistical Computations at FreeStatistics.org, Office for Research Development and Education, URL https://freestatistics.org/blog/index.php?v=date/2008/Oct/26/t1225042614n9nhe2h78ier7ze.htm/, Retrieved Sun, 19 May 2024 13:20:36 +0000
Statistical Computations at FreeStatistics.org, Office for Research Development and Education, URL https://freestatistics.org/blog/index.php?pk=18988, Retrieved Sun, 19 May 2024 13:20:36 +0000
QR Codes:

Original text written by user:
IsPrivate?No (this computation is public)
User-defined keywords
Estimated Impact191
Family? (F = Feedback message, R = changed R code, M = changed R Module, P = changed Parameters, D = changed Data)
-     [Maximum-likelihood Fitting - Exponential Distribution] [Taak 4 Deel 2 Mod...] [2008-10-23 11:18:07] [819b576fab25b35cfda70f80599828ec]
F RMPD    [Univariate Explorative Data Analysis] [Investigating Dis...] [2008-10-26 17:36:04] [e08fee3874f3333d6b7a377a061b860d] [Current]
Feedback Forum
2008-11-02 11:02:05 [Kevin Neelen] [reply
Dit was een eerste model dat we geprobeerd hadden, waarbij we de linkerzijde van de vergelijking hebben aangepast naar: Kleidngproductie / afzetprijsindex binnenland voor kleding.
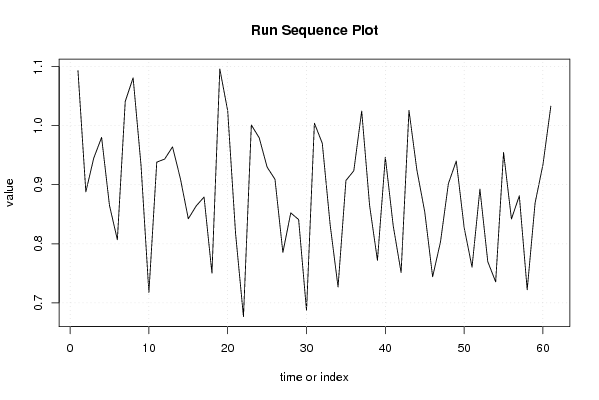
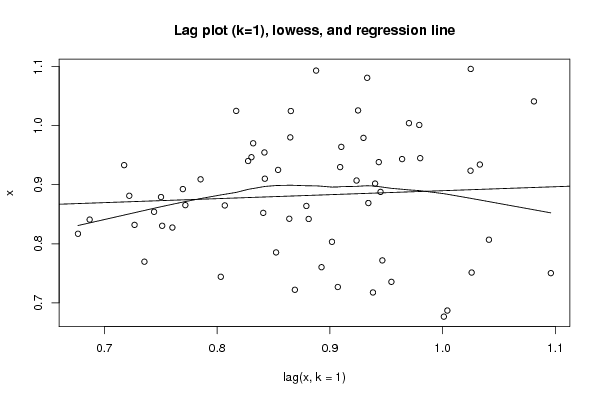
We kunnen hier dan zien dat de kledingproductie ongeveer even snel groeit in vergelijking met de prijsindex en bijgevolg ongeveer gelijk loopt met de algemene stijging in de prijsindex. Dit uit zich in het run sequence plot door een vrij egaal gelijklopende tendens in de grafiek.
2008-11-02 14:12:32 [Stijn Van de Velde] [reply
Goede grafiek + goede uitleg.
2008-11-02 20:26:05 [Yara Van Overstraeten] [reply
Mooie grafiek en correcte conclusie.
2008-11-03 08:38:14 [Siem Van Opstal] [reply
correcte conclusie

Post a new message
Dataseries X:
1.093093093
0.887775551
0.94488978
0.980059821
0.864864865
0.806806807
1.041
1.080919081
0.933066933
0.71756487
0.938185444
0.94333996
0.964
0.91008991
0.842315369
0.864
0.879120879
0.75024975
1.095904096
1.024875622
0.816915423
0.676616915
1.001038422
0.979231568
0.929752066
0.909090909
0.785345717
0.852272727
0.840909091
0.686983471
1.004132231
0.970103093
0.831958763
0.726804124
0.907024793
0.923632611
1.024691358
0.865364851
0.771839671
0.946502058
0.830421377
0.751284687
1.025693731
0.924974306
0.854059609
0.744090442
0.803261978
0.901859504
0.940082645
0.827479339
0.760330579
0.892561983
0.769628099
0.73553719
0.954545455
0.841942149
0.881198347
0.722107438
0.868937049
0.934088568
1.032955716


Summary of computational transaction
Raw Inputview raw input (R code)
Raw Outputview raw output of R engine
Computing time4 seconds
R Server'Sir Ronald Aylmer Fisher' @ 193.190.124.24

\begin{tabular}{lllllllll}
\hline
Summary of computational transaction \tabularnewline
Raw Input & view raw input (R code)  \tabularnewline
Raw Output & view raw output of R engine  \tabularnewline
Computing time & 4 seconds \tabularnewline
R Server & 'Sir Ronald Aylmer Fisher' @ 193.190.124.24 \tabularnewline
\hline
\end{tabular}
%Source: https://freestatistics.org/blog/index.php?pk=18988&T=0

[TABLE]
[ROW][C]Summary of computational transaction[/C][/ROW]
[ROW][C]Raw Input[/C][C]view raw input (R code) [/C][/ROW]
[ROW][C]Raw Output[/C][C]view raw output of R engine [/C][/ROW]
[ROW][C]Computing time[/C][C]4 seconds[/C][/ROW]
[ROW][C]R Server[/C][C]'Sir Ronald Aylmer Fisher' @ 193.190.124.24[/C][/ROW]
[/TABLE]
Source: https://freestatistics.org/blog/index.php?pk=18988&T=0

Globally Unique Identifier (entire table): ba.freestatistics.org/blog/index.php?pk=18988&T=0

As an alternative you can also use a QR Code:  

The GUIDs for individual cells are displayed in the table below:

Summary of computational transaction
Raw Inputview raw input (R code)
Raw Outputview raw output of R engine
Computing time4 seconds
R Server'Sir Ronald Aylmer Fisher' @ 193.190.124.24


Descriptive Statistics
# observations61
minimum0.676616915
Q10.816915423
median0.887775551
mean0.885399539081967
Q30.946502058
maximum1.095904096

\begin{tabular}{lllllllll}
\hline
Descriptive Statistics \tabularnewline
# observations & 61 \tabularnewline
minimum & 0.676616915 \tabularnewline
Q1 & 0.816915423 \tabularnewline
median & 0.887775551 \tabularnewline
mean & 0.885399539081967 \tabularnewline
Q3 & 0.946502058 \tabularnewline
maximum & 1.095904096 \tabularnewline
\hline
\end{tabular}
%Source: https://freestatistics.org/blog/index.php?pk=18988&T=1

[TABLE]
[ROW][C]Descriptive Statistics[/C][/ROW]
[ROW][C]# observations[/C][C]61[/C][/ROW]
[ROW][C]minimum[/C][C]0.676616915[/C][/ROW]
[ROW][C]Q1[/C][C]0.816915423[/C][/ROW]
[ROW][C]median[/C][C]0.887775551[/C][/ROW]
[ROW][C]mean[/C][C]0.885399539081967[/C][/ROW]
[ROW][C]Q3[/C][C]0.946502058[/C][/ROW]
[ROW][C]maximum[/C][C]1.095904096[/C][/ROW]
[/TABLE]
Source: https://freestatistics.org/blog/index.php?pk=18988&T=1

Globally Unique Identifier (entire table): ba.freestatistics.org/blog/index.php?pk=18988&T=1

As an alternative you can also use a QR Code:  

The GUIDs for individual cells are displayed in the table below:

Descriptive Statistics
# observations61
minimum0.676616915
Q10.816915423
median0.887775551
mean0.885399539081967
Q30.946502058
maximum1.095904096


Parameters (Session):
par1 = 0 ; par2 = 12 ;
Parameters (R input):
par1 = 0 ; par2 = 12 ;
R code (references can be found in the software module):
par1 <- as.numeric(par1)
par2 <- as.numeric(par2)
x <- as.ts(x)
library(lattice)
bitmap(file='pic1.png')
plot(x,type='l',main='Run Sequence Plot',xlab='time or index',ylab='value')
grid()
dev.off()
bitmap(file='pic2.png')
hist(x)
grid()
dev.off()
bitmap(file='pic3.png')
if (par1 > 0)
{
densityplot(~x,col='black',main=paste('Density Plot bw = ',par1),bw=par1)
} else {
densityplot(~x,col='black',main='Density Plot')
}
dev.off()
bitmap(file='pic4.png')
qqnorm(x)
qqline(x)
grid()
dev.off()
if (par2 > 0)
{
bitmap(file='lagplot1.png')
dum <- cbind(lag(x,k=1),x)
dum
dum1 <- dum[2:length(x),]
dum1
z <- as.data.frame(dum1)
z
plot(z,main='Lag plot (k=1), lowess, and regression line')
lines(lowess(z))
abline(lm(z))
dev.off()
if (par2 > 1) {
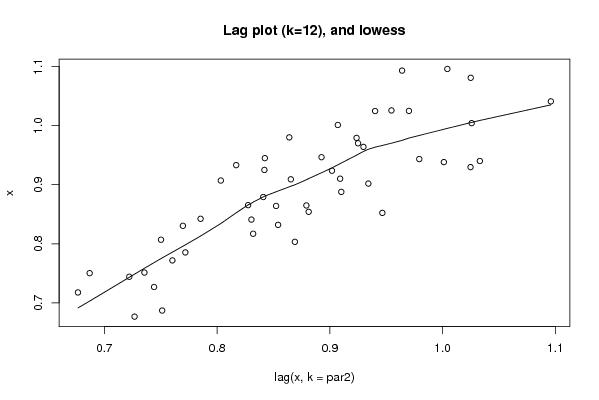
bitmap(file='lagplotpar2.png')
dum <- cbind(lag(x,k=par2),x)
dum
dum1 <- dum[(par2+1):length(x),]
dum1
z <- as.data.frame(dum1)
z
mylagtitle <- 'Lag plot (k='
mylagtitle <- paste(mylagtitle,par2,sep='')
mylagtitle <- paste(mylagtitle,'), and lowess',sep='')
plot(z,main=mylagtitle)
lines(lowess(z))
dev.off()
}
bitmap(file='pic5.png')
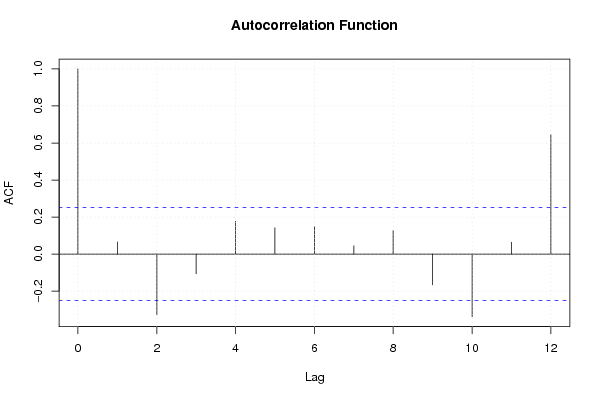
acf(x,lag.max=par2,main='Autocorrelation Function')
grid()
dev.off()
}
summary(x)
load(file='createtable')
a<-table.start()
a<-table.row.start(a)
a<-table.element(a,'Descriptive Statistics',2,TRUE)
a<-table.row.end(a)
a<-table.row.start(a)
a<-table.element(a,'# observations',header=TRUE)
a<-table.element(a,length(x))
a<-table.row.end(a)
a<-table.row.start(a)
a<-table.element(a,'minimum',header=TRUE)
a<-table.element(a,min(x))
a<-table.row.end(a)
a<-table.row.start(a)
a<-table.element(a,'Q1',header=TRUE)
a<-table.element(a,quantile(x,0.25))
a<-table.row.end(a)
a<-table.row.start(a)
a<-table.element(a,'median',header=TRUE)
a<-table.element(a,median(x))
a<-table.row.end(a)
a<-table.row.start(a)
a<-table.element(a,'mean',header=TRUE)
a<-table.element(a,mean(x))
a<-table.row.end(a)
a<-table.row.start(a)
a<-table.element(a,'Q3',header=TRUE)
a<-table.element(a,quantile(x,0.75))
a<-table.row.end(a)
a<-table.row.start(a)
a<-table.element(a,'maximum',header=TRUE)
a<-table.element(a,max(x))
a<-table.row.end(a)
a<-table.end(a)
table.save(a,file='mytable.tab')