Free Statistics

of Irreproducible Research!

Author's title

Author*Unverified author*
R Software Modulerwasp_centraltendency.wasp
Title produced by softwareCentral Tendency
Date of computationSun, 26 Oct 2008 09:55:24 -0600
Cite this page as followsStatistical Computations at FreeStatistics.org, Office for Research Development and Education, URL https://freestatistics.org/blog/index.php?v=date/2008/Oct/26/t1225036548pmxvctfyuk2shio.htm/, Retrieved Tue, 28 May 2024 17:36:23 +0000
Statistical Computations at FreeStatistics.org, Office for Research Development and Education, URL https://freestatistics.org/blog/index.php?pk=18957, Retrieved Tue, 28 May 2024 17:36:23 +0000
QR Codes:

Original text written by user:
IsPrivate?No (this computation is public)
User-defined keywords
Estimated Impact155
Family? (F = Feedback message, R = changed R code, M = changed R Module, P = changed Parameters, D = changed Data)
F     [Univariate Data Series] [Werkloosheid mannen] [2008-10-13 15:28:04] [7d3039e6253bb5fb3b26df1537d500b4]
-   PD  [Univariate Data Series] [] [2008-10-20 14:53:04] [af90f76a5211a482a7c35f2c76d2fd61]
- RMPD    [Central Tendency] [] [2008-10-26 15:32:39] [af90f76a5211a482a7c35f2c76d2fd61]
- RMP       [Stem-and-leaf Plot] [] [2008-10-26 15:35:41] [af90f76a5211a482a7c35f2c76d2fd61]
- RMPD        [Percentiles] [] [2008-10-26 15:38:00] [af90f76a5211a482a7c35f2c76d2fd61]
- RMP           [Harrell-Davis Quantiles] [] [2008-10-26 15:40:03] [af90f76a5211a482a7c35f2c76d2fd61]
- RMPD            [Central Tendency] [] [2008-10-26 15:42:50] [af90f76a5211a482a7c35f2c76d2fd61]
- RM D              [Stem-and-leaf Plot] [] [2008-10-26 15:44:02] [af90f76a5211a482a7c35f2c76d2fd61]
- RM                  [Percentiles] [] [2008-10-26 15:45:16] [af90f76a5211a482a7c35f2c76d2fd61]
- RM                    [Harrell-Davis Quantiles] [] [2008-10-26 15:46:52] [af90f76a5211a482a7c35f2c76d2fd61]
- RM D                    [Central Tendency] [] [2008-10-26 15:49:47] [af90f76a5211a482a7c35f2c76d2fd61]
- RM D                      [Stem-and-leaf Plot] [] [2008-10-26 15:51:02] [af90f76a5211a482a7c35f2c76d2fd61]
- RM                          [Percentiles] [] [2008-10-26 15:52:22] [af90f76a5211a482a7c35f2c76d2fd61]
- RM                            [Harrell-Davis Quantiles] [] [2008-10-26 15:53:29] [af90f76a5211a482a7c35f2c76d2fd61]
- RM D                              [Central Tendency] [] [2008-10-26 15:55:24] [e0f4dc76ea1a8276fe566258b977cec4] [Current]
- RM D                                [Stem-and-leaf Plot] [] [2008-10-26 15:56:53] [af90f76a5211a482a7c35f2c76d2fd61]
- RM                                    [Percentiles] [] [2008-10-26 15:58:01] [af90f76a5211a482a7c35f2c76d2fd61]
- RM                                      [Harrell-Davis Quantiles] [] [2008-10-26 15:59:16] [af90f76a5211a482a7c35f2c76d2fd61]
Feedback Forum

Post a new message
Dataseries X:
1,4200
1,4100
1,4200
1,4200
1,4200
1,4200
1,4200
1,4200
1,4300
1,4200
1,4000
1,4100
1,4000
1,4100
1,4000
1,3800
1,3900
1,3900
1,3700
1,3800
1,3700
1,3600
1,3700
1,3700
1,3800
1,3800
1,3800
1,3700
1,3800
1,3600
1,3500
1,3400
1,3300
1,3200
1,3200
1,3200
1,3300
1,3300
1,3200
1,3200
1,3300
1,3300
1,3400
1,3400
1,3300
1,3300
1,3200
1,3000
1,3100
1,3400
1,3500
1,3600
1,3700
1,3600
1,3600
1,3600
1,3500
1,3400
1,3300
1,3200
1,2400
1,2400
1,2400
1,2400
1,2200
1,2700
1,2900
1,2900
1,3000
1,3200
1,3200
1,3200
1,3300
1,3600
1,3600
1,3600
1,3600
1,3600
1,3100
1,3500


Summary of computational transaction
Raw Inputview raw input (R code)
Raw Outputview raw output of R engine
Computing time1 seconds
R Server'George Udny Yule' @ 72.249.76.132

\begin{tabular}{lllllllll}
\hline
Summary of computational transaction \tabularnewline
Raw Input & view raw input (R code)  \tabularnewline
Raw Output & view raw output of R engine  \tabularnewline
Computing time & 1 seconds \tabularnewline
R Server & 'George Udny Yule' @ 72.249.76.132 \tabularnewline
\hline
\end{tabular}
%Source: https://freestatistics.org/blog/index.php?pk=18957&T=0

[TABLE]
[ROW][C]Summary of computational transaction[/C][/ROW]
[ROW][C]Raw Input[/C][C]view raw input (R code) [/C][/ROW]
[ROW][C]Raw Output[/C][C]view raw output of R engine [/C][/ROW]
[ROW][C]Computing time[/C][C]1 seconds[/C][/ROW]
[ROW][C]R Server[/C][C]'George Udny Yule' @ 72.249.76.132[/C][/ROW]
[/TABLE]
Source: https://freestatistics.org/blog/index.php?pk=18957&T=0

Globally Unique Identifier (entire table): ba.freestatistics.org/blog/index.php?pk=18957&T=0

As an alternative you can also use a QR Code:  

The GUIDs for individual cells are displayed in the table below:

Summary of computational transaction
Raw Inputview raw input (R code)
Raw Outputview raw output of R engine
Computing time1 seconds
R Server'George Udny Yule' @ 72.249.76.132


Central Tendency - Ungrouped Data
MeasureValueS.E.Value/S.E.
Arithmetic Mean1.349750.00528005262248422255.631921972201
Geometric Mean1.34892257790503
Harmonic Mean1.34808314817409
Quadratic Mean1.35056562224869
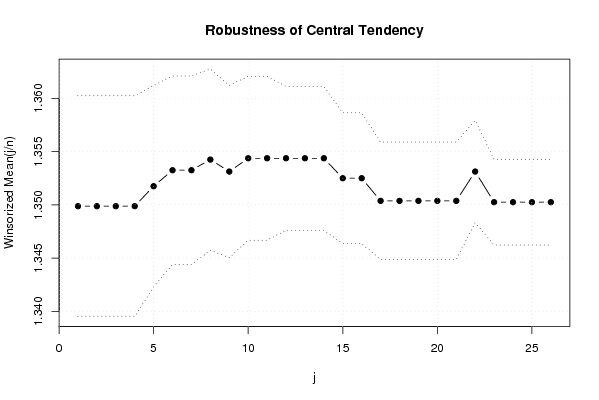
Winsorized Mean ( 1 / 26 )1.3498750.0051848542513358260.349651998844
Winsorized Mean ( 2 / 26 )1.3498750.0051848542513358260.349651998844
Winsorized Mean ( 3 / 26 )1.3498750.0051848542513358260.349651998844
Winsorized Mean ( 4 / 26 )1.3498750.0051848542513358260.349651998844
Winsorized Mean ( 5 / 26 )1.351750.00472595513084224286.026837448856
Winsorized Mean ( 6 / 26 )1.353250.00442509743867546305.812475036722
Winsorized Mean ( 7 / 26 )1.353250.00442509743867546305.812475036722
Winsorized Mean ( 8 / 26 )1.354250.00425372137893635318.368289635987
Winsorized Mean ( 9 / 26 )1.3531250.00404325407079652334.662372511613
Winsorized Mean ( 10 / 26 )1.3543750.00384775024683584351.991400978730
Winsorized Mean ( 11 / 26 )1.3543750.00384775024683584351.99140097873
Winsorized Mean ( 12 / 26 )1.3543750.00337453114417958401.352052220955
Winsorized Mean ( 13 / 26 )1.3543750.00337453114417958401.352052220955
Winsorized Mean ( 14 / 26 )1.3543750.00337453114417958401.352052220955
Winsorized Mean ( 15 / 26 )1.35250.00306831500371544440.795680483344
Winsorized Mean ( 16 / 26 )1.35250.00306831500371544440.795680483344
Winsorized Mean ( 17 / 26 )1.3503750.00275843786052536489.543382261587
Winsorized Mean ( 18 / 26 )1.3503750.00275843786052536489.543382261587
Winsorized Mean ( 19 / 26 )1.3503750.00275843786052536489.543382261587
Winsorized Mean ( 20 / 26 )1.3503750.00275843786052536489.543382261587
Winsorized Mean ( 21 / 26 )1.3503750.00275843786052536489.543382261587
Winsorized Mean ( 22 / 26 )1.3531250.00239721456240943564.457191783443
Winsorized Mean ( 23 / 26 )1.350250.00201242186734092670.957726067712
Winsorized Mean ( 24 / 26 )1.350250.00201242186734092670.957726067712
Winsorized Mean ( 25 / 26 )1.350250.00201242186734092670.957726067712
Winsorized Mean ( 26 / 26 )1.350250.00201242186734092670.957726067712
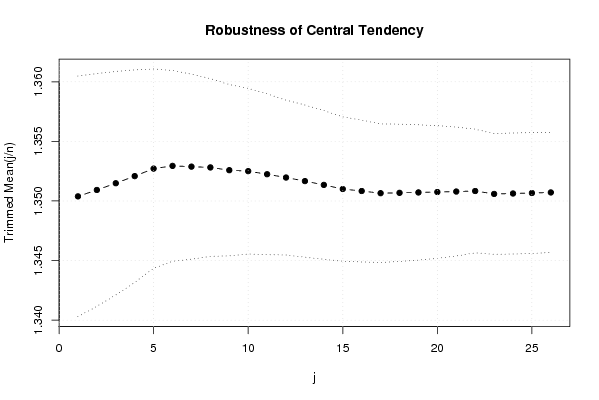
Trimmed Mean ( 1 / 26 )1.350384615384620.00504538941035359267.647252878739
Trimmed Mean ( 2 / 26 )1.350921052631580.0048816794334009276.732848000721
Trimmed Mean ( 3 / 26 )1.351486486486490.0046882936620268288.268309093553
Trimmed Mean ( 4 / 26 )1.352083333333330.0044578424327167303.304424447624
Trimmed Mean ( 5 / 26 )1.352714285714290.00417981657582154323.630059160768
Trimmed Mean ( 6 / 26 )1.352941176470590.00400317490071957337.967041167099
Trimmed Mean ( 7 / 26 )1.352878787878790.00387908834791923348.762045753478
Trimmed Mean ( 8 / 26 )1.35281250.00372989817246853362.694217763237
Trimmed Mean ( 9 / 26 )1.352580645161290.00359163111410510376.592306445229
Trimmed Mean ( 10 / 26 )1.35250.00347407671756799389.312070502234
Trimmed Mean ( 11 / 26 )1.352241379310340.00337281311773709400.923897087307
Trimmed Mean ( 12 / 26 )1.351964285714290.00324757294847377416.299897543381
Trimmed Mean ( 13 / 26 )1.351666666666670.00319142369252112423.530936940214
Trimmed Mean ( 14 / 26 )1.351346153846150.00311940414401755433.206500811314
Trimmed Mean ( 15 / 26 )1.3510.00302708858577387446.303423807672
Trimmed Mean ( 16 / 26 )1.350833333333330.00297497442228311454.065528501805
Trimmed Mean ( 17 / 26 )1.350652173913040.00290596876864704464.785509220004
Trimmed Mean ( 18 / 26 )1.350681818181820.00287876469706181469.187988709317
Trimmed Mean ( 19 / 26 )1.350714285714290.00283893735216726475.781645791918
Trimmed Mean ( 20 / 26 )1.350750.00278244266418684485.454747149211
Trimmed Mean ( 21 / 26 )1.350789473684210.00270349804872935499.645070696124
Trimmed Mean ( 22 / 26 )1.350833333333330.00259349001852532520.855420180652
Trimmed Mean ( 23 / 26 )1.350588235294120.00253113152993908533.590696223765
Trimmed Mean ( 24 / 26 )1.3506250.00253752085642152532.261635045116
Trimmed Mean ( 25 / 26 )1.350666666666670.00253405918216156533.005178479905
Trimmed Mean ( 26 / 26 )1.350714285714290.00251601071176942536.847589478017
Median1.355
Midrange1.325
Midmean - Weighted Average at Xnp1.34764705882353
Midmean - Weighted Average at X(n+1)p1.34764705882353
Midmean - Empirical Distribution Function1.34764705882353
Midmean - Empirical Distribution Function - Averaging1.34764705882353
Midmean - Empirical Distribution Function - Interpolation1.34764705882353
Midmean - Closest Observation1.34764705882353
Midmean - True Basic - Statistics Graphics Toolkit1.34764705882353
Midmean - MS Excel (old versions)1.34764705882353
Number of observations80

\begin{tabular}{lllllllll}
\hline
Central Tendency - Ungrouped Data \tabularnewline
Measure & Value & S.E. & Value/S.E. \tabularnewline
Arithmetic Mean & 1.34975 & 0.00528005262248422 & 255.631921972201 \tabularnewline
Geometric Mean & 1.34892257790503 &  &  \tabularnewline
Harmonic Mean & 1.34808314817409 &  &  \tabularnewline
Quadratic Mean & 1.35056562224869 &  &  \tabularnewline
Winsorized Mean ( 1 / 26 ) & 1.349875 & 0.0051848542513358 & 260.349651998844 \tabularnewline
Winsorized Mean ( 2 / 26 ) & 1.349875 & 0.0051848542513358 & 260.349651998844 \tabularnewline
Winsorized Mean ( 3 / 26 ) & 1.349875 & 0.0051848542513358 & 260.349651998844 \tabularnewline
Winsorized Mean ( 4 / 26 ) & 1.349875 & 0.0051848542513358 & 260.349651998844 \tabularnewline
Winsorized Mean ( 5 / 26 ) & 1.35175 & 0.00472595513084224 & 286.026837448856 \tabularnewline
Winsorized Mean ( 6 / 26 ) & 1.35325 & 0.00442509743867546 & 305.812475036722 \tabularnewline
Winsorized Mean ( 7 / 26 ) & 1.35325 & 0.00442509743867546 & 305.812475036722 \tabularnewline
Winsorized Mean ( 8 / 26 ) & 1.35425 & 0.00425372137893635 & 318.368289635987 \tabularnewline
Winsorized Mean ( 9 / 26 ) & 1.353125 & 0.00404325407079652 & 334.662372511613 \tabularnewline
Winsorized Mean ( 10 / 26 ) & 1.354375 & 0.00384775024683584 & 351.991400978730 \tabularnewline
Winsorized Mean ( 11 / 26 ) & 1.354375 & 0.00384775024683584 & 351.99140097873 \tabularnewline
Winsorized Mean ( 12 / 26 ) & 1.354375 & 0.00337453114417958 & 401.352052220955 \tabularnewline
Winsorized Mean ( 13 / 26 ) & 1.354375 & 0.00337453114417958 & 401.352052220955 \tabularnewline
Winsorized Mean ( 14 / 26 ) & 1.354375 & 0.00337453114417958 & 401.352052220955 \tabularnewline
Winsorized Mean ( 15 / 26 ) & 1.3525 & 0.00306831500371544 & 440.795680483344 \tabularnewline
Winsorized Mean ( 16 / 26 ) & 1.3525 & 0.00306831500371544 & 440.795680483344 \tabularnewline
Winsorized Mean ( 17 / 26 ) & 1.350375 & 0.00275843786052536 & 489.543382261587 \tabularnewline
Winsorized Mean ( 18 / 26 ) & 1.350375 & 0.00275843786052536 & 489.543382261587 \tabularnewline
Winsorized Mean ( 19 / 26 ) & 1.350375 & 0.00275843786052536 & 489.543382261587 \tabularnewline
Winsorized Mean ( 20 / 26 ) & 1.350375 & 0.00275843786052536 & 489.543382261587 \tabularnewline
Winsorized Mean ( 21 / 26 ) & 1.350375 & 0.00275843786052536 & 489.543382261587 \tabularnewline
Winsorized Mean ( 22 / 26 ) & 1.353125 & 0.00239721456240943 & 564.457191783443 \tabularnewline
Winsorized Mean ( 23 / 26 ) & 1.35025 & 0.00201242186734092 & 670.957726067712 \tabularnewline
Winsorized Mean ( 24 / 26 ) & 1.35025 & 0.00201242186734092 & 670.957726067712 \tabularnewline
Winsorized Mean ( 25 / 26 ) & 1.35025 & 0.00201242186734092 & 670.957726067712 \tabularnewline
Winsorized Mean ( 26 / 26 ) & 1.35025 & 0.00201242186734092 & 670.957726067712 \tabularnewline
Trimmed Mean ( 1 / 26 ) & 1.35038461538462 & 0.00504538941035359 & 267.647252878739 \tabularnewline
Trimmed Mean ( 2 / 26 ) & 1.35092105263158 & 0.0048816794334009 & 276.732848000721 \tabularnewline
Trimmed Mean ( 3 / 26 ) & 1.35148648648649 & 0.0046882936620268 & 288.268309093553 \tabularnewline
Trimmed Mean ( 4 / 26 ) & 1.35208333333333 & 0.0044578424327167 & 303.304424447624 \tabularnewline
Trimmed Mean ( 5 / 26 ) & 1.35271428571429 & 0.00417981657582154 & 323.630059160768 \tabularnewline
Trimmed Mean ( 6 / 26 ) & 1.35294117647059 & 0.00400317490071957 & 337.967041167099 \tabularnewline
Trimmed Mean ( 7 / 26 ) & 1.35287878787879 & 0.00387908834791923 & 348.762045753478 \tabularnewline
Trimmed Mean ( 8 / 26 ) & 1.3528125 & 0.00372989817246853 & 362.694217763237 \tabularnewline
Trimmed Mean ( 9 / 26 ) & 1.35258064516129 & 0.00359163111410510 & 376.592306445229 \tabularnewline
Trimmed Mean ( 10 / 26 ) & 1.3525 & 0.00347407671756799 & 389.312070502234 \tabularnewline
Trimmed Mean ( 11 / 26 ) & 1.35224137931034 & 0.00337281311773709 & 400.923897087307 \tabularnewline
Trimmed Mean ( 12 / 26 ) & 1.35196428571429 & 0.00324757294847377 & 416.299897543381 \tabularnewline
Trimmed Mean ( 13 / 26 ) & 1.35166666666667 & 0.00319142369252112 & 423.530936940214 \tabularnewline
Trimmed Mean ( 14 / 26 ) & 1.35134615384615 & 0.00311940414401755 & 433.206500811314 \tabularnewline
Trimmed Mean ( 15 / 26 ) & 1.351 & 0.00302708858577387 & 446.303423807672 \tabularnewline
Trimmed Mean ( 16 / 26 ) & 1.35083333333333 & 0.00297497442228311 & 454.065528501805 \tabularnewline
Trimmed Mean ( 17 / 26 ) & 1.35065217391304 & 0.00290596876864704 & 464.785509220004 \tabularnewline
Trimmed Mean ( 18 / 26 ) & 1.35068181818182 & 0.00287876469706181 & 469.187988709317 \tabularnewline
Trimmed Mean ( 19 / 26 ) & 1.35071428571429 & 0.00283893735216726 & 475.781645791918 \tabularnewline
Trimmed Mean ( 20 / 26 ) & 1.35075 & 0.00278244266418684 & 485.454747149211 \tabularnewline
Trimmed Mean ( 21 / 26 ) & 1.35078947368421 & 0.00270349804872935 & 499.645070696124 \tabularnewline
Trimmed Mean ( 22 / 26 ) & 1.35083333333333 & 0.00259349001852532 & 520.855420180652 \tabularnewline
Trimmed Mean ( 23 / 26 ) & 1.35058823529412 & 0.00253113152993908 & 533.590696223765 \tabularnewline
Trimmed Mean ( 24 / 26 ) & 1.350625 & 0.00253752085642152 & 532.261635045116 \tabularnewline
Trimmed Mean ( 25 / 26 ) & 1.35066666666667 & 0.00253405918216156 & 533.005178479905 \tabularnewline
Trimmed Mean ( 26 / 26 ) & 1.35071428571429 & 0.00251601071176942 & 536.847589478017 \tabularnewline
Median & 1.355 &  &  \tabularnewline
Midrange & 1.325 &  &  \tabularnewline
Midmean - Weighted Average at Xnp & 1.34764705882353 &  &  \tabularnewline
Midmean - Weighted Average at X(n+1)p & 1.34764705882353 &  &  \tabularnewline
Midmean - Empirical Distribution Function & 1.34764705882353 &  &  \tabularnewline
Midmean - Empirical Distribution Function - Averaging & 1.34764705882353 &  &  \tabularnewline
Midmean - Empirical Distribution Function - Interpolation & 1.34764705882353 &  &  \tabularnewline
Midmean - Closest Observation & 1.34764705882353 &  &  \tabularnewline
Midmean - True Basic - Statistics Graphics Toolkit & 1.34764705882353 &  &  \tabularnewline
Midmean - MS Excel (old versions) & 1.34764705882353 &  &  \tabularnewline
Number of observations & 80 &  &  \tabularnewline
\hline
\end{tabular}
%Source: https://freestatistics.org/blog/index.php?pk=18957&T=1

[TABLE]
[ROW][C]Central Tendency - Ungrouped Data[/C][/ROW]
[ROW][C]Measure[/C][C]Value[/C][C]S.E.[/C][C]Value/S.E.[/C][/ROW]
[ROW][C]Arithmetic Mean[/C][C]1.34975[/C][C]0.00528005262248422[/C][C]255.631921972201[/C][/ROW]
[ROW][C]Geometric Mean[/C][C]1.34892257790503[/C][C][/C][C][/C][/ROW]
[ROW][C]Harmonic Mean[/C][C]1.34808314817409[/C][C][/C][C][/C][/ROW]
[ROW][C]Quadratic Mean[/C][C]1.35056562224869[/C][C][/C][C][/C][/ROW]
[ROW][C]Winsorized Mean ( 1 / 26 )[/C][C]1.349875[/C][C]0.0051848542513358[/C][C]260.349651998844[/C][/ROW]
[ROW][C]Winsorized Mean ( 2 / 26 )[/C][C]1.349875[/C][C]0.0051848542513358[/C][C]260.349651998844[/C][/ROW]
[ROW][C]Winsorized Mean ( 3 / 26 )[/C][C]1.349875[/C][C]0.0051848542513358[/C][C]260.349651998844[/C][/ROW]
[ROW][C]Winsorized Mean ( 4 / 26 )[/C][C]1.349875[/C][C]0.0051848542513358[/C][C]260.349651998844[/C][/ROW]
[ROW][C]Winsorized Mean ( 5 / 26 )[/C][C]1.35175[/C][C]0.00472595513084224[/C][C]286.026837448856[/C][/ROW]
[ROW][C]Winsorized Mean ( 6 / 26 )[/C][C]1.35325[/C][C]0.00442509743867546[/C][C]305.812475036722[/C][/ROW]
[ROW][C]Winsorized Mean ( 7 / 26 )[/C][C]1.35325[/C][C]0.00442509743867546[/C][C]305.812475036722[/C][/ROW]
[ROW][C]Winsorized Mean ( 8 / 26 )[/C][C]1.35425[/C][C]0.00425372137893635[/C][C]318.368289635987[/C][/ROW]
[ROW][C]Winsorized Mean ( 9 / 26 )[/C][C]1.353125[/C][C]0.00404325407079652[/C][C]334.662372511613[/C][/ROW]
[ROW][C]Winsorized Mean ( 10 / 26 )[/C][C]1.354375[/C][C]0.00384775024683584[/C][C]351.991400978730[/C][/ROW]
[ROW][C]Winsorized Mean ( 11 / 26 )[/C][C]1.354375[/C][C]0.00384775024683584[/C][C]351.99140097873[/C][/ROW]
[ROW][C]Winsorized Mean ( 12 / 26 )[/C][C]1.354375[/C][C]0.00337453114417958[/C][C]401.352052220955[/C][/ROW]
[ROW][C]Winsorized Mean ( 13 / 26 )[/C][C]1.354375[/C][C]0.00337453114417958[/C][C]401.352052220955[/C][/ROW]
[ROW][C]Winsorized Mean ( 14 / 26 )[/C][C]1.354375[/C][C]0.00337453114417958[/C][C]401.352052220955[/C][/ROW]
[ROW][C]Winsorized Mean ( 15 / 26 )[/C][C]1.3525[/C][C]0.00306831500371544[/C][C]440.795680483344[/C][/ROW]
[ROW][C]Winsorized Mean ( 16 / 26 )[/C][C]1.3525[/C][C]0.00306831500371544[/C][C]440.795680483344[/C][/ROW]
[ROW][C]Winsorized Mean ( 17 / 26 )[/C][C]1.350375[/C][C]0.00275843786052536[/C][C]489.543382261587[/C][/ROW]
[ROW][C]Winsorized Mean ( 18 / 26 )[/C][C]1.350375[/C][C]0.00275843786052536[/C][C]489.543382261587[/C][/ROW]
[ROW][C]Winsorized Mean ( 19 / 26 )[/C][C]1.350375[/C][C]0.00275843786052536[/C][C]489.543382261587[/C][/ROW]
[ROW][C]Winsorized Mean ( 20 / 26 )[/C][C]1.350375[/C][C]0.00275843786052536[/C][C]489.543382261587[/C][/ROW]
[ROW][C]Winsorized Mean ( 21 / 26 )[/C][C]1.350375[/C][C]0.00275843786052536[/C][C]489.543382261587[/C][/ROW]
[ROW][C]Winsorized Mean ( 22 / 26 )[/C][C]1.353125[/C][C]0.00239721456240943[/C][C]564.457191783443[/C][/ROW]
[ROW][C]Winsorized Mean ( 23 / 26 )[/C][C]1.35025[/C][C]0.00201242186734092[/C][C]670.957726067712[/C][/ROW]
[ROW][C]Winsorized Mean ( 24 / 26 )[/C][C]1.35025[/C][C]0.00201242186734092[/C][C]670.957726067712[/C][/ROW]
[ROW][C]Winsorized Mean ( 25 / 26 )[/C][C]1.35025[/C][C]0.00201242186734092[/C][C]670.957726067712[/C][/ROW]
[ROW][C]Winsorized Mean ( 26 / 26 )[/C][C]1.35025[/C][C]0.00201242186734092[/C][C]670.957726067712[/C][/ROW]
[ROW][C]Trimmed Mean ( 1 / 26 )[/C][C]1.35038461538462[/C][C]0.00504538941035359[/C][C]267.647252878739[/C][/ROW]
[ROW][C]Trimmed Mean ( 2 / 26 )[/C][C]1.35092105263158[/C][C]0.0048816794334009[/C][C]276.732848000721[/C][/ROW]
[ROW][C]Trimmed Mean ( 3 / 26 )[/C][C]1.35148648648649[/C][C]0.0046882936620268[/C][C]288.268309093553[/C][/ROW]
[ROW][C]Trimmed Mean ( 4 / 26 )[/C][C]1.35208333333333[/C][C]0.0044578424327167[/C][C]303.304424447624[/C][/ROW]
[ROW][C]Trimmed Mean ( 5 / 26 )[/C][C]1.35271428571429[/C][C]0.00417981657582154[/C][C]323.630059160768[/C][/ROW]
[ROW][C]Trimmed Mean ( 6 / 26 )[/C][C]1.35294117647059[/C][C]0.00400317490071957[/C][C]337.967041167099[/C][/ROW]
[ROW][C]Trimmed Mean ( 7 / 26 )[/C][C]1.35287878787879[/C][C]0.00387908834791923[/C][C]348.762045753478[/C][/ROW]
[ROW][C]Trimmed Mean ( 8 / 26 )[/C][C]1.3528125[/C][C]0.00372989817246853[/C][C]362.694217763237[/C][/ROW]
[ROW][C]Trimmed Mean ( 9 / 26 )[/C][C]1.35258064516129[/C][C]0.00359163111410510[/C][C]376.592306445229[/C][/ROW]
[ROW][C]Trimmed Mean ( 10 / 26 )[/C][C]1.3525[/C][C]0.00347407671756799[/C][C]389.312070502234[/C][/ROW]
[ROW][C]Trimmed Mean ( 11 / 26 )[/C][C]1.35224137931034[/C][C]0.00337281311773709[/C][C]400.923897087307[/C][/ROW]
[ROW][C]Trimmed Mean ( 12 / 26 )[/C][C]1.35196428571429[/C][C]0.00324757294847377[/C][C]416.299897543381[/C][/ROW]
[ROW][C]Trimmed Mean ( 13 / 26 )[/C][C]1.35166666666667[/C][C]0.00319142369252112[/C][C]423.530936940214[/C][/ROW]
[ROW][C]Trimmed Mean ( 14 / 26 )[/C][C]1.35134615384615[/C][C]0.00311940414401755[/C][C]433.206500811314[/C][/ROW]
[ROW][C]Trimmed Mean ( 15 / 26 )[/C][C]1.351[/C][C]0.00302708858577387[/C][C]446.303423807672[/C][/ROW]
[ROW][C]Trimmed Mean ( 16 / 26 )[/C][C]1.35083333333333[/C][C]0.00297497442228311[/C][C]454.065528501805[/C][/ROW]
[ROW][C]Trimmed Mean ( 17 / 26 )[/C][C]1.35065217391304[/C][C]0.00290596876864704[/C][C]464.785509220004[/C][/ROW]
[ROW][C]Trimmed Mean ( 18 / 26 )[/C][C]1.35068181818182[/C][C]0.00287876469706181[/C][C]469.187988709317[/C][/ROW]
[ROW][C]Trimmed Mean ( 19 / 26 )[/C][C]1.35071428571429[/C][C]0.00283893735216726[/C][C]475.781645791918[/C][/ROW]
[ROW][C]Trimmed Mean ( 20 / 26 )[/C][C]1.35075[/C][C]0.00278244266418684[/C][C]485.454747149211[/C][/ROW]
[ROW][C]Trimmed Mean ( 21 / 26 )[/C][C]1.35078947368421[/C][C]0.00270349804872935[/C][C]499.645070696124[/C][/ROW]
[ROW][C]Trimmed Mean ( 22 / 26 )[/C][C]1.35083333333333[/C][C]0.00259349001852532[/C][C]520.855420180652[/C][/ROW]
[ROW][C]Trimmed Mean ( 23 / 26 )[/C][C]1.35058823529412[/C][C]0.00253113152993908[/C][C]533.590696223765[/C][/ROW]
[ROW][C]Trimmed Mean ( 24 / 26 )[/C][C]1.350625[/C][C]0.00253752085642152[/C][C]532.261635045116[/C][/ROW]
[ROW][C]Trimmed Mean ( 25 / 26 )[/C][C]1.35066666666667[/C][C]0.00253405918216156[/C][C]533.005178479905[/C][/ROW]
[ROW][C]Trimmed Mean ( 26 / 26 )[/C][C]1.35071428571429[/C][C]0.00251601071176942[/C][C]536.847589478017[/C][/ROW]
[ROW][C]Median[/C][C]1.355[/C][C][/C][C][/C][/ROW]
[ROW][C]Midrange[/C][C]1.325[/C][C][/C][C][/C][/ROW]
[ROW][C]Midmean - Weighted Average at Xnp[/C][C]1.34764705882353[/C][C][/C][C][/C][/ROW]
[ROW][C]Midmean - Weighted Average at X(n+1)p[/C][C]1.34764705882353[/C][C][/C][C][/C][/ROW]
[ROW][C]Midmean - Empirical Distribution Function[/C][C]1.34764705882353[/C][C][/C][C][/C][/ROW]
[ROW][C]Midmean - Empirical Distribution Function - Averaging[/C][C]1.34764705882353[/C][C][/C][C][/C][/ROW]
[ROW][C]Midmean - Empirical Distribution Function - Interpolation[/C][C]1.34764705882353[/C][C][/C][C][/C][/ROW]
[ROW][C]Midmean - Closest Observation[/C][C]1.34764705882353[/C][C][/C][C][/C][/ROW]
[ROW][C]Midmean - True Basic - Statistics Graphics Toolkit[/C][C]1.34764705882353[/C][C][/C][C][/C][/ROW]
[ROW][C]Midmean - MS Excel (old versions)[/C][C]1.34764705882353[/C][C][/C][C][/C][/ROW]
[ROW][C]Number of observations[/C][C]80[/C][C][/C][C][/C][/ROW]
[/TABLE]
Source: https://freestatistics.org/blog/index.php?pk=18957&T=1

Globally Unique Identifier (entire table): ba.freestatistics.org/blog/index.php?pk=18957&T=1

As an alternative you can also use a QR Code:  

The GUIDs for individual cells are displayed in the table below:

Central Tendency - Ungrouped Data
MeasureValueS.E.Value/S.E.
Arithmetic Mean1.349750.00528005262248422255.631921972201
Geometric Mean1.34892257790503
Harmonic Mean1.34808314817409
Quadratic Mean1.35056562224869
Winsorized Mean ( 1 / 26 )1.3498750.0051848542513358260.349651998844
Winsorized Mean ( 2 / 26 )1.3498750.0051848542513358260.349651998844
Winsorized Mean ( 3 / 26 )1.3498750.0051848542513358260.349651998844
Winsorized Mean ( 4 / 26 )1.3498750.0051848542513358260.349651998844
Winsorized Mean ( 5 / 26 )1.351750.00472595513084224286.026837448856
Winsorized Mean ( 6 / 26 )1.353250.00442509743867546305.812475036722
Winsorized Mean ( 7 / 26 )1.353250.00442509743867546305.812475036722
Winsorized Mean ( 8 / 26 )1.354250.00425372137893635318.368289635987
Winsorized Mean ( 9 / 26 )1.3531250.00404325407079652334.662372511613
Winsorized Mean ( 10 / 26 )1.3543750.00384775024683584351.991400978730
Winsorized Mean ( 11 / 26 )1.3543750.00384775024683584351.99140097873
Winsorized Mean ( 12 / 26 )1.3543750.00337453114417958401.352052220955
Winsorized Mean ( 13 / 26 )1.3543750.00337453114417958401.352052220955
Winsorized Mean ( 14 / 26 )1.3543750.00337453114417958401.352052220955
Winsorized Mean ( 15 / 26 )1.35250.00306831500371544440.795680483344
Winsorized Mean ( 16 / 26 )1.35250.00306831500371544440.795680483344
Winsorized Mean ( 17 / 26 )1.3503750.00275843786052536489.543382261587
Winsorized Mean ( 18 / 26 )1.3503750.00275843786052536489.543382261587
Winsorized Mean ( 19 / 26 )1.3503750.00275843786052536489.543382261587
Winsorized Mean ( 20 / 26 )1.3503750.00275843786052536489.543382261587
Winsorized Mean ( 21 / 26 )1.3503750.00275843786052536489.543382261587
Winsorized Mean ( 22 / 26 )1.3531250.00239721456240943564.457191783443
Winsorized Mean ( 23 / 26 )1.350250.00201242186734092670.957726067712
Winsorized Mean ( 24 / 26 )1.350250.00201242186734092670.957726067712
Winsorized Mean ( 25 / 26 )1.350250.00201242186734092670.957726067712
Winsorized Mean ( 26 / 26 )1.350250.00201242186734092670.957726067712
Trimmed Mean ( 1 / 26 )1.350384615384620.00504538941035359267.647252878739
Trimmed Mean ( 2 / 26 )1.350921052631580.0048816794334009276.732848000721
Trimmed Mean ( 3 / 26 )1.351486486486490.0046882936620268288.268309093553
Trimmed Mean ( 4 / 26 )1.352083333333330.0044578424327167303.304424447624
Trimmed Mean ( 5 / 26 )1.352714285714290.00417981657582154323.630059160768
Trimmed Mean ( 6 / 26 )1.352941176470590.00400317490071957337.967041167099
Trimmed Mean ( 7 / 26 )1.352878787878790.00387908834791923348.762045753478
Trimmed Mean ( 8 / 26 )1.35281250.00372989817246853362.694217763237
Trimmed Mean ( 9 / 26 )1.352580645161290.00359163111410510376.592306445229
Trimmed Mean ( 10 / 26 )1.35250.00347407671756799389.312070502234
Trimmed Mean ( 11 / 26 )1.352241379310340.00337281311773709400.923897087307
Trimmed Mean ( 12 / 26 )1.351964285714290.00324757294847377416.299897543381
Trimmed Mean ( 13 / 26 )1.351666666666670.00319142369252112423.530936940214
Trimmed Mean ( 14 / 26 )1.351346153846150.00311940414401755433.206500811314
Trimmed Mean ( 15 / 26 )1.3510.00302708858577387446.303423807672
Trimmed Mean ( 16 / 26 )1.350833333333330.00297497442228311454.065528501805
Trimmed Mean ( 17 / 26 )1.350652173913040.00290596876864704464.785509220004
Trimmed Mean ( 18 / 26 )1.350681818181820.00287876469706181469.187988709317
Trimmed Mean ( 19 / 26 )1.350714285714290.00283893735216726475.781645791918
Trimmed Mean ( 20 / 26 )1.350750.00278244266418684485.454747149211
Trimmed Mean ( 21 / 26 )1.350789473684210.00270349804872935499.645070696124
Trimmed Mean ( 22 / 26 )1.350833333333330.00259349001852532520.855420180652
Trimmed Mean ( 23 / 26 )1.350588235294120.00253113152993908533.590696223765
Trimmed Mean ( 24 / 26 )1.3506250.00253752085642152532.261635045116
Trimmed Mean ( 25 / 26 )1.350666666666670.00253405918216156533.005178479905
Trimmed Mean ( 26 / 26 )1.350714285714290.00251601071176942536.847589478017
Median1.355
Midrange1.325
Midmean - Weighted Average at Xnp1.34764705882353
Midmean - Weighted Average at X(n+1)p1.34764705882353
Midmean - Empirical Distribution Function1.34764705882353
Midmean - Empirical Distribution Function - Averaging1.34764705882353
Midmean - Empirical Distribution Function - Interpolation1.34764705882353
Midmean - Closest Observation1.34764705882353
Midmean - True Basic - Statistics Graphics Toolkit1.34764705882353
Midmean - MS Excel (old versions)1.34764705882353
Number of observations80


Parameters (Session):
Parameters (R input):
R code (references can be found in the software module):
geomean <- function(x) {
return(exp(mean(log(x))))
}
harmean <- function(x) {
return(1/mean(1/x))
}
quamean <- function(x) {
return(sqrt(mean(x*x)))
}
winmean <- function(x) {
x <-sort(x[!is.na(x)])
n<-length(x)
denom <- 3
nodenom <- n/denom
if (nodenom>40) denom <- n/40
sqrtn = sqrt(n)
roundnodenom = floor(nodenom)
win <- array(NA,dim=c(roundnodenom,2))
for (j in 1:roundnodenom) {
win[j,1] <- (j*x[j+1]+sum(x[(j+1):(n-j)])+j*x[n-j])/n
win[j,2] <- sd(c(rep(x[j+1],j),x[(j+1):(n-j)],rep(x[n-j],j)))/sqrtn
}
return(win)
}
trimean <- function(x) {
x <-sort(x[!is.na(x)])
n<-length(x)
denom <- 3
nodenom <- n/denom
if (nodenom>40) denom <- n/40
sqrtn = sqrt(n)
roundnodenom = floor(nodenom)
tri <- array(NA,dim=c(roundnodenom,2))
for (j in 1:roundnodenom) {
tri[j,1] <- mean(x,trim=j/n)
tri[j,2] <- sd(x[(j+1):(n-j)]) / sqrt(n-j*2)
}
return(tri)
}
midrange <- function(x) {
return((max(x)+min(x))/2)
}
q1 <- function(data,n,p,i,f) {
np <- n*p;
i <<- floor(np)
f <<- np - i
qvalue <- (1-f)*data[i] + f*data[i+1]
}
q2 <- function(data,n,p,i,f) {
np <- (n+1)*p
i <<- floor(np)
f <<- np - i
qvalue <- (1-f)*data[i] + f*data[i+1]
}
q3 <- function(data,n,p,i,f) {
np <- n*p
i <<- floor(np)
f <<- np - i
if (f==0) {
qvalue <- data[i]
} else {
qvalue <- data[i+1]
}
}
q4 <- function(data,n,p,i,f) {
np <- n*p
i <<- floor(np)
f <<- np - i
if (f==0) {
qvalue <- (data[i]+data[i+1])/2
} else {
qvalue <- data[i+1]
}
}
q5 <- function(data,n,p,i,f) {
np <- (n-1)*p
i <<- floor(np)
f <<- np - i
if (f==0) {
qvalue <- data[i+1]
} else {
qvalue <- data[i+1] + f*(data[i+2]-data[i+1])
}
}
q6 <- function(data,n,p,i,f) {
np <- n*p+0.5
i <<- floor(np)
f <<- np - i
qvalue <- data[i]
}
q7 <- function(data,n,p,i,f) {
np <- (n+1)*p
i <<- floor(np)
f <<- np - i
if (f==0) {
qvalue <- data[i]
} else {
qvalue <- f*data[i] + (1-f)*data[i+1]
}
}
q8 <- function(data,n,p,i,f) {
np <- (n+1)*p
i <<- floor(np)
f <<- np - i
if (f==0) {
qvalue <- data[i]
} else {
if (f == 0.5) {
qvalue <- (data[i]+data[i+1])/2
} else {
if (f < 0.5) {
qvalue <- data[i]
} else {
qvalue <- data[i+1]
}
}
}
}
midmean <- function(x,def) {
x <-sort(x[!is.na(x)])
n<-length(x)
if (def==1) {
qvalue1 <- q1(x,n,0.25,i,f)
qvalue3 <- q1(x,n,0.75,i,f)
}
if (def==2) {
qvalue1 <- q2(x,n,0.25,i,f)
qvalue3 <- q2(x,n,0.75,i,f)
}
if (def==3) {
qvalue1 <- q3(x,n,0.25,i,f)
qvalue3 <- q3(x,n,0.75,i,f)
}
if (def==4) {
qvalue1 <- q4(x,n,0.25,i,f)
qvalue3 <- q4(x,n,0.75,i,f)
}
if (def==5) {
qvalue1 <- q5(x,n,0.25,i,f)
qvalue3 <- q5(x,n,0.75,i,f)
}
if (def==6) {
qvalue1 <- q6(x,n,0.25,i,f)
qvalue3 <- q6(x,n,0.75,i,f)
}
if (def==7) {
qvalue1 <- q7(x,n,0.25,i,f)
qvalue3 <- q7(x,n,0.75,i,f)
}
if (def==8) {
qvalue1 <- q8(x,n,0.25,i,f)
qvalue3 <- q8(x,n,0.75,i,f)
}
midm <- 0
myn <- 0
roundno4 <- round(n/4)
round3no4 <- round(3*n/4)
for (i in 1:n) {
if ((x[i]>=qvalue1) & (x[i]<=qvalue3)){
midm = midm + x[i]
myn = myn + 1
}
}
midm = midm / myn
return(midm)
}
(arm <- mean(x))
sqrtn <- sqrt(length(x))
(armse <- sd(x) / sqrtn)
(armose <- arm / armse)
(geo <- geomean(x))
(har <- harmean(x))
(qua <- quamean(x))
(win <- winmean(x))
(tri <- trimean(x))
(midr <- midrange(x))
midm <- array(NA,dim=8)
for (j in 1:8) midm[j] <- midmean(x,j)
midm
bitmap(file='test1.png')
lb <- win[,1] - 2*win[,2]
ub <- win[,1] + 2*win[,2]
if ((ylimmin == '') | (ylimmax == '')) plot(win[,1],type='b',main=main, xlab='j', pch=19, ylab='Winsorized Mean(j/n)', ylim=c(min(lb),max(ub))) else plot(win[,1],type='l',main=main, xlab='j', pch=19, ylab='Winsorized Mean(j/n)', ylim=c(ylimmin,ylimmax))
lines(ub,lty=3)
lines(lb,lty=3)
grid()
dev.off()
bitmap(file='test2.png')
lb <- tri[,1] - 2*tri[,2]
ub <- tri[,1] + 2*tri[,2]
if ((ylimmin == '') | (ylimmax == '')) plot(tri[,1],type='b',main=main, xlab='j', pch=19, ylab='Trimmed Mean(j/n)', ylim=c(min(lb),max(ub))) else plot(tri[,1],type='l',main=main, xlab='j', pch=19, ylab='Trimmed Mean(j/n)', ylim=c(ylimmin,ylimmax))
lines(ub,lty=3)
lines(lb,lty=3)
grid()
dev.off()
load(file='createtable')
a<-table.start()
a<-table.row.start(a)
a<-table.element(a,'Central Tendency - Ungrouped Data',4,TRUE)
a<-table.row.end(a)
a<-table.row.start(a)
a<-table.element(a,'Measure',header=TRUE)
a<-table.element(a,'Value',header=TRUE)
a<-table.element(a,'S.E.',header=TRUE)
a<-table.element(a,'Value/S.E.',header=TRUE)
a<-table.row.end(a)
a<-table.row.start(a)
a<-table.element(a,hyperlink('arithmetic_mean.htm', 'Arithmetic Mean', 'click to view the definition of the Arithmetic Mean'),header=TRUE)
a<-table.element(a,arm)
a<-table.element(a,hyperlink('arithmetic_mean_standard_error.htm', armse, 'click to view the definition of the Standard Error of the Arithmetic Mean'))
a<-table.element(a,armose)
a<-table.row.end(a)
a<-table.row.start(a)
a<-table.element(a,hyperlink('geometric_mean.htm', 'Geometric Mean', 'click to view the definition of the Geometric Mean'),header=TRUE)
a<-table.element(a,geo)
a<-table.element(a,'')
a<-table.row.end(a)
a<-table.row.start(a)
a<-table.element(a,hyperlink('harmonic_mean.htm', 'Harmonic Mean', 'click to view the definition of the Harmonic Mean'),header=TRUE)
a<-table.element(a,har)
a<-table.element(a,'')
a<-table.row.end(a)
a<-table.row.start(a)
a<-table.element(a,hyperlink('quadratic_mean.htm', 'Quadratic Mean', 'click to view the definition of the Quadratic Mean'),header=TRUE)
a<-table.element(a,qua)
a<-table.element(a,'')
a<-table.row.end(a)
for (j in 1:length(win[,1])) {
a<-table.row.start(a)
mylabel <- paste('Winsorized Mean (',j)
mylabel <- paste(mylabel,'/')
mylabel <- paste(mylabel,length(win[,1]))
mylabel <- paste(mylabel,')')
a<-table.element(a,hyperlink('winsorized_mean.htm', mylabel, 'click to view the definition of the Winsorized Mean'),header=TRUE)
a<-table.element(a,win[j,1])
a<-table.element(a,win[j,2])
a<-table.element(a,win[j,1]/win[j,2])
a<-table.row.end(a)
}
for (j in 1:length(tri[,1])) {
a<-table.row.start(a)
mylabel <- paste('Trimmed Mean (',j)
mylabel <- paste(mylabel,'/')
mylabel <- paste(mylabel,length(tri[,1]))
mylabel <- paste(mylabel,')')
a<-table.element(a,hyperlink('arithmetic_mean.htm', mylabel, 'click to view the definition of the Trimmed Mean'),header=TRUE)
a<-table.element(a,tri[j,1])
a<-table.element(a,tri[j,2])
a<-table.element(a,tri[j,1]/tri[j,2])
a<-table.row.end(a)
}
a<-table.row.start(a)
a<-table.element(a,hyperlink('median_1.htm', 'Median', 'click to view the definition of the Median'),header=TRUE)
a<-table.element(a,median(x))
a<-table.element(a,'')
a<-table.row.end(a)
a<-table.row.start(a)
a<-table.element(a,hyperlink('midrange.htm', 'Midrange', 'click to view the definition of the Midrange'),header=TRUE)
a<-table.element(a,midr)
a<-table.element(a,'')
a<-table.row.end(a)
a<-table.row.start(a)
mymid <- hyperlink('midmean.htm', 'Midmean', 'click to view the definition of the Midmean')
mylabel <- paste(mymid,hyperlink('method_1.htm','Weighted Average at Xnp',''),sep=' - ')
a<-table.element(a,mylabel,header=TRUE)
a<-table.element(a,midm[1])
a<-table.element(a,'')
a<-table.row.end(a)
a<-table.row.start(a)
mymid <- hyperlink('midmean.htm', 'Midmean', 'click to view the definition of the Midmean')
mylabel <- paste(mymid,hyperlink('method_2.htm','Weighted Average at X(n+1)p',''),sep=' - ')
a<-table.element(a,mylabel,header=TRUE)
a<-table.element(a,midm[2])
a<-table.element(a,'')
a<-table.row.end(a)
a<-table.row.start(a)
mymid <- hyperlink('midmean.htm', 'Midmean', 'click to view the definition of the Midmean')
mylabel <- paste(mymid,hyperlink('method_3.htm','Empirical Distribution Function',''),sep=' - ')
a<-table.element(a,mylabel,header=TRUE)
a<-table.element(a,midm[3])
a<-table.element(a,'')
a<-table.row.end(a)
a<-table.row.start(a)
mymid <- hyperlink('midmean.htm', 'Midmean', 'click to view the definition of the Midmean')
mylabel <- paste(mymid,hyperlink('method_4.htm','Empirical Distribution Function - Averaging',''),sep=' - ')
a<-table.element(a,mylabel,header=TRUE)
a<-table.element(a,midm[4])
a<-table.element(a,'')
a<-table.row.end(a)
a<-table.row.start(a)
mymid <- hyperlink('midmean.htm', 'Midmean', 'click to view the definition of the Midmean')
mylabel <- paste(mymid,hyperlink('method_5.htm','Empirical Distribution Function - Interpolation',''),sep=' - ')
a<-table.element(a,mylabel,header=TRUE)
a<-table.element(a,midm[5])
a<-table.element(a,'')
a<-table.row.end(a)
a<-table.row.start(a)
mymid <- hyperlink('midmean.htm', 'Midmean', 'click to view the definition of the Midmean')
mylabel <- paste(mymid,hyperlink('method_6.htm','Closest Observation',''),sep=' - ')
a<-table.element(a,mylabel,header=TRUE)
a<-table.element(a,midm[6])
a<-table.element(a,'')
a<-table.row.end(a)
a<-table.row.start(a)
mymid <- hyperlink('midmean.htm', 'Midmean', 'click to view the definition of the Midmean')
mylabel <- paste(mymid,hyperlink('method_7.htm','True Basic - Statistics Graphics Toolkit',''),sep=' - ')
a<-table.element(a,mylabel,header=TRUE)
a<-table.element(a,midm[7])
a<-table.element(a,'')
a<-table.row.end(a)
a<-table.row.start(a)
mymid <- hyperlink('midmean.htm', 'Midmean', 'click to view the definition of the Midmean')
mylabel <- paste(mymid,hyperlink('method_8.htm','MS Excel (old versions)',''),sep=' - ')
a<-table.element(a,mylabel,header=TRUE)
a<-table.element(a,midm[8])
a<-table.element(a,'')
a<-table.row.end(a)
a<-table.row.start(a)
a<-table.element(a,'Number of observations',header=TRUE)
a<-table.element(a,length(x))
a<-table.element(a,'')
a<-table.row.end(a)
a<-table.end(a)
table.save(a,file='mytable.tab')