Free Statistics

of Irreproducible Research!

Author's title

Author*The author of this computation has been verified*
R Software Modulerwasp_edauni.wasp
Title produced by softwareUnivariate Explorative Data Analysis
Date of computationSat, 25 Oct 2008 10:18:51 -0600
Cite this page as followsStatistical Computations at FreeStatistics.org, Office for Research Development and Education, URL https://freestatistics.org/blog/index.php?v=date/2008/Oct/25/t1224951570lwdk4c14sgevi2u.htm/, Retrieved Sun, 19 May 2024 15:22:48 +0000
Statistical Computations at FreeStatistics.org, Office for Research Development and Education, URL https://freestatistics.org/blog/index.php?pk=18777, Retrieved Sun, 19 May 2024 15:22:48 +0000
QR Codes:

Original text written by user:
IsPrivate?No (this computation is public)
User-defined keywords
Estimated Impact141
Family? (F = Feedback message, R = changed R code, M = changed R Module, P = changed Parameters, D = changed Data)
F       [Univariate Explorative Data Analysis] [Autocorrelation: ...] [2008-10-25 16:18:51] [0831954c833179c36e9320daee0825b5] [Current]
-         [Univariate Explorative Data Analysis] [Task 2_Model 2] [2008-10-26 18:39:31] [6816386b1f3c2f6c0c9f2aa1e5bc9362]
-         [Univariate Explorative Data Analysis] [task 2 autocorrel...] [2008-10-26 18:46:07] [73d6180dc45497329efd1b6934a84aba]
Feedback Forum
2008-10-29 17:33:53 [Niels Stas] [reply
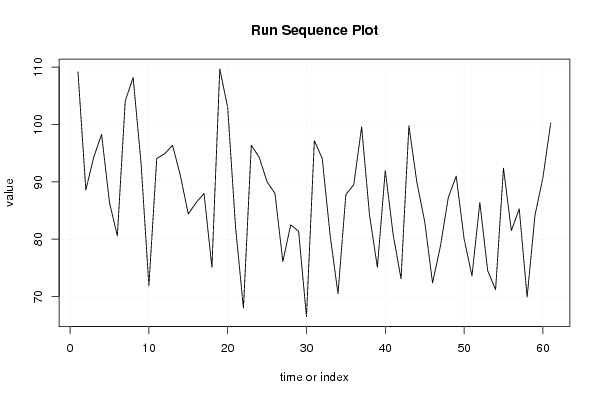
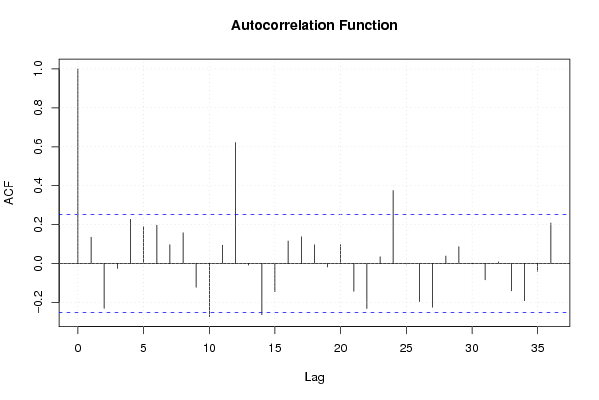
De standaardwaarden vallen inderdaad tussen de blauwe lijnen, maar als je naar de outliers kijkt, zie je dat hierin een terugkomende tendens is. Deze is terug te vinden ronde de periodes 12, 24, ... Dit wijst op seizonable autocorrelatie.

De grafiek geeft dus op beperkte wijze een seizoensgebondenheid weer, en geeft je dus de mogelijkheid te voorspellen over éénzelfde maand in de toekomst, rekening houdend met de dalende trend van de grafiek.
2008-10-29 19:37:57 [Tom Ardies] [reply
Deze grafieken waren nodig voor Taak 1. Voor Taak 2 moest je nieuwe modellen creeren door het linkse gedeelte van de functie te wijzigen.
2008-10-30 13:59:59 [Bob Leysen] [reply
Zoals vetreld in het college is er een seasonaliteit war te nemen (punten 12, 24 en 36) Dus is dus een terugkerende tendens. Je kan dus een voorspelling maken maar wel rekeing houden dat de outlier van punt 36 lager ligt dan die van 12. Er is een dalende trend.
2008-11-03 16:45:02 [Jeroen Michel] [reply
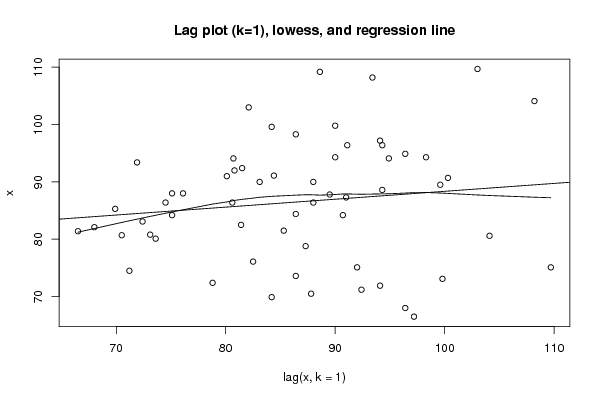
Je hebt inderdaad gebruikt van lag 1 en 36. Voor een concretere berekening had je beter ook gebruik gemaakt van lag 1.

Onderstaande links geeft een juiste oplossing weer. OPMERKING! In de opgave was duidelijk omschreven om 2x een nieuw model uit te voeren (2x nieuwe software).

http://www.freestatistics.org/blog/index.php?v=date/2008/Oct/27/t1225089268qwpw3kd7cfi59hf.htm/

http://www.freestatistics.org/blog/index.php?v=date/2008/Oct/28/t1225153537glhgvpad46hdvbo.htm/


Post a new message
Dataseries X:
109.20
88.60
94.30
98.30
86.40
80.60
104.10
108.20
93.40
71.90
94.10
94.90
96.40
91.10
84.40
86.40
88.00
75.10
109.70
103.00
82.10
68.00
96.40
94.30
90.00
88.00
76.10
82.50
81.40
66.50
97.20
94.10
80.70
70.50
87.80
89.50
99.60
84.20
75.10
92.00
80.80
73.10
99.80
90.00
83.10
72.40
78.80
87.30
91.00
80.10
73.60
86.40
74.50
71.20
92.40
81.50
85.30
69.90
84.20
90.70
100.30


Summary of computational transaction
Raw Inputview raw input (R code)
Raw Outputview raw output of R engine
Computing time4 seconds
R Server'Herman Ole Andreas Wold' @ 193.190.124.10:1001

\begin{tabular}{lllllllll}
\hline
Summary of computational transaction \tabularnewline
Raw Input & view raw input (R code)  \tabularnewline
Raw Output & view raw output of R engine  \tabularnewline
Computing time & 4 seconds \tabularnewline
R Server & 'Herman Ole Andreas Wold' @ 193.190.124.10:1001 \tabularnewline
\hline
\end{tabular}
%Source: https://freestatistics.org/blog/index.php?pk=18777&T=0

[TABLE]
[ROW][C]Summary of computational transaction[/C][/ROW]
[ROW][C]Raw Input[/C][C]view raw input (R code) [/C][/ROW]
[ROW][C]Raw Output[/C][C]view raw output of R engine [/C][/ROW]
[ROW][C]Computing time[/C][C]4 seconds[/C][/ROW]
[ROW][C]R Server[/C][C]'Herman Ole Andreas Wold' @ 193.190.124.10:1001[/C][/ROW]
[/TABLE]
Source: https://freestatistics.org/blog/index.php?pk=18777&T=0

Globally Unique Identifier (entire table): ba.freestatistics.org/blog/index.php?pk=18777&T=0

As an alternative you can also use a QR Code:  

The GUIDs for individual cells are displayed in the table below:

Summary of computational transaction
Raw Inputview raw input (R code)
Raw Outputview raw output of R engine
Computing time4 seconds
R Server'Herman Ole Andreas Wold' @ 193.190.124.10:1001


Descriptive Statistics
# observations61
minimum66.5
Q180.6
median87.3
mean86.8934426229508
Q394.1
maximum109.7

\begin{tabular}{lllllllll}
\hline
Descriptive Statistics \tabularnewline
# observations & 61 \tabularnewline
minimum & 66.5 \tabularnewline
Q1 & 80.6 \tabularnewline
median & 87.3 \tabularnewline
mean & 86.8934426229508 \tabularnewline
Q3 & 94.1 \tabularnewline
maximum & 109.7 \tabularnewline
\hline
\end{tabular}
%Source: https://freestatistics.org/blog/index.php?pk=18777&T=1

[TABLE]
[ROW][C]Descriptive Statistics[/C][/ROW]
[ROW][C]# observations[/C][C]61[/C][/ROW]
[ROW][C]minimum[/C][C]66.5[/C][/ROW]
[ROW][C]Q1[/C][C]80.6[/C][/ROW]
[ROW][C]median[/C][C]87.3[/C][/ROW]
[ROW][C]mean[/C][C]86.8934426229508[/C][/ROW]
[ROW][C]Q3[/C][C]94.1[/C][/ROW]
[ROW][C]maximum[/C][C]109.7[/C][/ROW]
[/TABLE]
Source: https://freestatistics.org/blog/index.php?pk=18777&T=1

Globally Unique Identifier (entire table): ba.freestatistics.org/blog/index.php?pk=18777&T=1

As an alternative you can also use a QR Code:  

The GUIDs for individual cells are displayed in the table below:

Descriptive Statistics
# observations61
minimum66.5
Q180.6
median87.3
mean86.8934426229508
Q394.1
maximum109.7


Parameters (Session):
par1 = 0 ; par2 = 36 ;
Parameters (R input):
par1 = 0 ; par2 = 36 ;
R code (references can be found in the software module):
par1 <- as.numeric(par1)
par2 <- as.numeric(par2)
x <- as.ts(x)
library(lattice)
bitmap(file='pic1.png')
plot(x,type='l',main='Run Sequence Plot',xlab='time or index',ylab='value')
grid()
dev.off()
bitmap(file='pic2.png')
hist(x)
grid()
dev.off()
bitmap(file='pic3.png')
if (par1 > 0)
{
densityplot(~x,col='black',main=paste('Density Plot bw = ',par1),bw=par1)
} else {
densityplot(~x,col='black',main='Density Plot')
}
dev.off()
bitmap(file='pic4.png')
qqnorm(x)
qqline(x)
grid()
dev.off()
if (par2 > 0)
{
bitmap(file='lagplot1.png')
dum <- cbind(lag(x,k=1),x)
dum
dum1 <- dum[2:length(x),]
dum1
z <- as.data.frame(dum1)
z
plot(z,main='Lag plot (k=1), lowess, and regression line')
lines(lowess(z))
abline(lm(z))
dev.off()
if (par2 > 1) {
bitmap(file='lagplotpar2.png')
dum <- cbind(lag(x,k=par2),x)
dum
dum1 <- dum[(par2+1):length(x),]
dum1
z <- as.data.frame(dum1)
z
mylagtitle <- 'Lag plot (k='
mylagtitle <- paste(mylagtitle,par2,sep='')
mylagtitle <- paste(mylagtitle,'), and lowess',sep='')
plot(z,main=mylagtitle)
lines(lowess(z))
dev.off()
}
bitmap(file='pic5.png')
acf(x,lag.max=par2,main='Autocorrelation Function')
grid()
dev.off()
}
summary(x)
load(file='createtable')
a<-table.start()
a<-table.row.start(a)
a<-table.element(a,'Descriptive Statistics',2,TRUE)
a<-table.row.end(a)
a<-table.row.start(a)
a<-table.element(a,'# observations',header=TRUE)
a<-table.element(a,length(x))
a<-table.row.end(a)
a<-table.row.start(a)
a<-table.element(a,'minimum',header=TRUE)
a<-table.element(a,min(x))
a<-table.row.end(a)
a<-table.row.start(a)
a<-table.element(a,'Q1',header=TRUE)
a<-table.element(a,quantile(x,0.25))
a<-table.row.end(a)
a<-table.row.start(a)
a<-table.element(a,'median',header=TRUE)
a<-table.element(a,median(x))
a<-table.row.end(a)
a<-table.row.start(a)
a<-table.element(a,'mean',header=TRUE)
a<-table.element(a,mean(x))
a<-table.row.end(a)
a<-table.row.start(a)
a<-table.element(a,'Q3',header=TRUE)
a<-table.element(a,quantile(x,0.75))
a<-table.row.end(a)
a<-table.row.start(a)
a<-table.element(a,'maximum',header=TRUE)
a<-table.element(a,max(x))
a<-table.row.end(a)
a<-table.end(a)
table.save(a,file='mytable.tab')