Free Statistics

of Irreproducible Research!

Author's title

Author*The author of this computation has been verified*
R Software Modulerwasp_edauni.wasp
Title produced by softwareUnivariate Explorative Data Analysis
Date of computationSat, 25 Oct 2008 09:19:45 -0600
Cite this page as followsStatistical Computations at FreeStatistics.org, Office for Research Development and Education, URL https://freestatistics.org/blog/index.php?v=date/2008/Oct/25/t12249480456o00pxrckwhtet5.htm/, Retrieved Sun, 19 May 2024 13:38:55 +0000
Statistical Computations at FreeStatistics.org, Office for Research Development and Education, URL https://freestatistics.org/blog/index.php?pk=18771, Retrieved Sun, 19 May 2024 13:38:55 +0000
QR Codes:

Original text written by user:
IsPrivate?No (this computation is public)
User-defined keywords
Estimated Impact166
Family? (F = Feedback message, R = changed R code, M = changed R Module, P = changed Parameters, D = changed Data)
F     [Univariate Explorative Data Analysis] [Investigation Dis...] [2007-10-21 17:06:37] [b9964c45117f7aac638ab9056d451faa]
F R  D  [Univariate Explorative Data Analysis] [Opdracht 3 Q2 UED...] [2008-10-25 12:06:33] [1848c1c05ef454c234bcbe26cf08badc]
F    D      [Univariate Explorative Data Analysis] [Opdracht 3 Q7 UED...] [2008-10-25 15:19:45] [73ec5abea95a9c3c8c3a1ac44cab1f72] [Current]
Feedback Forum
2008-10-29 15:27:49 [Nathalie Koulouris] [reply
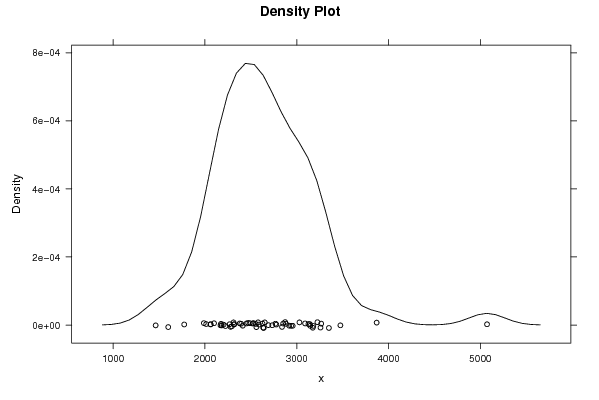
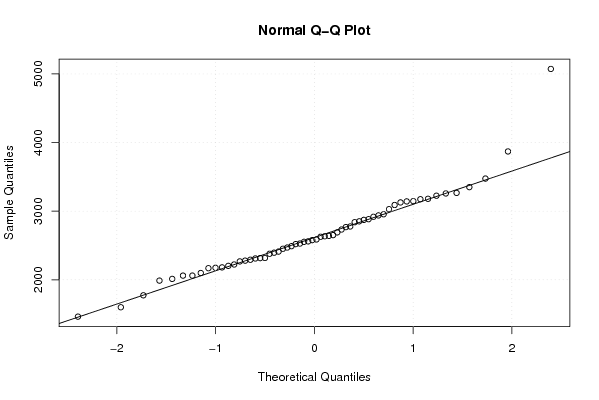
De student heeft deze vraag verkeerd beantwoord. Naar mijn mening is er bij deze grafiek wel sprake van een normaalverdeling.
2008-11-03 10:20:11 [90714a39acc78a7b2ecd294ecc6b2864] [reply
De bult op de grafiek is niet uitgesproken genoeg. Er is geen reden om aan te nemen dat er geen normaalverdeling is. De Normal Q-Q Plot toont ook een goede, niet perfecte, normaalverdeling.

Post a new message
Dataseries X:
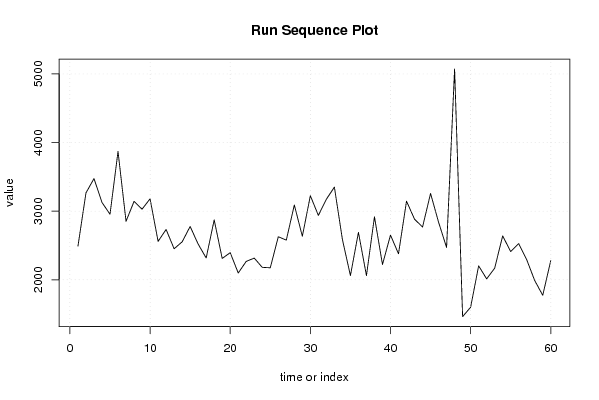
2490
3266
3475
3127
2955
3870
2852
3142
3029
3180
2560
2733
2452
2553
2777
2520
2318
2873
2311
2395
2099
2268
2316
2181
2175
2627
2578
3090
2634
3225
2938
3174
3350
2588
2061
2691
2061
2918
2223
2651
2379
3146
2883
2768
3258
2839
2470
5072
1463
1600
2203
2013
2169
2640
2411
2528
2292
1988
1774
2279


Summary of computational transaction
Raw Inputview raw input (R code)
Raw Outputview raw output of R engine
Computing time2 seconds
R Server'Gwilym Jenkins' @ 72.249.127.135

\begin{tabular}{lllllllll}
\hline
Summary of computational transaction \tabularnewline
Raw Input & view raw input (R code)  \tabularnewline
Raw Output & view raw output of R engine  \tabularnewline
Computing time & 2 seconds \tabularnewline
R Server & 'Gwilym Jenkins' @ 72.249.127.135 \tabularnewline
\hline
\end{tabular}
%Source: https://freestatistics.org/blog/index.php?pk=18771&T=0

[TABLE]
[ROW][C]Summary of computational transaction[/C][/ROW]
[ROW][C]Raw Input[/C][C]view raw input (R code) [/C][/ROW]
[ROW][C]Raw Output[/C][C]view raw output of R engine [/C][/ROW]
[ROW][C]Computing time[/C][C]2 seconds[/C][/ROW]
[ROW][C]R Server[/C][C]'Gwilym Jenkins' @ 72.249.127.135[/C][/ROW]
[/TABLE]
Source: https://freestatistics.org/blog/index.php?pk=18771&T=0

Globally Unique Identifier (entire table): ba.freestatistics.org/blog/index.php?pk=18771&T=0

As an alternative you can also use a QR Code:  

The GUIDs for individual cells are displayed in the table below:

Summary of computational transaction
Raw Inputview raw input (R code)
Raw Outputview raw output of R engine
Computing time2 seconds
R Server'Gwilym Jenkins' @ 72.249.127.135


Descriptive Statistics
# observations60
minimum1463
Q12288.75
median2583
mean2648.35
Q32942.25
maximum5072

\begin{tabular}{lllllllll}
\hline
Descriptive Statistics \tabularnewline
# observations & 60 \tabularnewline
minimum & 1463 \tabularnewline
Q1 & 2288.75 \tabularnewline
median & 2583 \tabularnewline
mean & 2648.35 \tabularnewline
Q3 & 2942.25 \tabularnewline
maximum & 5072 \tabularnewline
\hline
\end{tabular}
%Source: https://freestatistics.org/blog/index.php?pk=18771&T=1

[TABLE]
[ROW][C]Descriptive Statistics[/C][/ROW]
[ROW][C]# observations[/C][C]60[/C][/ROW]
[ROW][C]minimum[/C][C]1463[/C][/ROW]
[ROW][C]Q1[/C][C]2288.75[/C][/ROW]
[ROW][C]median[/C][C]2583[/C][/ROW]
[ROW][C]mean[/C][C]2648.35[/C][/ROW]
[ROW][C]Q3[/C][C]2942.25[/C][/ROW]
[ROW][C]maximum[/C][C]5072[/C][/ROW]
[/TABLE]
Source: https://freestatistics.org/blog/index.php?pk=18771&T=1

Globally Unique Identifier (entire table): ba.freestatistics.org/blog/index.php?pk=18771&T=1

As an alternative you can also use a QR Code:  

The GUIDs for individual cells are displayed in the table below:

Descriptive Statistics
# observations60
minimum1463
Q12288.75
median2583
mean2648.35
Q32942.25
maximum5072


Parameters (Session):
par1 = 0 ; par2 = 0 ;
Parameters (R input):
par1 = 0 ; par2 = 0 ;
R code (references can be found in the software module):
par1 <- as.numeric(par1)
par2 <- as.numeric(par2)
x <- as.ts(x)
library(lattice)
bitmap(file='pic1.png')
plot(x,type='l',main='Run Sequence Plot',xlab='time or index',ylab='value')
grid()
dev.off()
bitmap(file='pic2.png')
hist(x)
grid()
dev.off()
bitmap(file='pic3.png')
if (par1 > 0)
{
densityplot(~x,col='black',main=paste('Density Plot bw = ',par1),bw=par1)
} else {
densityplot(~x,col='black',main='Density Plot')
}
dev.off()
bitmap(file='pic4.png')
qqnorm(x)
qqline(x)
grid()
dev.off()
if (par2 > 0)
{
bitmap(file='lagplot1.png')
dum <- cbind(lag(x,k=1),x)
dum
dum1 <- dum[2:length(x),]
dum1
z <- as.data.frame(dum1)
z
plot(z,main='Lag plot (k=1), lowess, and regression line')
lines(lowess(z))
abline(lm(z))
dev.off()
if (par2 > 1) {
bitmap(file='lagplotpar2.png')
dum <- cbind(lag(x,k=par2),x)
dum
dum1 <- dum[(par2+1):length(x),]
dum1
z <- as.data.frame(dum1)
z
mylagtitle <- 'Lag plot (k='
mylagtitle <- paste(mylagtitle,par2,sep='')
mylagtitle <- paste(mylagtitle,'), and lowess',sep='')
plot(z,main=mylagtitle)
lines(lowess(z))
dev.off()
}
bitmap(file='pic5.png')
acf(x,lag.max=par2,main='Autocorrelation Function')
grid()
dev.off()
}
summary(x)
load(file='createtable')
a<-table.start()
a<-table.row.start(a)
a<-table.element(a,'Descriptive Statistics',2,TRUE)
a<-table.row.end(a)
a<-table.row.start(a)
a<-table.element(a,'# observations',header=TRUE)
a<-table.element(a,length(x))
a<-table.row.end(a)
a<-table.row.start(a)
a<-table.element(a,'minimum',header=TRUE)
a<-table.element(a,min(x))
a<-table.row.end(a)
a<-table.row.start(a)
a<-table.element(a,'Q1',header=TRUE)
a<-table.element(a,quantile(x,0.25))
a<-table.row.end(a)
a<-table.row.start(a)
a<-table.element(a,'median',header=TRUE)
a<-table.element(a,median(x))
a<-table.row.end(a)
a<-table.row.start(a)
a<-table.element(a,'mean',header=TRUE)
a<-table.element(a,mean(x))
a<-table.row.end(a)
a<-table.row.start(a)
a<-table.element(a,'Q3',header=TRUE)
a<-table.element(a,quantile(x,0.75))
a<-table.row.end(a)
a<-table.row.start(a)
a<-table.element(a,'maximum',header=TRUE)
a<-table.element(a,max(x))
a<-table.row.end(a)
a<-table.end(a)
table.save(a,file='mytable.tab')