Free Statistics

of Irreproducible Research!

Author's title

Author*The author of this computation has been verified*
R Software Modulerwasp_centraltendency.wasp
Title produced by softwareCentral Tendency
Date of computationSat, 25 Oct 2008 06:40:45 -0600
Cite this page as followsStatistical Computations at FreeStatistics.org, Office for Research Development and Education, URL https://freestatistics.org/blog/index.php?v=date/2008/Oct/25/t1224938481fsn084c941wlam2.htm/, Retrieved Sun, 19 May 2024 15:39:42 +0000
Statistical Computations at FreeStatistics.org, Office for Research Development and Education, URL https://freestatistics.org/blog/index.php?pk=18697, Retrieved Sun, 19 May 2024 15:39:42 +0000
QR Codes:

Original text written by user:
IsPrivate?No (this computation is public)
User-defined keywords
Estimated Impact208
Family? (F = Feedback message, R = changed R code, M = changed R Module, P = changed Parameters, D = changed Data)
-     [Central Tendency] [Investigating Ass...] [2007-10-22 10:34:53] [b9964c45117f7aac638ab9056d451faa]
-    D    [Central Tendency] [Voorspelling werk...] [2008-10-25 12:40:45] [54ae75b68e6a45c6d55fa4235827d5b3] [Current]
Feedback Forum

Post a new message
Dataseries X:
467
460
448
443
436
431
484
510
513
503
471
471
476
475
470
461
455
456
517
525
523
519
509
512
519
517
510
509
501
507
569
580
578
565
547
555
562
561
555
544
537
543
594
611
613
611
594
595
591
589
584
573
567
569
621
629
628
612
595
597
593
590
580
574
573
573
620
626
620
588
566
557


Summary of computational transaction
Raw Inputview raw input (R code)
Raw Outputview raw output of R engine
Computing time1 seconds
R Server'George Udny Yule' @ 72.249.76.132

\begin{tabular}{lllllllll}
\hline
Summary of computational transaction \tabularnewline
Raw Input & view raw input (R code)  \tabularnewline
Raw Output & view raw output of R engine  \tabularnewline
Computing time & 1 seconds \tabularnewline
R Server & 'George Udny Yule' @ 72.249.76.132 \tabularnewline
\hline
\end{tabular}
%Source: https://freestatistics.org/blog/index.php?pk=18697&T=0

[TABLE]
[ROW][C]Summary of computational transaction[/C][/ROW]
[ROW][C]Raw Input[/C][C]view raw input (R code) [/C][/ROW]
[ROW][C]Raw Output[/C][C]view raw output of R engine [/C][/ROW]
[ROW][C]Computing time[/C][C]1 seconds[/C][/ROW]
[ROW][C]R Server[/C][C]'George Udny Yule' @ 72.249.76.132[/C][/ROW]
[/TABLE]
Source: https://freestatistics.org/blog/index.php?pk=18697&T=0

Globally Unique Identifier (entire table): ba.freestatistics.org/blog/index.php?pk=18697&T=0

As an alternative you can also use a QR Code:  

The GUIDs for individual cells are displayed in the table below:

Summary of computational transaction
Raw Inputview raw input (R code)
Raw Outputview raw output of R engine
Computing time1 seconds
R Server'George Udny Yule' @ 72.249.76.132


Central Tendency - Ungrouped Data
MeasureValueS.E.Value/S.E.
Arithmetic Mean543.4305555555566.5114809641279583.4572900618676
Geometric Mean540.57630066951
Harmonic Mean537.644181012737
Quadratic Mean546.193303693848
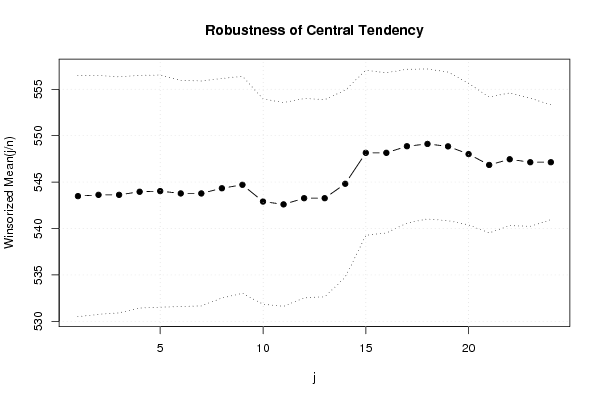
Winsorized Mean ( 1 / 24 )543.4861111111116.4923812655664983.7113670439516
Winsorized Mean ( 2 / 24 )543.6256.4382050413861184.4373542789436
Winsorized Mean ( 3 / 24 )543.6256.3565622167931785.5218562265964
Winsorized Mean ( 4 / 24 )543.9583333333336.2669625061275286.7977641164245
Winsorized Mean ( 5 / 24 )544.0277777777786.2531360589766887.0007901070375
Winsorized Mean ( 6 / 24 )543.7777777777786.0911574940611989.2733077921487
Winsorized Mean ( 7 / 24 )543.7777777777786.056890636877889.7783715074777
Winsorized Mean ( 8 / 24 )544.3333333333335.913665508769492.0466895745354
Winsorized Mean ( 9 / 24 )544.7083333333335.8453744771210293.1862168053286
Winsorized Mean ( 10 / 24 )542.9027777777785.5303317740788398.1682112314515
Winsorized Mean ( 11 / 24 )542.5972222222225.4887372134264798.8564766582246
Winsorized Mean ( 12 / 24 )543.2638888888895.36777293935433101.208433185744
Winsorized Mean ( 13 / 24 )543.2638888888895.31109628626279102.288465433031
Winsorized Mean ( 14 / 24 )544.8194444444445.03999366526265108.099231989025
Winsorized Mean ( 15 / 24 )548.1527777777784.4429376235779123.376203813627
Winsorized Mean ( 16 / 24 )548.1527777777784.31427098866352127.055713286936
Winsorized Mean ( 17 / 24 )548.8611111111114.14441502295019132.433916022340
Winsorized Mean ( 18 / 24 )549.1111111111114.0390094868908135.951924077755
Winsorized Mean ( 19 / 24 )548.8472222222224.00247672355782137.126899200141
Winsorized Mean ( 20 / 24 )548.0138888888893.8130455717061143.720781350034
Winsorized Mean ( 21 / 24 )546.8472222222223.66104240664006149.369267406027
Winsorized Mean ( 22 / 24 )547.4583333333333.57503611393821153.133651209543
Winsorized Mean ( 23 / 24 )547.1388888888893.449235334934158.626140509302
Winsorized Mean ( 24 / 24 )547.1388888888893.09937809625587176.531830546859
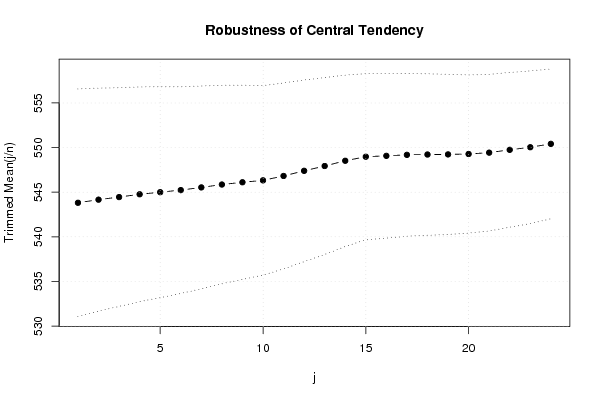
Trimmed Mean ( 1 / 24 )543.8142857142866.3827631774455885.2004485511749
Trimmed Mean ( 2 / 24 )544.1617647058826.2514830652746787.0452273522992
Trimmed Mean ( 3 / 24 )544.4545454545456.1283164017451288.8424340002263
Trimmed Mean ( 4 / 24 )544.7656256.0164185984467690.546496405792
Trimmed Mean ( 5 / 24 )5455.9128609748121492.1719624935568
Trimmed Mean ( 6 / 24 )545.2333333333335.7900346235251194.1675428188342
Trimmed Mean ( 7 / 24 )545.5344827586215.6841239681843295.9751204956356
Trimmed Mean ( 8 / 24 )545.8571428571435.5609041455964898.1597827557218
Trimmed Mean ( 9 / 24 )546.1111111111115.44264720261144100.339244999948
Trimmed Mean ( 10 / 24 )546.3269230769235.30990715477611102.888225189685
Trimmed Mean ( 11 / 24 )546.825.21063982126368104.942966460381
Trimmed Mean ( 12 / 24 )547.3958333333335.08933835373928107.557367045786
Trimmed Mean ( 13 / 24 )547.9347826086964.9593908553324110.484291033353
Trimmed Mean ( 14 / 24 )548.5227272727274.8005118468688114.263383732822
Trimmed Mean ( 15 / 24 )548.976190476194.65792545718976117.858517814796
Trimmed Mean ( 16 / 24 )549.0754.60773979578285119.163629965071
Trimmed Mean ( 17 / 24 )549.1842105263164.56030483358175120.427083400689
Trimmed Mean ( 18 / 24 )549.2222222222224.52455577247884121.386993517227
Trimmed Mean ( 19 / 24 )549.2352941176474.48746696441733122.393167119162
Trimmed Mean ( 20 / 24 )549.281254.43051969731616123.976708721718
Trimmed Mean ( 21 / 24 )549.4333333333334.38431984877911125.317803509781
Trimmed Mean ( 22 / 24 )549.754.33871003431951126.708168015709
Trimmed Mean ( 23 / 24 )550.0384615384624.27676397047716128.610899580950
Trimmed Mean ( 24 / 24 )550.4166666666674.19882517500331131.088255339479
Median556
Midrange530
Midmean - Weighted Average at Xnp548.081081081081
Midmean - Weighted Average at X(n+1)p549.222222222222
Midmean - Empirical Distribution Function548.081081081081
Midmean - Empirical Distribution Function - Averaging549.222222222222
Midmean - Empirical Distribution Function - Interpolation549.222222222222
Midmean - Closest Observation548.081081081081
Midmean - True Basic - Statistics Graphics Toolkit549.222222222222
Midmean - MS Excel (old versions)549.184210526316
Number of observations72

\begin{tabular}{lllllllll}
\hline
Central Tendency - Ungrouped Data \tabularnewline
Measure & Value & S.E. & Value/S.E. \tabularnewline
Arithmetic Mean & 543.430555555556 & 6.51148096412795 & 83.4572900618676 \tabularnewline
Geometric Mean & 540.57630066951 &  &  \tabularnewline
Harmonic Mean & 537.644181012737 &  &  \tabularnewline
Quadratic Mean & 546.193303693848 &  &  \tabularnewline
Winsorized Mean ( 1 / 24 ) & 543.486111111111 & 6.49238126556649 & 83.7113670439516 \tabularnewline
Winsorized Mean ( 2 / 24 ) & 543.625 & 6.43820504138611 & 84.4373542789436 \tabularnewline
Winsorized Mean ( 3 / 24 ) & 543.625 & 6.35656221679317 & 85.5218562265964 \tabularnewline
Winsorized Mean ( 4 / 24 ) & 543.958333333333 & 6.26696250612752 & 86.7977641164245 \tabularnewline
Winsorized Mean ( 5 / 24 ) & 544.027777777778 & 6.25313605897668 & 87.0007901070375 \tabularnewline
Winsorized Mean ( 6 / 24 ) & 543.777777777778 & 6.09115749406119 & 89.2733077921487 \tabularnewline
Winsorized Mean ( 7 / 24 ) & 543.777777777778 & 6.0568906368778 & 89.7783715074777 \tabularnewline
Winsorized Mean ( 8 / 24 ) & 544.333333333333 & 5.9136655087694 & 92.0466895745354 \tabularnewline
Winsorized Mean ( 9 / 24 ) & 544.708333333333 & 5.84537447712102 & 93.1862168053286 \tabularnewline
Winsorized Mean ( 10 / 24 ) & 542.902777777778 & 5.53033177407883 & 98.1682112314515 \tabularnewline
Winsorized Mean ( 11 / 24 ) & 542.597222222222 & 5.48873721342647 & 98.8564766582246 \tabularnewline
Winsorized Mean ( 12 / 24 ) & 543.263888888889 & 5.36777293935433 & 101.208433185744 \tabularnewline
Winsorized Mean ( 13 / 24 ) & 543.263888888889 & 5.31109628626279 & 102.288465433031 \tabularnewline
Winsorized Mean ( 14 / 24 ) & 544.819444444444 & 5.03999366526265 & 108.099231989025 \tabularnewline
Winsorized Mean ( 15 / 24 ) & 548.152777777778 & 4.4429376235779 & 123.376203813627 \tabularnewline
Winsorized Mean ( 16 / 24 ) & 548.152777777778 & 4.31427098866352 & 127.055713286936 \tabularnewline
Winsorized Mean ( 17 / 24 ) & 548.861111111111 & 4.14441502295019 & 132.433916022340 \tabularnewline
Winsorized Mean ( 18 / 24 ) & 549.111111111111 & 4.0390094868908 & 135.951924077755 \tabularnewline
Winsorized Mean ( 19 / 24 ) & 548.847222222222 & 4.00247672355782 & 137.126899200141 \tabularnewline
Winsorized Mean ( 20 / 24 ) & 548.013888888889 & 3.8130455717061 & 143.720781350034 \tabularnewline
Winsorized Mean ( 21 / 24 ) & 546.847222222222 & 3.66104240664006 & 149.369267406027 \tabularnewline
Winsorized Mean ( 22 / 24 ) & 547.458333333333 & 3.57503611393821 & 153.133651209543 \tabularnewline
Winsorized Mean ( 23 / 24 ) & 547.138888888889 & 3.449235334934 & 158.626140509302 \tabularnewline
Winsorized Mean ( 24 / 24 ) & 547.138888888889 & 3.09937809625587 & 176.531830546859 \tabularnewline
Trimmed Mean ( 1 / 24 ) & 543.814285714286 & 6.38276317744558 & 85.2004485511749 \tabularnewline
Trimmed Mean ( 2 / 24 ) & 544.161764705882 & 6.25148306527467 & 87.0452273522992 \tabularnewline
Trimmed Mean ( 3 / 24 ) & 544.454545454545 & 6.12831640174512 & 88.8424340002263 \tabularnewline
Trimmed Mean ( 4 / 24 ) & 544.765625 & 6.01641859844676 & 90.546496405792 \tabularnewline
Trimmed Mean ( 5 / 24 ) & 545 & 5.91286097481214 & 92.1719624935568 \tabularnewline
Trimmed Mean ( 6 / 24 ) & 545.233333333333 & 5.79003462352511 & 94.1675428188342 \tabularnewline
Trimmed Mean ( 7 / 24 ) & 545.534482758621 & 5.68412396818432 & 95.9751204956356 \tabularnewline
Trimmed Mean ( 8 / 24 ) & 545.857142857143 & 5.56090414559648 & 98.1597827557218 \tabularnewline
Trimmed Mean ( 9 / 24 ) & 546.111111111111 & 5.44264720261144 & 100.339244999948 \tabularnewline
Trimmed Mean ( 10 / 24 ) & 546.326923076923 & 5.30990715477611 & 102.888225189685 \tabularnewline
Trimmed Mean ( 11 / 24 ) & 546.82 & 5.21063982126368 & 104.942966460381 \tabularnewline
Trimmed Mean ( 12 / 24 ) & 547.395833333333 & 5.08933835373928 & 107.557367045786 \tabularnewline
Trimmed Mean ( 13 / 24 ) & 547.934782608696 & 4.9593908553324 & 110.484291033353 \tabularnewline
Trimmed Mean ( 14 / 24 ) & 548.522727272727 & 4.8005118468688 & 114.263383732822 \tabularnewline
Trimmed Mean ( 15 / 24 ) & 548.97619047619 & 4.65792545718976 & 117.858517814796 \tabularnewline
Trimmed Mean ( 16 / 24 ) & 549.075 & 4.60773979578285 & 119.163629965071 \tabularnewline
Trimmed Mean ( 17 / 24 ) & 549.184210526316 & 4.56030483358175 & 120.427083400689 \tabularnewline
Trimmed Mean ( 18 / 24 ) & 549.222222222222 & 4.52455577247884 & 121.386993517227 \tabularnewline
Trimmed Mean ( 19 / 24 ) & 549.235294117647 & 4.48746696441733 & 122.393167119162 \tabularnewline
Trimmed Mean ( 20 / 24 ) & 549.28125 & 4.43051969731616 & 123.976708721718 \tabularnewline
Trimmed Mean ( 21 / 24 ) & 549.433333333333 & 4.38431984877911 & 125.317803509781 \tabularnewline
Trimmed Mean ( 22 / 24 ) & 549.75 & 4.33871003431951 & 126.708168015709 \tabularnewline
Trimmed Mean ( 23 / 24 ) & 550.038461538462 & 4.27676397047716 & 128.610899580950 \tabularnewline
Trimmed Mean ( 24 / 24 ) & 550.416666666667 & 4.19882517500331 & 131.088255339479 \tabularnewline
Median & 556 &  &  \tabularnewline
Midrange & 530 &  &  \tabularnewline
Midmean - Weighted Average at Xnp & 548.081081081081 &  &  \tabularnewline
Midmean - Weighted Average at X(n+1)p & 549.222222222222 &  &  \tabularnewline
Midmean - Empirical Distribution Function & 548.081081081081 &  &  \tabularnewline
Midmean - Empirical Distribution Function - Averaging & 549.222222222222 &  &  \tabularnewline
Midmean - Empirical Distribution Function - Interpolation & 549.222222222222 &  &  \tabularnewline
Midmean - Closest Observation & 548.081081081081 &  &  \tabularnewline
Midmean - True Basic - Statistics Graphics Toolkit & 549.222222222222 &  &  \tabularnewline
Midmean - MS Excel (old versions) & 549.184210526316 &  &  \tabularnewline
Number of observations & 72 &  &  \tabularnewline
\hline
\end{tabular}
%Source: https://freestatistics.org/blog/index.php?pk=18697&T=1

[TABLE]
[ROW][C]Central Tendency - Ungrouped Data[/C][/ROW]
[ROW][C]Measure[/C][C]Value[/C][C]S.E.[/C][C]Value/S.E.[/C][/ROW]
[ROW][C]Arithmetic Mean[/C][C]543.430555555556[/C][C]6.51148096412795[/C][C]83.4572900618676[/C][/ROW]
[ROW][C]Geometric Mean[/C][C]540.57630066951[/C][C][/C][C][/C][/ROW]
[ROW][C]Harmonic Mean[/C][C]537.644181012737[/C][C][/C][C][/C][/ROW]
[ROW][C]Quadratic Mean[/C][C]546.193303693848[/C][C][/C][C][/C][/ROW]
[ROW][C]Winsorized Mean ( 1 / 24 )[/C][C]543.486111111111[/C][C]6.49238126556649[/C][C]83.7113670439516[/C][/ROW]
[ROW][C]Winsorized Mean ( 2 / 24 )[/C][C]543.625[/C][C]6.43820504138611[/C][C]84.4373542789436[/C][/ROW]
[ROW][C]Winsorized Mean ( 3 / 24 )[/C][C]543.625[/C][C]6.35656221679317[/C][C]85.5218562265964[/C][/ROW]
[ROW][C]Winsorized Mean ( 4 / 24 )[/C][C]543.958333333333[/C][C]6.26696250612752[/C][C]86.7977641164245[/C][/ROW]
[ROW][C]Winsorized Mean ( 5 / 24 )[/C][C]544.027777777778[/C][C]6.25313605897668[/C][C]87.0007901070375[/C][/ROW]
[ROW][C]Winsorized Mean ( 6 / 24 )[/C][C]543.777777777778[/C][C]6.09115749406119[/C][C]89.2733077921487[/C][/ROW]
[ROW][C]Winsorized Mean ( 7 / 24 )[/C][C]543.777777777778[/C][C]6.0568906368778[/C][C]89.7783715074777[/C][/ROW]
[ROW][C]Winsorized Mean ( 8 / 24 )[/C][C]544.333333333333[/C][C]5.9136655087694[/C][C]92.0466895745354[/C][/ROW]
[ROW][C]Winsorized Mean ( 9 / 24 )[/C][C]544.708333333333[/C][C]5.84537447712102[/C][C]93.1862168053286[/C][/ROW]
[ROW][C]Winsorized Mean ( 10 / 24 )[/C][C]542.902777777778[/C][C]5.53033177407883[/C][C]98.1682112314515[/C][/ROW]
[ROW][C]Winsorized Mean ( 11 / 24 )[/C][C]542.597222222222[/C][C]5.48873721342647[/C][C]98.8564766582246[/C][/ROW]
[ROW][C]Winsorized Mean ( 12 / 24 )[/C][C]543.263888888889[/C][C]5.36777293935433[/C][C]101.208433185744[/C][/ROW]
[ROW][C]Winsorized Mean ( 13 / 24 )[/C][C]543.263888888889[/C][C]5.31109628626279[/C][C]102.288465433031[/C][/ROW]
[ROW][C]Winsorized Mean ( 14 / 24 )[/C][C]544.819444444444[/C][C]5.03999366526265[/C][C]108.099231989025[/C][/ROW]
[ROW][C]Winsorized Mean ( 15 / 24 )[/C][C]548.152777777778[/C][C]4.4429376235779[/C][C]123.376203813627[/C][/ROW]
[ROW][C]Winsorized Mean ( 16 / 24 )[/C][C]548.152777777778[/C][C]4.31427098866352[/C][C]127.055713286936[/C][/ROW]
[ROW][C]Winsorized Mean ( 17 / 24 )[/C][C]548.861111111111[/C][C]4.14441502295019[/C][C]132.433916022340[/C][/ROW]
[ROW][C]Winsorized Mean ( 18 / 24 )[/C][C]549.111111111111[/C][C]4.0390094868908[/C][C]135.951924077755[/C][/ROW]
[ROW][C]Winsorized Mean ( 19 / 24 )[/C][C]548.847222222222[/C][C]4.00247672355782[/C][C]137.126899200141[/C][/ROW]
[ROW][C]Winsorized Mean ( 20 / 24 )[/C][C]548.013888888889[/C][C]3.8130455717061[/C][C]143.720781350034[/C][/ROW]
[ROW][C]Winsorized Mean ( 21 / 24 )[/C][C]546.847222222222[/C][C]3.66104240664006[/C][C]149.369267406027[/C][/ROW]
[ROW][C]Winsorized Mean ( 22 / 24 )[/C][C]547.458333333333[/C][C]3.57503611393821[/C][C]153.133651209543[/C][/ROW]
[ROW][C]Winsorized Mean ( 23 / 24 )[/C][C]547.138888888889[/C][C]3.449235334934[/C][C]158.626140509302[/C][/ROW]
[ROW][C]Winsorized Mean ( 24 / 24 )[/C][C]547.138888888889[/C][C]3.09937809625587[/C][C]176.531830546859[/C][/ROW]
[ROW][C]Trimmed Mean ( 1 / 24 )[/C][C]543.814285714286[/C][C]6.38276317744558[/C][C]85.2004485511749[/C][/ROW]
[ROW][C]Trimmed Mean ( 2 / 24 )[/C][C]544.161764705882[/C][C]6.25148306527467[/C][C]87.0452273522992[/C][/ROW]
[ROW][C]Trimmed Mean ( 3 / 24 )[/C][C]544.454545454545[/C][C]6.12831640174512[/C][C]88.8424340002263[/C][/ROW]
[ROW][C]Trimmed Mean ( 4 / 24 )[/C][C]544.765625[/C][C]6.01641859844676[/C][C]90.546496405792[/C][/ROW]
[ROW][C]Trimmed Mean ( 5 / 24 )[/C][C]545[/C][C]5.91286097481214[/C][C]92.1719624935568[/C][/ROW]
[ROW][C]Trimmed Mean ( 6 / 24 )[/C][C]545.233333333333[/C][C]5.79003462352511[/C][C]94.1675428188342[/C][/ROW]
[ROW][C]Trimmed Mean ( 7 / 24 )[/C][C]545.534482758621[/C][C]5.68412396818432[/C][C]95.9751204956356[/C][/ROW]
[ROW][C]Trimmed Mean ( 8 / 24 )[/C][C]545.857142857143[/C][C]5.56090414559648[/C][C]98.1597827557218[/C][/ROW]
[ROW][C]Trimmed Mean ( 9 / 24 )[/C][C]546.111111111111[/C][C]5.44264720261144[/C][C]100.339244999948[/C][/ROW]
[ROW][C]Trimmed Mean ( 10 / 24 )[/C][C]546.326923076923[/C][C]5.30990715477611[/C][C]102.888225189685[/C][/ROW]
[ROW][C]Trimmed Mean ( 11 / 24 )[/C][C]546.82[/C][C]5.21063982126368[/C][C]104.942966460381[/C][/ROW]
[ROW][C]Trimmed Mean ( 12 / 24 )[/C][C]547.395833333333[/C][C]5.08933835373928[/C][C]107.557367045786[/C][/ROW]
[ROW][C]Trimmed Mean ( 13 / 24 )[/C][C]547.934782608696[/C][C]4.9593908553324[/C][C]110.484291033353[/C][/ROW]
[ROW][C]Trimmed Mean ( 14 / 24 )[/C][C]548.522727272727[/C][C]4.8005118468688[/C][C]114.263383732822[/C][/ROW]
[ROW][C]Trimmed Mean ( 15 / 24 )[/C][C]548.97619047619[/C][C]4.65792545718976[/C][C]117.858517814796[/C][/ROW]
[ROW][C]Trimmed Mean ( 16 / 24 )[/C][C]549.075[/C][C]4.60773979578285[/C][C]119.163629965071[/C][/ROW]
[ROW][C]Trimmed Mean ( 17 / 24 )[/C][C]549.184210526316[/C][C]4.56030483358175[/C][C]120.427083400689[/C][/ROW]
[ROW][C]Trimmed Mean ( 18 / 24 )[/C][C]549.222222222222[/C][C]4.52455577247884[/C][C]121.386993517227[/C][/ROW]
[ROW][C]Trimmed Mean ( 19 / 24 )[/C][C]549.235294117647[/C][C]4.48746696441733[/C][C]122.393167119162[/C][/ROW]
[ROW][C]Trimmed Mean ( 20 / 24 )[/C][C]549.28125[/C][C]4.43051969731616[/C][C]123.976708721718[/C][/ROW]
[ROW][C]Trimmed Mean ( 21 / 24 )[/C][C]549.433333333333[/C][C]4.38431984877911[/C][C]125.317803509781[/C][/ROW]
[ROW][C]Trimmed Mean ( 22 / 24 )[/C][C]549.75[/C][C]4.33871003431951[/C][C]126.708168015709[/C][/ROW]
[ROW][C]Trimmed Mean ( 23 / 24 )[/C][C]550.038461538462[/C][C]4.27676397047716[/C][C]128.610899580950[/C][/ROW]
[ROW][C]Trimmed Mean ( 24 / 24 )[/C][C]550.416666666667[/C][C]4.19882517500331[/C][C]131.088255339479[/C][/ROW]
[ROW][C]Median[/C][C]556[/C][C][/C][C][/C][/ROW]
[ROW][C]Midrange[/C][C]530[/C][C][/C][C][/C][/ROW]
[ROW][C]Midmean - Weighted Average at Xnp[/C][C]548.081081081081[/C][C][/C][C][/C][/ROW]
[ROW][C]Midmean - Weighted Average at X(n+1)p[/C][C]549.222222222222[/C][C][/C][C][/C][/ROW]
[ROW][C]Midmean - Empirical Distribution Function[/C][C]548.081081081081[/C][C][/C][C][/C][/ROW]
[ROW][C]Midmean - Empirical Distribution Function - Averaging[/C][C]549.222222222222[/C][C][/C][C][/C][/ROW]
[ROW][C]Midmean - Empirical Distribution Function - Interpolation[/C][C]549.222222222222[/C][C][/C][C][/C][/ROW]
[ROW][C]Midmean - Closest Observation[/C][C]548.081081081081[/C][C][/C][C][/C][/ROW]
[ROW][C]Midmean - True Basic - Statistics Graphics Toolkit[/C][C]549.222222222222[/C][C][/C][C][/C][/ROW]
[ROW][C]Midmean - MS Excel (old versions)[/C][C]549.184210526316[/C][C][/C][C][/C][/ROW]
[ROW][C]Number of observations[/C][C]72[/C][C][/C][C][/C][/ROW]
[/TABLE]
Source: https://freestatistics.org/blog/index.php?pk=18697&T=1

Globally Unique Identifier (entire table): ba.freestatistics.org/blog/index.php?pk=18697&T=1

As an alternative you can also use a QR Code:  

The GUIDs for individual cells are displayed in the table below:

Central Tendency - Ungrouped Data
MeasureValueS.E.Value/S.E.
Arithmetic Mean543.4305555555566.5114809641279583.4572900618676
Geometric Mean540.57630066951
Harmonic Mean537.644181012737
Quadratic Mean546.193303693848
Winsorized Mean ( 1 / 24 )543.4861111111116.4923812655664983.7113670439516
Winsorized Mean ( 2 / 24 )543.6256.4382050413861184.4373542789436
Winsorized Mean ( 3 / 24 )543.6256.3565622167931785.5218562265964
Winsorized Mean ( 4 / 24 )543.9583333333336.2669625061275286.7977641164245
Winsorized Mean ( 5 / 24 )544.0277777777786.2531360589766887.0007901070375
Winsorized Mean ( 6 / 24 )543.7777777777786.0911574940611989.2733077921487
Winsorized Mean ( 7 / 24 )543.7777777777786.056890636877889.7783715074777
Winsorized Mean ( 8 / 24 )544.3333333333335.913665508769492.0466895745354
Winsorized Mean ( 9 / 24 )544.7083333333335.8453744771210293.1862168053286
Winsorized Mean ( 10 / 24 )542.9027777777785.5303317740788398.1682112314515
Winsorized Mean ( 11 / 24 )542.5972222222225.4887372134264798.8564766582246
Winsorized Mean ( 12 / 24 )543.2638888888895.36777293935433101.208433185744
Winsorized Mean ( 13 / 24 )543.2638888888895.31109628626279102.288465433031
Winsorized Mean ( 14 / 24 )544.8194444444445.03999366526265108.099231989025
Winsorized Mean ( 15 / 24 )548.1527777777784.4429376235779123.376203813627
Winsorized Mean ( 16 / 24 )548.1527777777784.31427098866352127.055713286936
Winsorized Mean ( 17 / 24 )548.8611111111114.14441502295019132.433916022340
Winsorized Mean ( 18 / 24 )549.1111111111114.0390094868908135.951924077755
Winsorized Mean ( 19 / 24 )548.8472222222224.00247672355782137.126899200141
Winsorized Mean ( 20 / 24 )548.0138888888893.8130455717061143.720781350034
Winsorized Mean ( 21 / 24 )546.8472222222223.66104240664006149.369267406027
Winsorized Mean ( 22 / 24 )547.4583333333333.57503611393821153.133651209543
Winsorized Mean ( 23 / 24 )547.1388888888893.449235334934158.626140509302
Winsorized Mean ( 24 / 24 )547.1388888888893.09937809625587176.531830546859
Trimmed Mean ( 1 / 24 )543.8142857142866.3827631774455885.2004485511749
Trimmed Mean ( 2 / 24 )544.1617647058826.2514830652746787.0452273522992
Trimmed Mean ( 3 / 24 )544.4545454545456.1283164017451288.8424340002263
Trimmed Mean ( 4 / 24 )544.7656256.0164185984467690.546496405792
Trimmed Mean ( 5 / 24 )5455.9128609748121492.1719624935568
Trimmed Mean ( 6 / 24 )545.2333333333335.7900346235251194.1675428188342
Trimmed Mean ( 7 / 24 )545.5344827586215.6841239681843295.9751204956356
Trimmed Mean ( 8 / 24 )545.8571428571435.5609041455964898.1597827557218
Trimmed Mean ( 9 / 24 )546.1111111111115.44264720261144100.339244999948
Trimmed Mean ( 10 / 24 )546.3269230769235.30990715477611102.888225189685
Trimmed Mean ( 11 / 24 )546.825.21063982126368104.942966460381
Trimmed Mean ( 12 / 24 )547.3958333333335.08933835373928107.557367045786
Trimmed Mean ( 13 / 24 )547.9347826086964.9593908553324110.484291033353
Trimmed Mean ( 14 / 24 )548.5227272727274.8005118468688114.263383732822
Trimmed Mean ( 15 / 24 )548.976190476194.65792545718976117.858517814796
Trimmed Mean ( 16 / 24 )549.0754.60773979578285119.163629965071
Trimmed Mean ( 17 / 24 )549.1842105263164.56030483358175120.427083400689
Trimmed Mean ( 18 / 24 )549.2222222222224.52455577247884121.386993517227
Trimmed Mean ( 19 / 24 )549.2352941176474.48746696441733122.393167119162
Trimmed Mean ( 20 / 24 )549.281254.43051969731616123.976708721718
Trimmed Mean ( 21 / 24 )549.4333333333334.38431984877911125.317803509781
Trimmed Mean ( 22 / 24 )549.754.33871003431951126.708168015709
Trimmed Mean ( 23 / 24 )550.0384615384624.27676397047716128.610899580950
Trimmed Mean ( 24 / 24 )550.4166666666674.19882517500331131.088255339479
Median556
Midrange530
Midmean - Weighted Average at Xnp548.081081081081
Midmean - Weighted Average at X(n+1)p549.222222222222
Midmean - Empirical Distribution Function548.081081081081
Midmean - Empirical Distribution Function - Averaging549.222222222222
Midmean - Empirical Distribution Function - Interpolation549.222222222222
Midmean - Closest Observation548.081081081081
Midmean - True Basic - Statistics Graphics Toolkit549.222222222222
Midmean - MS Excel (old versions)549.184210526316
Number of observations72


Parameters (Session):
Parameters (R input):
R code (references can be found in the software module):
geomean <- function(x) {
return(exp(mean(log(x))))
}
harmean <- function(x) {
return(1/mean(1/x))
}
quamean <- function(x) {
return(sqrt(mean(x*x)))
}
winmean <- function(x) {
x <-sort(x[!is.na(x)])
n<-length(x)
denom <- 3
nodenom <- n/denom
if (nodenom>40) denom <- n/40
sqrtn = sqrt(n)
roundnodenom = floor(nodenom)
win <- array(NA,dim=c(roundnodenom,2))
for (j in 1:roundnodenom) {
win[j,1] <- (j*x[j+1]+sum(x[(j+1):(n-j)])+j*x[n-j])/n
win[j,2] <- sd(c(rep(x[j+1],j),x[(j+1):(n-j)],rep(x[n-j],j)))/sqrtn
}
return(win)
}
trimean <- function(x) {
x <-sort(x[!is.na(x)])
n<-length(x)
denom <- 3
nodenom <- n/denom
if (nodenom>40) denom <- n/40
sqrtn = sqrt(n)
roundnodenom = floor(nodenom)
tri <- array(NA,dim=c(roundnodenom,2))
for (j in 1:roundnodenom) {
tri[j,1] <- mean(x,trim=j/n)
tri[j,2] <- sd(x[(j+1):(n-j)]) / sqrt(n-j*2)
}
return(tri)
}
midrange <- function(x) {
return((max(x)+min(x))/2)
}
q1 <- function(data,n,p,i,f) {
np <- n*p;
i <<- floor(np)
f <<- np - i
qvalue <- (1-f)*data[i] + f*data[i+1]
}
q2 <- function(data,n,p,i,f) {
np <- (n+1)*p
i <<- floor(np)
f <<- np - i
qvalue <- (1-f)*data[i] + f*data[i+1]
}
q3 <- function(data,n,p,i,f) {
np <- n*p
i <<- floor(np)
f <<- np - i
if (f==0) {
qvalue <- data[i]
} else {
qvalue <- data[i+1]
}
}
q4 <- function(data,n,p,i,f) {
np <- n*p
i <<- floor(np)
f <<- np - i
if (f==0) {
qvalue <- (data[i]+data[i+1])/2
} else {
qvalue <- data[i+1]
}
}
q5 <- function(data,n,p,i,f) {
np <- (n-1)*p
i <<- floor(np)
f <<- np - i
if (f==0) {
qvalue <- data[i+1]
} else {
qvalue <- data[i+1] + f*(data[i+2]-data[i+1])
}
}
q6 <- function(data,n,p,i,f) {
np <- n*p+0.5
i <<- floor(np)
f <<- np - i
qvalue <- data[i]
}
q7 <- function(data,n,p,i,f) {
np <- (n+1)*p
i <<- floor(np)
f <<- np - i
if (f==0) {
qvalue <- data[i]
} else {
qvalue <- f*data[i] + (1-f)*data[i+1]
}
}
q8 <- function(data,n,p,i,f) {
np <- (n+1)*p
i <<- floor(np)
f <<- np - i
if (f==0) {
qvalue <- data[i]
} else {
if (f == 0.5) {
qvalue <- (data[i]+data[i+1])/2
} else {
if (f < 0.5) {
qvalue <- data[i]
} else {
qvalue <- data[i+1]
}
}
}
}
midmean <- function(x,def) {
x <-sort(x[!is.na(x)])
n<-length(x)
if (def==1) {
qvalue1 <- q1(x,n,0.25,i,f)
qvalue3 <- q1(x,n,0.75,i,f)
}
if (def==2) {
qvalue1 <- q2(x,n,0.25,i,f)
qvalue3 <- q2(x,n,0.75,i,f)
}
if (def==3) {
qvalue1 <- q3(x,n,0.25,i,f)
qvalue3 <- q3(x,n,0.75,i,f)
}
if (def==4) {
qvalue1 <- q4(x,n,0.25,i,f)
qvalue3 <- q4(x,n,0.75,i,f)
}
if (def==5) {
qvalue1 <- q5(x,n,0.25,i,f)
qvalue3 <- q5(x,n,0.75,i,f)
}
if (def==6) {
qvalue1 <- q6(x,n,0.25,i,f)
qvalue3 <- q6(x,n,0.75,i,f)
}
if (def==7) {
qvalue1 <- q7(x,n,0.25,i,f)
qvalue3 <- q7(x,n,0.75,i,f)
}
if (def==8) {
qvalue1 <- q8(x,n,0.25,i,f)
qvalue3 <- q8(x,n,0.75,i,f)
}
midm <- 0
myn <- 0
roundno4 <- round(n/4)
round3no4 <- round(3*n/4)
for (i in 1:n) {
if ((x[i]>=qvalue1) & (x[i]<=qvalue3)){
midm = midm + x[i]
myn = myn + 1
}
}
midm = midm / myn
return(midm)
}
(arm <- mean(x))
sqrtn <- sqrt(length(x))
(armse <- sd(x) / sqrtn)
(armose <- arm / armse)
(geo <- geomean(x))
(har <- harmean(x))
(qua <- quamean(x))
(win <- winmean(x))
(tri <- trimean(x))
(midr <- midrange(x))
midm <- array(NA,dim=8)
for (j in 1:8) midm[j] <- midmean(x,j)
midm
bitmap(file='test1.png')
lb <- win[,1] - 2*win[,2]
ub <- win[,1] + 2*win[,2]
if ((ylimmin == '') | (ylimmax == '')) plot(win[,1],type='b',main=main, xlab='j', pch=19, ylab='Winsorized Mean(j/n)', ylim=c(min(lb),max(ub))) else plot(win[,1],type='l',main=main, xlab='j', pch=19, ylab='Winsorized Mean(j/n)', ylim=c(ylimmin,ylimmax))
lines(ub,lty=3)
lines(lb,lty=3)
grid()
dev.off()
bitmap(file='test2.png')
lb <- tri[,1] - 2*tri[,2]
ub <- tri[,1] + 2*tri[,2]
if ((ylimmin == '') | (ylimmax == '')) plot(tri[,1],type='b',main=main, xlab='j', pch=19, ylab='Trimmed Mean(j/n)', ylim=c(min(lb),max(ub))) else plot(tri[,1],type='l',main=main, xlab='j', pch=19, ylab='Trimmed Mean(j/n)', ylim=c(ylimmin,ylimmax))
lines(ub,lty=3)
lines(lb,lty=3)
grid()
dev.off()
load(file='createtable')
a<-table.start()
a<-table.row.start(a)
a<-table.element(a,'Central Tendency - Ungrouped Data',4,TRUE)
a<-table.row.end(a)
a<-table.row.start(a)
a<-table.element(a,'Measure',header=TRUE)
a<-table.element(a,'Value',header=TRUE)
a<-table.element(a,'S.E.',header=TRUE)
a<-table.element(a,'Value/S.E.',header=TRUE)
a<-table.row.end(a)
a<-table.row.start(a)
a<-table.element(a,hyperlink('arithmetic_mean.htm', 'Arithmetic Mean', 'click to view the definition of the Arithmetic Mean'),header=TRUE)
a<-table.element(a,arm)
a<-table.element(a,hyperlink('arithmetic_mean_standard_error.htm', armse, 'click to view the definition of the Standard Error of the Arithmetic Mean'))
a<-table.element(a,armose)
a<-table.row.end(a)
a<-table.row.start(a)
a<-table.element(a,hyperlink('geometric_mean.htm', 'Geometric Mean', 'click to view the definition of the Geometric Mean'),header=TRUE)
a<-table.element(a,geo)
a<-table.element(a,'')
a<-table.row.end(a)
a<-table.row.start(a)
a<-table.element(a,hyperlink('harmonic_mean.htm', 'Harmonic Mean', 'click to view the definition of the Harmonic Mean'),header=TRUE)
a<-table.element(a,har)
a<-table.element(a,'')
a<-table.row.end(a)
a<-table.row.start(a)
a<-table.element(a,hyperlink('quadratic_mean.htm', 'Quadratic Mean', 'click to view the definition of the Quadratic Mean'),header=TRUE)
a<-table.element(a,qua)
a<-table.element(a,'')
a<-table.row.end(a)
for (j in 1:length(win[,1])) {
a<-table.row.start(a)
mylabel <- paste('Winsorized Mean (',j)
mylabel <- paste(mylabel,'/')
mylabel <- paste(mylabel,length(win[,1]))
mylabel <- paste(mylabel,')')
a<-table.element(a,hyperlink('winsorized_mean.htm', mylabel, 'click to view the definition of the Winsorized Mean'),header=TRUE)
a<-table.element(a,win[j,1])
a<-table.element(a,win[j,2])
a<-table.element(a,win[j,1]/win[j,2])
a<-table.row.end(a)
}
for (j in 1:length(tri[,1])) {
a<-table.row.start(a)
mylabel <- paste('Trimmed Mean (',j)
mylabel <- paste(mylabel,'/')
mylabel <- paste(mylabel,length(tri[,1]))
mylabel <- paste(mylabel,')')
a<-table.element(a,hyperlink('arithmetic_mean.htm', mylabel, 'click to view the definition of the Trimmed Mean'),header=TRUE)
a<-table.element(a,tri[j,1])
a<-table.element(a,tri[j,2])
a<-table.element(a,tri[j,1]/tri[j,2])
a<-table.row.end(a)
}
a<-table.row.start(a)
a<-table.element(a,hyperlink('median_1.htm', 'Median', 'click to view the definition of the Median'),header=TRUE)
a<-table.element(a,median(x))
a<-table.element(a,'')
a<-table.row.end(a)
a<-table.row.start(a)
a<-table.element(a,hyperlink('midrange.htm', 'Midrange', 'click to view the definition of the Midrange'),header=TRUE)
a<-table.element(a,midr)
a<-table.element(a,'')
a<-table.row.end(a)
a<-table.row.start(a)
mymid <- hyperlink('midmean.htm', 'Midmean', 'click to view the definition of the Midmean')
mylabel <- paste(mymid,hyperlink('method_1.htm','Weighted Average at Xnp',''),sep=' - ')
a<-table.element(a,mylabel,header=TRUE)
a<-table.element(a,midm[1])
a<-table.element(a,'')
a<-table.row.end(a)
a<-table.row.start(a)
mymid <- hyperlink('midmean.htm', 'Midmean', 'click to view the definition of the Midmean')
mylabel <- paste(mymid,hyperlink('method_2.htm','Weighted Average at X(n+1)p',''),sep=' - ')
a<-table.element(a,mylabel,header=TRUE)
a<-table.element(a,midm[2])
a<-table.element(a,'')
a<-table.row.end(a)
a<-table.row.start(a)
mymid <- hyperlink('midmean.htm', 'Midmean', 'click to view the definition of the Midmean')
mylabel <- paste(mymid,hyperlink('method_3.htm','Empirical Distribution Function',''),sep=' - ')
a<-table.element(a,mylabel,header=TRUE)
a<-table.element(a,midm[3])
a<-table.element(a,'')
a<-table.row.end(a)
a<-table.row.start(a)
mymid <- hyperlink('midmean.htm', 'Midmean', 'click to view the definition of the Midmean')
mylabel <- paste(mymid,hyperlink('method_4.htm','Empirical Distribution Function - Averaging',''),sep=' - ')
a<-table.element(a,mylabel,header=TRUE)
a<-table.element(a,midm[4])
a<-table.element(a,'')
a<-table.row.end(a)
a<-table.row.start(a)
mymid <- hyperlink('midmean.htm', 'Midmean', 'click to view the definition of the Midmean')
mylabel <- paste(mymid,hyperlink('method_5.htm','Empirical Distribution Function - Interpolation',''),sep=' - ')
a<-table.element(a,mylabel,header=TRUE)
a<-table.element(a,midm[5])
a<-table.element(a,'')
a<-table.row.end(a)
a<-table.row.start(a)
mymid <- hyperlink('midmean.htm', 'Midmean', 'click to view the definition of the Midmean')
mylabel <- paste(mymid,hyperlink('method_6.htm','Closest Observation',''),sep=' - ')
a<-table.element(a,mylabel,header=TRUE)
a<-table.element(a,midm[6])
a<-table.element(a,'')
a<-table.row.end(a)
a<-table.row.start(a)
mymid <- hyperlink('midmean.htm', 'Midmean', 'click to view the definition of the Midmean')
mylabel <- paste(mymid,hyperlink('method_7.htm','True Basic - Statistics Graphics Toolkit',''),sep=' - ')
a<-table.element(a,mylabel,header=TRUE)
a<-table.element(a,midm[7])
a<-table.element(a,'')
a<-table.row.end(a)
a<-table.row.start(a)
mymid <- hyperlink('midmean.htm', 'Midmean', 'click to view the definition of the Midmean')
mylabel <- paste(mymid,hyperlink('method_8.htm','MS Excel (old versions)',''),sep=' - ')
a<-table.element(a,mylabel,header=TRUE)
a<-table.element(a,midm[8])
a<-table.element(a,'')
a<-table.row.end(a)
a<-table.row.start(a)
a<-table.element(a,'Number of observations',header=TRUE)
a<-table.element(a,length(x))
a<-table.element(a,'')
a<-table.row.end(a)
a<-table.end(a)
table.save(a,file='mytable.tab')