Free Statistics
of Irreproducible Research!
Description of Statistical Computation | |||||||||||||||||||||||||||||||||||||||||||||||||
|---|---|---|---|---|---|---|---|---|---|---|---|---|---|---|---|---|---|---|---|---|---|---|---|---|---|---|---|---|---|---|---|---|---|---|---|---|---|---|---|---|---|---|---|---|---|---|---|---|---|
| Author's title | |||||||||||||||||||||||||||||||||||||||||||||||||
| Author | *The author of this computation has been verified* | ||||||||||||||||||||||||||||||||||||||||||||||||
| R Software Module | rwasp_tukeylambda.wasp | ||||||||||||||||||||||||||||||||||||||||||||||||
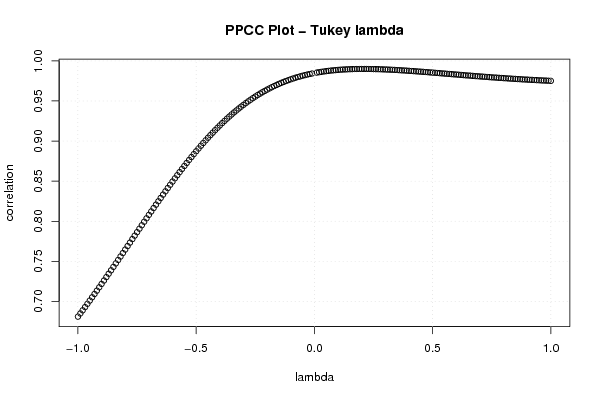
| Title produced by software | Tukey lambda PPCC Plot | ||||||||||||||||||||||||||||||||||||||||||||||||
| Date of computation | Fri, 24 Oct 2008 03:02:28 -0600 | ||||||||||||||||||||||||||||||||||||||||||||||||
| Cite this page as follows | Statistical Computations at FreeStatistics.org, Office for Research Development and Education, URL https://freestatistics.org/blog/index.php?v=date/2008/Oct/24/t1224839020zy2b6ixzxw10wf9.htm/, Retrieved Sun, 19 May 2024 13:31:53 +0000 | ||||||||||||||||||||||||||||||||||||||||||||||||
| Statistical Computations at FreeStatistics.org, Office for Research Development and Education, URL https://freestatistics.org/blog/index.php?pk=18572, Retrieved Sun, 19 May 2024 13:31:53 +0000 | |||||||||||||||||||||||||||||||||||||||||||||||||
| QR Codes: | |||||||||||||||||||||||||||||||||||||||||||||||||
|
| |||||||||||||||||||||||||||||||||||||||||||||||||
| Original text written by user: | |||||||||||||||||||||||||||||||||||||||||||||||||
| IsPrivate? | No (this computation is public) | ||||||||||||||||||||||||||||||||||||||||||||||||
| User-defined keywords | |||||||||||||||||||||||||||||||||||||||||||||||||
| Estimated Impact | 194 | ||||||||||||||||||||||||||||||||||||||||||||||||
Tree of Dependent Computations | |||||||||||||||||||||||||||||||||||||||||||||||||
| Family? (F = Feedback message, R = changed R code, M = changed R Module, P = changed Parameters, D = changed Data) | |||||||||||||||||||||||||||||||||||||||||||||||||
| F [Tukey lambda PPCC Plot] [Tukey lambda tot ...] [2008-10-24 09:02:28] [bda7fba231d49184c6a1b627868bbb81] [Current] F RMPD [Univariate Explorative Data Analysis] [explor data analy...] [2008-10-24 09:19:19] [e1a46c1dcfccb0cb690f79a1a409b517] - PD [Univariate Explorative Data Analysis] [Q2 Univariate Exp...] [2008-11-03 09:30:06] [7d3039e6253bb5fb3b26df1537d500b4] - RMPD [Univariate Explorative Data Analysis] [Correlatie vervaa...] [2008-10-24 09:47:43] [e1a46c1dcfccb0cb690f79a1a409b517] - PD [Univariate Explorative Data Analysis] [lags = 36 autocor...] [2008-10-29 14:13:45] [e1a46c1dcfccb0cb690f79a1a409b517] F RMPD [Univariate Explorative Data Analysis] [unvariate explor ...] [2008-10-24 10:34:50] [e1a46c1dcfccb0cb690f79a1a409b517] F RMPD [Harrell-Davis Quantiles] [harrel davis quan...] [2008-10-24 11:27:18] [e1a46c1dcfccb0cb690f79a1a409b517] F RM D [Central Tendency] [central tendency ...] [2008-10-24 11:45:35] [e1a46c1dcfccb0cb690f79a1a409b517] F RMPD [Univariate Explorative Data Analysis] [Univariate Explor...] [2008-10-24 12:02:31] [e1a46c1dcfccb0cb690f79a1a409b517] - PD [Univariate Explorative Data Analysis] [Univariate Explor...] [2008-10-24 12:14:49] [e1a46c1dcfccb0cb690f79a1a409b517] - RMP [Tukey lambda PPCC Plot] [Tukey lambda vlaa...] [2008-10-24 12:22:32] [e1a46c1dcfccb0cb690f79a1a409b517] - RMPD [Harrell-Davis Quantiles] [harrel davis quan...] [2008-10-24 12:28:14] [e1a46c1dcfccb0cb690f79a1a409b517] - PD [Univariate Explorative Data Analysis] [UEDA - Vlaams gew...] [2008-10-26 09:55:38] [46c5a5fbda57fdfa1d4ef48658f82a0c] - RMP [Tukey lambda PPCC Plot] [PPCC Tukey Lambda...] [2008-10-26 10:08:44] [46c5a5fbda57fdfa1d4ef48658f82a0c] - D [Tukey lambda PPCC Plot] [PPCC Tukey Lambda...] [2008-10-26 17:52:44] [46c5a5fbda57fdfa1d4ef48658f82a0c] F D [Tukey lambda PPCC Plot] [Taak 3 Q8] [2008-10-27 08:04:07] [29647dffafb5b58c12a48dbf6cba2b57] - RMP [Harrell-Davis Quantiles] [Harrell-Davis - V...] [2008-10-26 10:14:34] [46c5a5fbda57fdfa1d4ef48658f82a0c] - D [Harrell-Davis Quantiles] [Harrell-Davis - B...] [2008-10-26 17:55:06] [74be16979710d4c4e7c6647856088456] F D [Harrell-Davis Quantiles] [Harrell-Davis - B...] [2008-10-26 17:55:06] [46c5a5fbda57fdfa1d4ef48658f82a0c] F D [Harrell-Davis Quantiles] [Taak 3 Q9] [2008-10-27 08:18:25] [29647dffafb5b58c12a48dbf6cba2b57] F D [Univariate Explorative Data Analysis] [4plot prijs kledi...] [2008-10-26 10:30:49] [46c5a5fbda57fdfa1d4ef48658f82a0c] F D [Univariate Explorative Data Analysis] [taak 2/1] [2008-10-26 11:52:50] [29647dffafb5b58c12a48dbf6cba2b57] F D [Univariate Explorative Data Analysis] [taak 2/2] [2008-10-26 14:28:17] [29647dffafb5b58c12a48dbf6cba2b57] - [Univariate Explorative Data Analysis] [Prijs Kledij - To...] [2008-10-27 10:12:59] [b5373f20234c18c6452d5f98d8abf0fe] - RMP [Central Tendency] [taak 3 task 2 ver...] [2008-10-28 19:19:05] [46c5a5fbda57fdfa1d4ef48658f82a0c] - RMP [Tukey lambda PPCC Plot] [Feedback Lambda] [2008-11-04 08:50:20] [b635de6fc42b001d22cbe6e730fec936] F D [Univariate Explorative Data Analysis] [4plot investering...] [2008-10-26 10:33:39] [46c5a5fbda57fdfa1d4ef48658f82a0c] F D [Univariate Explorative Data Analysis] [4plot prijs kledi...] [2008-10-26 10:43:33] [46c5a5fbda57fdfa1d4ef48658f82a0c] - RM D [Central Tendency] [taak 3 task 2 ver...] [2008-10-28 19:23:37] [46c5a5fbda57fdfa1d4ef48658f82a0c] - D [Univariate Explorative Data Analysis] [Investering - Tot...] [2008-10-27 10:05:38] [b5373f20234c18c6452d5f98d8abf0fe] - RMPD [Central Tendency] [taak 3 task 2 ver...] [2008-10-28 19:21:48] [46c5a5fbda57fdfa1d4ef48658f82a0c] F D [Univariate Explorative Data Analysis] [4 plot Belgi�] [2008-10-26 17:47:31] [46c5a5fbda57fdfa1d4ef48658f82a0c] - RM [Central Tendency] [taak 3 task 3 ver...] [2008-10-28 19:26:19] [46c5a5fbda57fdfa1d4ef48658f82a0c] - RMP [Tukey lambda PPCC Plot] [Feedback Lambda] [2008-11-04 09:03:43] [b635de6fc42b001d22cbe6e730fec936] F D [Univariate Explorative Data Analysis] [Taak 3 Q7] [2008-10-27 07:50:28] [29647dffafb5b58c12a48dbf6cba2b57] F D [Tukey lambda PPCC Plot] [PPCC Tukey Lambda] [2008-10-26 09:19:51] [46c5a5fbda57fdfa1d4ef48658f82a0c] | |||||||||||||||||||||||||||||||||||||||||||||||||
| Feedback Forum | |||||||||||||||||||||||||||||||||||||||||||||||||
Post a new message | |||||||||||||||||||||||||||||||||||||||||||||||||
Dataset | |||||||||||||||||||||||||||||||||||||||||||||||||
| Dataseries X: | |||||||||||||||||||||||||||||||||||||||||||||||||
110,40 96,40 101,90 106,20 81,00 94,70 101,00 109,40 102,30 90,70 96,20 96,10 106,00 103,10 102,00 104,70 86,00 92,10 106,90 112,60 101,70 92,00 97,40 97,00 105,40 102,70 98,10 104,50 87,40 89,90 109,80 111,70 98,60 96,90 95,10 97,00 112,70 102,90 97,40 111,40 87,40 96,80 114,10 110,30 103,90 101,60 94,60 95,90 104,70 102,80 98,10 113,90 80,90 95,70 113,20 105,90 108,80 102,30 99,00 100,70 115,50 | |||||||||||||||||||||||||||||||||||||||||||||||||
Tables (Output of Computation) | |||||||||||||||||||||||||||||||||||||||||||||||||
| |||||||||||||||||||||||||||||||||||||||||||||||||
Figures (Output of Computation) | |||||||||||||||||||||||||||||||||||||||||||||||||
Input Parameters & R Code | |||||||||||||||||||||||||||||||||||||||||||||||||
| Parameters (Session): | |||||||||||||||||||||||||||||||||||||||||||||||||
| Parameters (R input): | |||||||||||||||||||||||||||||||||||||||||||||||||
| R code (references can be found in the software module): | |||||||||||||||||||||||||||||||||||||||||||||||||
gp <- function(lambda, p) | |||||||||||||||||||||||||||||||||||||||||||||||||