Free Statistics

of Irreproducible Research!

Author's title

Author*The author of this computation has been verified*
R Software Modulerwasp_edauni.wasp
Title produced by softwareUnivariate Explorative Data Analysis
Date of computationWed, 22 Oct 2008 14:19:52 -0600
Cite this page as followsStatistical Computations at FreeStatistics.org, Office for Research Development and Education, URL https://freestatistics.org/blog/index.php?v=date/2008/Oct/22/t1224706867eay3guqwbod6txs.htm/, Retrieved Sun, 19 May 2024 14:11:55 +0000
Statistical Computations at FreeStatistics.org, Office for Research Development and Education, URL https://freestatistics.org/blog/index.php?pk=18438, Retrieved Sun, 19 May 2024 14:11:55 +0000
QR Codes:

Original text written by user:
IsPrivate?No (this computation is public)
User-defined keywords
Estimated Impact206
Family? (F = Feedback message, R = changed R code, M = changed R Module, P = changed Parameters, D = changed Data)
F       [Univariate Explorative Data Analysis] [Productie van kle...] [2008-10-22 20:19:52] [6aa66640011d9b98524a5838bcf7301d] [Current]
Feedback Forum
2008-10-29 16:07:51 [Nathalie Koulouris] [reply
Om te onderzoeken of de tijdreeks autocorrelatie bevat, had de student gebruik moeten maken van de Lag plot.
2008-11-02 15:59:33 [Kristof Augustyns] [reply
Hier is er nog maar eens geen gebruik gemaakt van de lag plot om zo ook een beter zicht te krijgen over de seizonaliteit.
De lag plot moet gewijzigd worden in '12' of '36' en is hier dus niet gebeurd.
https://automated.biganalytics.eu/rwasp_edauni.wasp?parent=t1224706867eay3guqwbod6txs
Voor de rest is alles wel juist geïnterpreteerd.
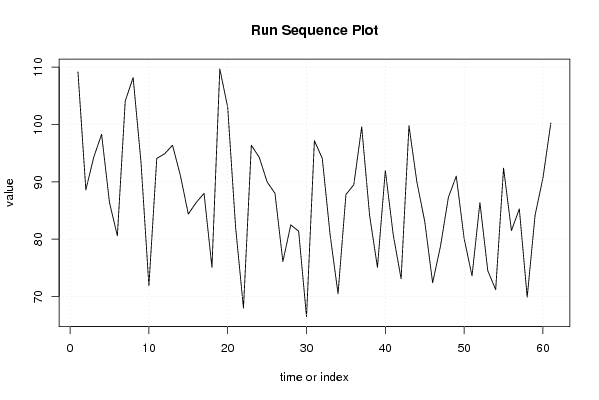
Assumption 1: Er is een neerwaarts patroon tot '30' en vanaf dan geen uitschieters meer.
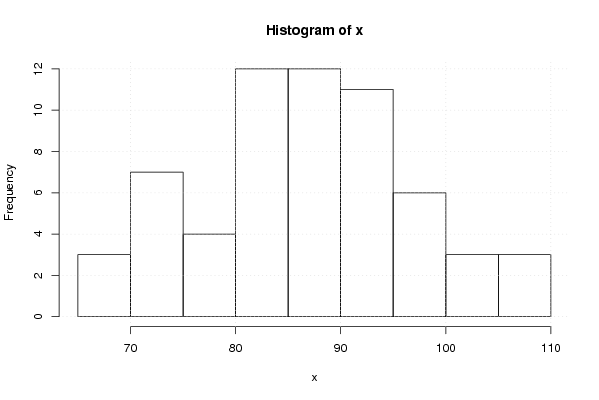
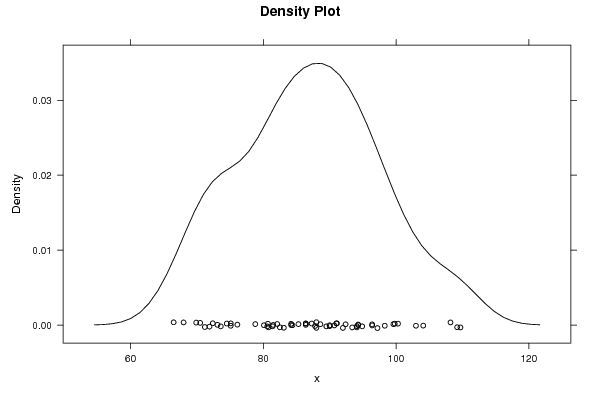
Assumption 2: De spreiding is hier perfect en staan allemaal vrij dicht tegen de lijn (bijna perfect verdeling) en dit ondanks het feit dat we geen autocorrelatie hebben.
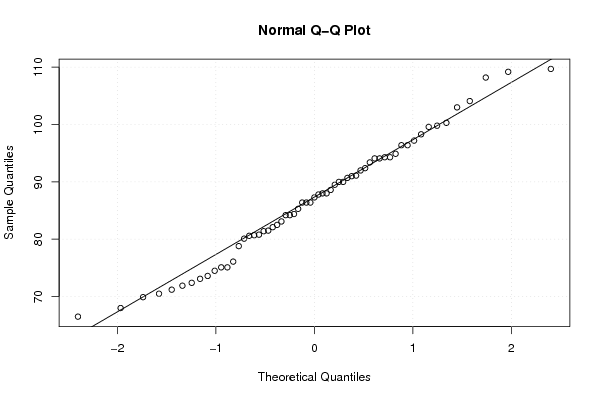
Assumption 3: Het is een feit dat de uiteinden niet direct constant zijn (normal qq-plot), maar al bij al is het geheel wel vrij constant.
Op de 'run sequence plot' zie je dat er eerst een achteruitgang is, maar die is zeker niet constant.
Het is niet omdat het gemiddelde ronde de 87 schommelt, dat er geen achteruitgang is.
Assumption 4: Men kan het afleiden.
Er is sprijding over de tijd heen, sprijding 1ste deel is > sprijding 2de deel.
2008-11-02 18:57:04 [Annelies Michiels] [reply
Allereerst moet het aantal lags worden aangeduid anders krijgen we geen lag plot grafieken en kunnen we de autocorrelatie niet berekenen:
http://www.freestatistics.org/blog/index.php?v=date/2008/Nov/02/t12256472260x1ms3faie36aej.htm

Assumption 1:
Om de autocorrelatie te berekenen maken we geen gebruik van de run sequency plot maar van de lag plot. Aan de hand van de lag plot kunnen we de volgende vraag stellen: Wat is het verband tussen het heden en het verleden?
Als er autocorrelatie bestaat zou men voorspellingen kunnen maken voor bv. de volgende maand.
Als we de lag plot voor 36 maanden bekijken kunnen we zien dat er een positieve seizonale correlatie is. Dit wil zeggen dat men niet per maand maar wel per jaar ongeveer kan voorspellen welke trend er zich zal voordoen.

Assumption 2:
Hier heeft de student inderdaad gelijk dat er een vrij gelijke spreiding is. We kunnen hier dus spreken van een min of meer normaalverdeling. Bovendien moet er niet alleen naar het histogram worden gekeken maar ook naar het Q-Q plot, hier liggen de punten zo goed als allemaal op 1 rechte.
Dit bewijst nogmaals dat we kunnen spreken van een normaalverdeling.

Assumptie 3:
Hier moeten we naar de run sequency plot kijken en niet naar de Q-Q plot zoals de student beweert. Uit de run sequency plot zien we dat de frequency zachtjes daalt en dus niet constant is.

Assumptie 4:
Deze assumptie kunnen we wel controleren namelijk we moeten het run sequency plot bekijken. Hier moeten we kijken naar de spreiding van de reeks over de tijd. Als we de grafiek bekijken zien we dat deze spreiding schommelt over de tijd. In het eerste deel is deze spreiding groter.

Post a new message
Dataseries X:
109,20
88,60
94,30
98,30
86,40
80,60
104,10
108,20
93,40
71,90
94,10
94,90
96,40
91,10
84,40
86,40
88,00
75,10
109,70
103,00
82,10
68,00
96,40
94,30
90,00
88,00
76,10
82,50
81,40
66,50
97,20
94,10
80,70
70,50
87,80
89,50
99,60
84,20
75,10
92,00
80,80
73,10
99,80
90,00
83,10
72,40
78,80
87,30
91,00
80,10
73,60
86,40
74,50
71,20
92,40
81,50
85,30
69,90
84,20
90,70
100,30


Summary of computational transaction
Raw Inputview raw input (R code)
Raw Outputview raw output of R engine
Computing time4 seconds
R Server'Sir Ronald Aylmer Fisher' @ 193.190.124.24

\begin{tabular}{lllllllll}
\hline
Summary of computational transaction \tabularnewline
Raw Input & view raw input (R code)  \tabularnewline
Raw Output & view raw output of R engine  \tabularnewline
Computing time & 4 seconds \tabularnewline
R Server & 'Sir Ronald Aylmer Fisher' @ 193.190.124.24 \tabularnewline
\hline
\end{tabular}
%Source: https://freestatistics.org/blog/index.php?pk=18438&T=0

[TABLE]
[ROW][C]Summary of computational transaction[/C][/ROW]
[ROW][C]Raw Input[/C][C]view raw input (R code) [/C][/ROW]
[ROW][C]Raw Output[/C][C]view raw output of R engine [/C][/ROW]
[ROW][C]Computing time[/C][C]4 seconds[/C][/ROW]
[ROW][C]R Server[/C][C]'Sir Ronald Aylmer Fisher' @ 193.190.124.24[/C][/ROW]
[/TABLE]
Source: https://freestatistics.org/blog/index.php?pk=18438&T=0

Globally Unique Identifier (entire table): ba.freestatistics.org/blog/index.php?pk=18438&T=0

As an alternative you can also use a QR Code:  

The GUIDs for individual cells are displayed in the table below:

Summary of computational transaction
Raw Inputview raw input (R code)
Raw Outputview raw output of R engine
Computing time4 seconds
R Server'Sir Ronald Aylmer Fisher' @ 193.190.124.24


Descriptive Statistics
# observations61
minimum66.5
Q180.6
median87.3
mean86.8934426229508
Q394.1
maximum109.7

\begin{tabular}{lllllllll}
\hline
Descriptive Statistics \tabularnewline
# observations & 61 \tabularnewline
minimum & 66.5 \tabularnewline
Q1 & 80.6 \tabularnewline
median & 87.3 \tabularnewline
mean & 86.8934426229508 \tabularnewline
Q3 & 94.1 \tabularnewline
maximum & 109.7 \tabularnewline
\hline
\end{tabular}
%Source: https://freestatistics.org/blog/index.php?pk=18438&T=1

[TABLE]
[ROW][C]Descriptive Statistics[/C][/ROW]
[ROW][C]# observations[/C][C]61[/C][/ROW]
[ROW][C]minimum[/C][C]66.5[/C][/ROW]
[ROW][C]Q1[/C][C]80.6[/C][/ROW]
[ROW][C]median[/C][C]87.3[/C][/ROW]
[ROW][C]mean[/C][C]86.8934426229508[/C][/ROW]
[ROW][C]Q3[/C][C]94.1[/C][/ROW]
[ROW][C]maximum[/C][C]109.7[/C][/ROW]
[/TABLE]
Source: https://freestatistics.org/blog/index.php?pk=18438&T=1

Globally Unique Identifier (entire table): ba.freestatistics.org/blog/index.php?pk=18438&T=1

As an alternative you can also use a QR Code:  

The GUIDs for individual cells are displayed in the table below:

Descriptive Statistics
# observations61
minimum66.5
Q180.6
median87.3
mean86.8934426229508
Q394.1
maximum109.7


Parameters (Session):
par1 = 0 ; par2 = 0 ;
Parameters (R input):
par1 = 0 ; par2 = 0 ;
R code (references can be found in the software module):
par1 <- as.numeric(par1)
par2 <- as.numeric(par2)
x <- as.ts(x)
library(lattice)
bitmap(file='pic1.png')
plot(x,type='l',main='Run Sequence Plot',xlab='time or index',ylab='value')
grid()
dev.off()
bitmap(file='pic2.png')
hist(x)
grid()
dev.off()
bitmap(file='pic3.png')
if (par1 > 0)
{
densityplot(~x,col='black',main=paste('Density Plot bw = ',par1),bw=par1)
} else {
densityplot(~x,col='black',main='Density Plot')
}
dev.off()
bitmap(file='pic4.png')
qqnorm(x)
qqline(x)
grid()
dev.off()
if (par2 > 0)
{
bitmap(file='lagplot1.png')
dum <- cbind(lag(x,k=1),x)
dum
dum1 <- dum[2:length(x),]
dum1
z <- as.data.frame(dum1)
z
plot(z,main='Lag plot (k=1), lowess, and regression line')
lines(lowess(z))
abline(lm(z))
dev.off()
if (par2 > 1) {
bitmap(file='lagplotpar2.png')
dum <- cbind(lag(x,k=par2),x)
dum
dum1 <- dum[(par2+1):length(x),]
dum1
z <- as.data.frame(dum1)
z
mylagtitle <- 'Lag plot (k='
mylagtitle <- paste(mylagtitle,par2,sep='')
mylagtitle <- paste(mylagtitle,'), and lowess',sep='')
plot(z,main=mylagtitle)
lines(lowess(z))
dev.off()
}
bitmap(file='pic5.png')
acf(x,lag.max=par2,main='Autocorrelation Function')
grid()
dev.off()
}
summary(x)
load(file='createtable')
a<-table.start()
a<-table.row.start(a)
a<-table.element(a,'Descriptive Statistics',2,TRUE)
a<-table.row.end(a)
a<-table.row.start(a)
a<-table.element(a,'# observations',header=TRUE)
a<-table.element(a,length(x))
a<-table.row.end(a)
a<-table.row.start(a)
a<-table.element(a,'minimum',header=TRUE)
a<-table.element(a,min(x))
a<-table.row.end(a)
a<-table.row.start(a)
a<-table.element(a,'Q1',header=TRUE)
a<-table.element(a,quantile(x,0.25))
a<-table.row.end(a)
a<-table.row.start(a)
a<-table.element(a,'median',header=TRUE)
a<-table.element(a,median(x))
a<-table.row.end(a)
a<-table.row.start(a)
a<-table.element(a,'mean',header=TRUE)
a<-table.element(a,mean(x))
a<-table.row.end(a)
a<-table.row.start(a)
a<-table.element(a,'Q3',header=TRUE)
a<-table.element(a,quantile(x,0.75))
a<-table.row.end(a)
a<-table.row.start(a)
a<-table.element(a,'maximum',header=TRUE)
a<-table.element(a,max(x))
a<-table.row.end(a)
a<-table.end(a)
table.save(a,file='mytable.tab')