Free Statistics
of Irreproducible Research!
Description of Statistical Computation | |||||||||||||||||||||
|---|---|---|---|---|---|---|---|---|---|---|---|---|---|---|---|---|---|---|---|---|---|
| Author's title | |||||||||||||||||||||
| Author | *The author of this computation has been verified* | ||||||||||||||||||||
| R Software Module | rwasp_backtobackhist.wasp | ||||||||||||||||||||
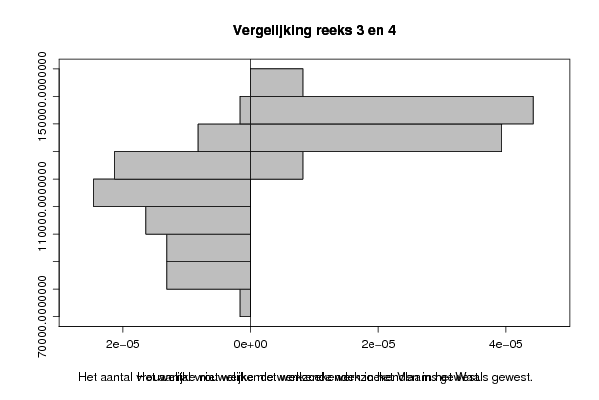
| Title produced by software | Back to Back Histogram | ||||||||||||||||||||
| Date of computation | Tue, 21 Oct 2008 01:44:07 -0600 | ||||||||||||||||||||
| Cite this page as follows | Statistical Computations at FreeStatistics.org, Office for Research Development and Education, URL https://freestatistics.org/blog/index.php?v=date/2008/Oct/21/t1224575094w9wpbwgpznefn67.htm/, Retrieved Sun, 19 May 2024 17:03:46 +0000 | ||||||||||||||||||||
| Statistical Computations at FreeStatistics.org, Office for Research Development and Education, URL https://freestatistics.org/blog/index.php?pk=18369, Retrieved Sun, 19 May 2024 17:03:46 +0000 | |||||||||||||||||||||
| QR Codes: | |||||||||||||||||||||
|
| |||||||||||||||||||||
| Original text written by user: | |||||||||||||||||||||
| IsPrivate? | No (this computation is public) | ||||||||||||||||||||
| User-defined keywords | |||||||||||||||||||||
| Estimated Impact | 130 | ||||||||||||||||||||
Tree of Dependent Computations | |||||||||||||||||||||
| Family? (F = Feedback message, R = changed R code, M = changed R Module, P = changed Parameters, D = changed Data) | |||||||||||||||||||||
| F [Univariate Data Series] [Niet werkende wer...] [2008-10-13 17:23:56] [91d2608132ba5d00ecce3524d8276757] - RMPD [Back to Back Histogram] [Vergelijking reek...] [2008-10-21 07:37:01] [deb3c14ac9e4607a6d84fc9d0e0e6cc2] - PD [Back to Back Histogram] [Vergelijking reek...] [2008-10-21 07:39:27] [deb3c14ac9e4607a6d84fc9d0e0e6cc2] - PD [Back to Back Histogram] [Vergelijking reek...] [2008-10-21 07:44:07] [5e9e099b83e50415d7642e10d74756e4] [Current] | |||||||||||||||||||||
| Feedback Forum | |||||||||||||||||||||
Post a new message | |||||||||||||||||||||
Dataset | |||||||||||||||||||||
| Dataseries X: | |||||||||||||||||||||
121148 114624 109822 112081 113534 112110 109826 107423 105540 108573 128591 139145 129700 132828 126868 128390 126830 124105 122323 119296 116822 119224 139357 144322 133676 128283 121640 122877 117284 116463 112685 113235 111692 113152 129889 131153 123770 112516 105940 104320 103582 99064 94989 92241 89752 90610 109456 110213 97694 91844 87572 89812 89050 85990 85070 83277 79586 84215 99708 100698 90861 | |||||||||||||||||||||
| Dataseries Y: | |||||||||||||||||||||
143119 140353 137149 138301 138709 138619 137528 134523 133593 135647 143541 144024 148607 148881 145447 144170 142148 142492 141703 139116 138461 139870 148703 150034 153670 147508 145150 143955 147608 144839 142096 138941 139093 141526 151492 155217 154530 148533 143923 141075 142261 140435 136169 136107 131063 127765 140731 145981 141834 137625 132515 131111 133603 132207 126488 125933 120927 122597 135437 138649 134576 | |||||||||||||||||||||
Tables (Output of Computation) | |||||||||||||||||||||
| |||||||||||||||||||||
Figures (Output of Computation) | |||||||||||||||||||||
Input Parameters & R Code | |||||||||||||||||||||
| Parameters (Session): | |||||||||||||||||||||
| par1 = Niet werkende werkzoekenden, totaal, Belgi� ; par2 = http://www.nbb.be/belgostat/PublicatieSelectieLinker?LinkID=117000046|910000082&Lang=N ; | |||||||||||||||||||||
| Parameters (R input): | |||||||||||||||||||||
| par1 = grey ; par2 = grey ; par3 = TRUE ; par4 = Het aantal vrouwelijke niet werkende werkzoekenden in het Vlaams gewest. ; par5 = Het aantal vrouwelijke niet werkende werkzoekenden in het Waals gewest. ; | |||||||||||||||||||||
| R code (references can be found in the software module): | |||||||||||||||||||||
if (par3 == 'TRUE') par3 <- TRUE | |||||||||||||||||||||