Free Statistics

of Irreproducible Research!

Author's title

Author*The author of this computation has been verified*
R Software Modulerwasp_histogram.wasp
Title produced by softwareHistogram
Date of computationTue, 21 Oct 2008 01:31:09 -0600
Cite this page as followsStatistical Computations at FreeStatistics.org, Office for Research Development and Education, URL https://freestatistics.org/blog/index.php?v=date/2008/Oct/21/t1224574306e3blx7yf72zs22t.htm/, Retrieved Sun, 19 May 2024 18:22:12 +0000
Statistical Computations at FreeStatistics.org, Office for Research Development and Education, URL https://freestatistics.org/blog/index.php?pk=18359, Retrieved Sun, 19 May 2024 18:22:12 +0000
QR Codes:

Original text written by user:
IsPrivate?No (this computation is public)
User-defined keywords
Estimated Impact165
Family? (F = Feedback message, R = changed R code, M = changed R Module, P = changed Parameters, D = changed Data)
F     [Univariate Data Series] [Niet werkende wer...] [2008-10-13 17:30:07] [91d2608132ba5d00ecce3524d8276757]
- RMP     [Histogram] [Histogram vrouwel...] [2008-10-21 07:31:09] [5e9e099b83e50415d7642e10d74756e4] [Current]
Feedback Forum

Post a new message
Dataseries X:
143119
140353
137149
138301
138709
138619
137528
134523
133593
135647
143541
144024
148607
148881
145447
144170
142148
142492
141703
139116
138461
139870
148703
150034
153670
147508
145150
143955
147608
144839
142096
138941
139093
141526
151492
155217
154530
148533
143923
141075
142261
140435
136169
136107
131063
127765
140731
145981
141834
137625
132515
131111
133603
132207
126488
125933
120927
122597
135437
138649
134576


Summary of computational transaction
Raw Inputview raw input (R code)
Raw Outputview raw output of R engine
Computing time1 seconds
R Server'Gwilym Jenkins' @ 72.249.127.135

\begin{tabular}{lllllllll}
\hline
Summary of computational transaction \tabularnewline
Raw Input & view raw input (R code)  \tabularnewline
Raw Output & view raw output of R engine  \tabularnewline
Computing time & 1 seconds \tabularnewline
R Server & 'Gwilym Jenkins' @ 72.249.127.135 \tabularnewline
\hline
\end{tabular}
%Source: https://freestatistics.org/blog/index.php?pk=18359&T=0

[TABLE]
[ROW][C]Summary of computational transaction[/C][/ROW]
[ROW][C]Raw Input[/C][C]view raw input (R code) [/C][/ROW]
[ROW][C]Raw Output[/C][C]view raw output of R engine [/C][/ROW]
[ROW][C]Computing time[/C][C]1 seconds[/C][/ROW]
[ROW][C]R Server[/C][C]'Gwilym Jenkins' @ 72.249.127.135[/C][/ROW]
[/TABLE]
Source: https://freestatistics.org/blog/index.php?pk=18359&T=0

Globally Unique Identifier (entire table): ba.freestatistics.org/blog/index.php?pk=18359&T=0

As an alternative you can also use a QR Code:  

The GUIDs for individual cells are displayed in the table below:

Summary of computational transaction
Raw Inputview raw input (R code)
Raw Outputview raw output of R engine
Computing time1 seconds
R Server'Gwilym Jenkins' @ 72.249.127.135


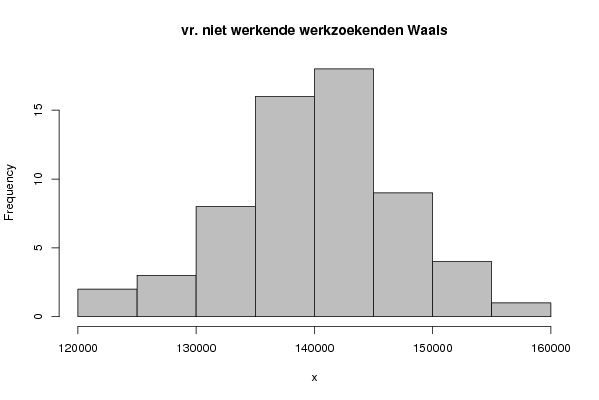
Frequency Table (Histogram)
BinsMidpointAbs. FrequencyRel. FrequencyCumul. Rel. Freq.Density
[120000,125000[12250020.0327870.0327877e-06
[125000,130000[12750030.049180.0819671e-05
[130000,135000[13250080.1311480.2131152.6e-05
[135000,140000[137500160.2622950.475415.2e-05
[140000,145000[142500180.2950820.7704925.9e-05
[145000,150000[14750090.1475410.9180333e-05
[150000,155000[15250040.0655740.9836071.3e-05
[155000,160000]15750010.01639313e-06

\begin{tabular}{lllllllll}
\hline
Frequency Table (Histogram) \tabularnewline
Bins & Midpoint & Abs. Frequency & Rel. Frequency & Cumul. Rel. Freq. & Density \tabularnewline
[120000,125000[ & 122500 & 2 & 0.032787 & 0.032787 & 7e-06 \tabularnewline
[125000,130000[ & 127500 & 3 & 0.04918 & 0.081967 & 1e-05 \tabularnewline
[130000,135000[ & 132500 & 8 & 0.131148 & 0.213115 & 2.6e-05 \tabularnewline
[135000,140000[ & 137500 & 16 & 0.262295 & 0.47541 & 5.2e-05 \tabularnewline
[140000,145000[ & 142500 & 18 & 0.295082 & 0.770492 & 5.9e-05 \tabularnewline
[145000,150000[ & 147500 & 9 & 0.147541 & 0.918033 & 3e-05 \tabularnewline
[150000,155000[ & 152500 & 4 & 0.065574 & 0.983607 & 1.3e-05 \tabularnewline
[155000,160000] & 157500 & 1 & 0.016393 & 1 & 3e-06 \tabularnewline
\hline
\end{tabular}
%Source: https://freestatistics.org/blog/index.php?pk=18359&T=1

[TABLE]
[ROW][C]Frequency Table (Histogram)[/C][/ROW]
[ROW][C]Bins[/C][C]Midpoint[/C][C]Abs. Frequency[/C][C]Rel. Frequency[/C][C]Cumul. Rel. Freq.[/C][C]Density[/C][/ROW]
[ROW][C][120000,125000[[/C][C]122500[/C][C]2[/C][C]0.032787[/C][C]0.032787[/C][C]7e-06[/C][/ROW]
[ROW][C][125000,130000[[/C][C]127500[/C][C]3[/C][C]0.04918[/C][C]0.081967[/C][C]1e-05[/C][/ROW]
[ROW][C][130000,135000[[/C][C]132500[/C][C]8[/C][C]0.131148[/C][C]0.213115[/C][C]2.6e-05[/C][/ROW]
[ROW][C][135000,140000[[/C][C]137500[/C][C]16[/C][C]0.262295[/C][C]0.47541[/C][C]5.2e-05[/C][/ROW]
[ROW][C][140000,145000[[/C][C]142500[/C][C]18[/C][C]0.295082[/C][C]0.770492[/C][C]5.9e-05[/C][/ROW]
[ROW][C][145000,150000[[/C][C]147500[/C][C]9[/C][C]0.147541[/C][C]0.918033[/C][C]3e-05[/C][/ROW]
[ROW][C][150000,155000[[/C][C]152500[/C][C]4[/C][C]0.065574[/C][C]0.983607[/C][C]1.3e-05[/C][/ROW]
[ROW][C][155000,160000][/C][C]157500[/C][C]1[/C][C]0.016393[/C][C]1[/C][C]3e-06[/C][/ROW]
[/TABLE]
Source: https://freestatistics.org/blog/index.php?pk=18359&T=1

Globally Unique Identifier (entire table): ba.freestatistics.org/blog/index.php?pk=18359&T=1

As an alternative you can also use a QR Code:  

The GUIDs for individual cells are displayed in the table below:

Frequency Table (Histogram)
BinsMidpointAbs. FrequencyRel. FrequencyCumul. Rel. Freq.Density
[120000,125000[12250020.0327870.0327877e-06
[125000,130000[12750030.049180.0819671e-05
[130000,135000[13250080.1311480.2131152.6e-05
[135000,140000[137500160.2622950.475415.2e-05
[140000,145000[142500180.2950820.7704925.9e-05
[145000,150000[14750090.1475410.9180333e-05
[150000,155000[15250040.0655740.9836071.3e-05
[155000,160000]15750010.01639313e-06


Parameters (Session):
par2 = grey ; par3 = FALSE ; par4 = Unknown ;
Parameters (R input):
par1 = ; par2 = grey ; par3 = FALSE ; par4 = Unknown ;
R code (references can be found in the software module):
par1 <- as.numeric(par1)
if (par3 == 'TRUE') par3 <- TRUE
if (par3 == 'FALSE') par3 <- FALSE
if (par4 == 'Unknown') par1 <- as.numeric(par1)
if (par4 == 'Interval/Ratio') par1 <- as.numeric(par1)
if (par4 == '3-point Likert') par1 <- c(1:3 - 0.5, 3.5)
if (par4 == '4-point Likert') par1 <- c(1:4 - 0.5, 4.5)
if (par4 == '5-point Likert') par1 <- c(1:5 - 0.5, 5.5)
if (par4 == '6-point Likert') par1 <- c(1:6 - 0.5, 6.5)
if (par4 == '7-point Likert') par1 <- c(1:7 - 0.5, 7.5)
if (par4 == '8-point Likert') par1 <- c(1:8 - 0.5, 8.5)
if (par4 == '9-point Likert') par1 <- c(1:9 - 0.5, 9.5)
if (par4 == '10-point Likert') par1 <- c(1:10 - 0.5, 10.5)
bitmap(file='test1.png')
if (is.na(par1)) {
myhist<-hist(x,col=par2,main=main,xlab=xlab,right=par3)
} else {
if (par1 < 0) par1 <- 3
if (par1 > 50) par1 <- 50
myhist<-hist(x,breaks=par1,col=par2,main=main,xlab=xlab,right=par3)
}
dev.off()
myhist
n <- length(x)
load(file='createtable')
a<-table.start()
a<-table.row.start(a)
a<-table.element(a,hyperlink('histogram.htm','Frequency Table (Histogram)',''),6,TRUE)
a<-table.row.end(a)
a<-table.row.start(a)
a<-table.element(a,'Bins',header=TRUE)
a<-table.element(a,'Midpoint',header=TRUE)
a<-table.element(a,'Abs. Frequency',header=TRUE)
a<-table.element(a,'Rel. Frequency',header=TRUE)
a<-table.element(a,'Cumul. Rel. Freq.',header=TRUE)
a<-table.element(a,'Density',header=TRUE)
a<-table.row.end(a)
crf <- 0
if (par3 == FALSE) mybracket <- '[' else mybracket <- ']'
mynumrows <- (length(myhist$breaks)-1)
for (i in 1:mynumrows) {
a<-table.row.start(a)
if (i == 1)
dum <- paste('[',myhist$breaks[i],sep='')
else
dum <- paste(mybracket,myhist$breaks[i],sep='')
dum <- paste(dum,myhist$breaks[i+1],sep=',')
if (i==mynumrows)
dum <- paste(dum,']',sep='')
else
dum <- paste(dum,mybracket,sep='')
a<-table.element(a,dum,header=TRUE)
a<-table.element(a,myhist$mids[i])
a<-table.element(a,myhist$counts[i])
rf <- myhist$counts[i]/n
crf <- crf + rf
a<-table.element(a,round(rf,6))
a<-table.element(a,round(crf,6))
a<-table.element(a,round(myhist$density[i],6))
a<-table.row.end(a)
}
a<-table.end(a)
table.save(a,file='mytable.tab')