Free Statistics

of Irreproducible Research!

Author's title

Author*The author of this computation has been verified*
R Software Modulerwasp_correlation.wasp
Title produced by softwarePearson Correlation
Date of computationTue, 21 Oct 2008 01:17:41 -0600
Cite this page as followsStatistical Computations at FreeStatistics.org, Office for Research Development and Education, URL https://freestatistics.org/blog/index.php?v=date/2008/Oct/21/t1224573704ltkma9tkem07ws0.htm/, Retrieved Sun, 19 May 2024 17:13:37 +0000
Statistical Computations at FreeStatistics.org, Office for Research Development and Education, URL https://freestatistics.org/blog/index.php?pk=18351, Retrieved Sun, 19 May 2024 17:13:37 +0000
QR Codes:

Original text written by user:
IsPrivate?No (this computation is public)
User-defined keywords
Estimated Impact129
Family? (F = Feedback message, R = changed R code, M = changed R Module, P = changed Parameters, D = changed Data)
F       [Pearson Correlation] [Relatie tussen ti...] [2008-10-21 07:17:41] [5c47fb92bd9179cc1ad56f5160f63d38] [Current]
Feedback Forum
2008-10-27 20:08:34 [Jan Helsen] [reply
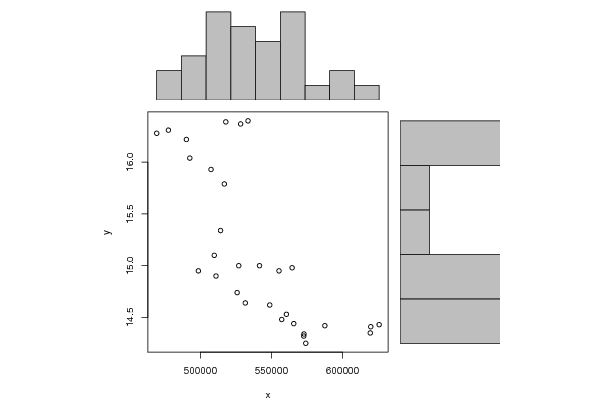
Je concludeert dat je hier een sterke correlatie hebt maar je vergeet wel te zeggen dat het om een negatieve correlatie gaat. Dit is zeer belangrijk om de twee tijdreeksen correct te interpreteren voor iemand die deze berekening niet kan zien.

Post a new message
Dataseries X:
517945
533590
528379
477580
469357
490243
492622
507561
516922
514258
509846
527070
541657
564591
555362
498662
511038
525919
531673
548854
560576
557274
565742
587625
619916
625809
619567
572942
572775
574205
Dataseries Y:
16.39
16.4
16.37
16.31
16.28
16.22
16.04
15.93
15.79
15.34
15.1
15
15
14.98
14.95
14.95
14.9
14.74
14.64
14.62
14.53
14.48
14.44
14.42
14.41
14.43
14.35
14.34
14.32
14.25


Summary of computational transaction
Raw Inputview raw input (R code)
Raw Outputview raw output of R engine
Computing time1 seconds
R Server'Sir Ronald Aylmer Fisher' @ 193.190.124.24

\begin{tabular}{lllllllll}
\hline
Summary of computational transaction \tabularnewline
Raw Input & view raw input (R code)  \tabularnewline
Raw Output & view raw output of R engine  \tabularnewline
Computing time & 1 seconds \tabularnewline
R Server & 'Sir Ronald Aylmer Fisher' @ 193.190.124.24 \tabularnewline
\hline
\end{tabular}
%Source: https://freestatistics.org/blog/index.php?pk=18351&T=0

[TABLE]
[ROW][C]Summary of computational transaction[/C][/ROW]
[ROW][C]Raw Input[/C][C]view raw input (R code) [/C][/ROW]
[ROW][C]Raw Output[/C][C]view raw output of R engine [/C][/ROW]
[ROW][C]Computing time[/C][C]1 seconds[/C][/ROW]
[ROW][C]R Server[/C][C]'Sir Ronald Aylmer Fisher' @ 193.190.124.24[/C][/ROW]
[/TABLE]
Source: https://freestatistics.org/blog/index.php?pk=18351&T=0

Globally Unique Identifier (entire table): ba.freestatistics.org/blog/index.php?pk=18351&T=0

As an alternative you can also use a QR Code:  

The GUIDs for individual cells are displayed in the table below:

Summary of computational transaction
Raw Inputview raw input (R code)
Raw Outputview raw output of R engine
Computing time1 seconds
R Server'Sir Ronald Aylmer Fisher' @ 193.190.124.24


Pearson Product Moment Correlation - Ungrouped Data
StatisticVariable XVariable Y
Mean54065215.1306666666667
Biased Variance1612685698.733330.561672888888889
Biased Standard Deviation40158.25816358740.749448389743342
Covariance-23158.6517241379
Correlation-0.743829531294571
Determination0.553282371625901
T-Test-5.88892314927698
p-value (2 sided)2.46854157442132e-06
p-value (1 sided)1.23427078721066e-06
Degrees of Freedom28
Number of Observations30

\begin{tabular}{lllllllll}
\hline
Pearson Product Moment Correlation - Ungrouped Data \tabularnewline
Statistic & Variable X & Variable Y \tabularnewline
Mean & 540652 & 15.1306666666667 \tabularnewline
Biased Variance & 1612685698.73333 & 0.561672888888889 \tabularnewline
Biased Standard Deviation & 40158.2581635874 & 0.749448389743342 \tabularnewline
Covariance & -23158.6517241379 \tabularnewline
Correlation & -0.743829531294571 \tabularnewline
Determination & 0.553282371625901 \tabularnewline
T-Test & -5.88892314927698 \tabularnewline
p-value (2 sided) & 2.46854157442132e-06 \tabularnewline
p-value (1 sided) & 1.23427078721066e-06 \tabularnewline
Degrees of Freedom & 28 \tabularnewline
Number of Observations & 30 \tabularnewline
\hline
\end{tabular}
%Source: https://freestatistics.org/blog/index.php?pk=18351&T=1

[TABLE]
[ROW][C]Pearson Product Moment Correlation - Ungrouped Data[/C][/ROW]
[ROW][C]Statistic[/C][C]Variable X[/C][C]Variable Y[/C][/ROW]
[ROW][C]Mean[/C][C]540652[/C][C]15.1306666666667[/C][/ROW]
[ROW][C]Biased Variance[/C][C]1612685698.73333[/C][C]0.561672888888889[/C][/ROW]
[ROW][C]Biased Standard Deviation[/C][C]40158.2581635874[/C][C]0.749448389743342[/C][/ROW]
[ROW][C]Covariance[/C][C]-23158.6517241379[/C][/ROW]
[ROW][C]Correlation[/C][C]-0.743829531294571[/C][/ROW]
[ROW][C]Determination[/C][C]0.553282371625901[/C][/ROW]
[ROW][C]T-Test[/C][C]-5.88892314927698[/C][/ROW]
[ROW][C]p-value (2 sided)[/C][C]2.46854157442132e-06[/C][/ROW]
[ROW][C]p-value (1 sided)[/C][C]1.23427078721066e-06[/C][/ROW]
[ROW][C]Degrees of Freedom[/C][C]28[/C][/ROW]
[ROW][C]Number of Observations[/C][C]30[/C][/ROW]
[/TABLE]
Source: https://freestatistics.org/blog/index.php?pk=18351&T=1

Globally Unique Identifier (entire table): ba.freestatistics.org/blog/index.php?pk=18351&T=1

As an alternative you can also use a QR Code:  

The GUIDs for individual cells are displayed in the table below:

Pearson Product Moment Correlation - Ungrouped Data
StatisticVariable XVariable Y
Mean54065215.1306666666667
Biased Variance1612685698.733330.561672888888889
Biased Standard Deviation40158.25816358740.749448389743342
Covariance-23158.6517241379
Correlation-0.743829531294571
Determination0.553282371625901
T-Test-5.88892314927698
p-value (2 sided)2.46854157442132e-06
p-value (1 sided)1.23427078721066e-06
Degrees of Freedom28
Number of Observations30


Parameters (Session):
Parameters (R input):
R code (references can be found in the software module):
bitmap(file='test1.png')
histx <- hist(x, plot=FALSE)
histy <- hist(y, plot=FALSE)
maxcounts <- max(c(histx$counts, histx$counts))
xrange <- c(min(x),max(x))
yrange <- c(min(y),max(y))
nf <- layout(matrix(c(2,0,1,3),2,2,byrow=TRUE), c(3,1), c(1,3), TRUE)
par(mar=c(4,4,1,1))
plot(x, y, xlim=xrange, ylim=yrange, xlab=xlab, ylab=ylab)
par(mar=c(0,4,1,1))
barplot(histx$counts, axes=FALSE, ylim=c(0, maxcounts), space=0)
par(mar=c(4,0,1,1))
barplot(histy$counts, axes=FALSE, xlim=c(0, maxcounts), space=0, horiz=TRUE)
dev.off()
lx = length(x)
makebiased = (lx-1)/lx
varx = var(x)*makebiased
vary = var(y)*makebiased
corxy <- cor.test(x,y,method='pearson')
cxy <- as.matrix(corxy$estimate)[1,1]
load(file='createtable')
a<-table.start()
a<-table.row.start(a)
a<-table.element(a,'Pearson Product Moment Correlation - Ungrouped Data',3,TRUE)
a<-table.row.end(a)
a<-table.row.start(a)
a<-table.element(a,'Statistic',1,TRUE)
a<-table.element(a,'Variable X',1,TRUE)
a<-table.element(a,'Variable Y',1,TRUE)
a<-table.row.end(a)
a<-table.row.start(a)
a<-table.element(a,hyperlink('arithmetic_mean.htm','Mean',''),header=TRUE)
a<-table.element(a,mean(x))
a<-table.element(a,mean(y))
a<-table.row.end(a)
a<-table.row.start(a)
a<-table.element(a,hyperlink('biased.htm','Biased Variance',''),header=TRUE)
a<-table.element(a,varx)
a<-table.element(a,vary)
a<-table.row.end(a)
a<-table.row.start(a)
a<-table.element(a,hyperlink('biased1.htm','Biased Standard Deviation',''),header=TRUE)
a<-table.element(a,sqrt(varx))
a<-table.element(a,sqrt(vary))
a<-table.row.end(a)
a<-table.row.start(a)
a<-table.element(a,hyperlink('covariance.htm','Covariance',''),header=TRUE)
a<-table.element(a,cov(x,y),2)
a<-table.row.end(a)
a<-table.row.start(a)
a<-table.element(a,hyperlink('pearson_correlation.htm','Correlation',''),header=TRUE)
a<-table.element(a,cxy,2)
a<-table.row.end(a)
a<-table.row.start(a)
a<-table.element(a,hyperlink('coeff_of_determination.htm','Determination',''),header=TRUE)
a<-table.element(a,cxy*cxy,2)
a<-table.row.end(a)
a<-table.row.start(a)
a<-table.element(a,hyperlink('ttest_statistic.htm','T-Test',''),header=TRUE)
a<-table.element(a,as.matrix(corxy$statistic)[1,1],2)
a<-table.row.end(a)
a<-table.row.start(a)
a<-table.element(a,'p-value (2 sided)',header=TRUE)
a<-table.element(a,(p2 <- as.matrix(corxy$p.value)[1,1]),2)
a<-table.row.end(a)
a<-table.row.start(a)
a<-table.element(a,'p-value (1 sided)',header=TRUE)
a<-table.element(a,p2/2,2)
a<-table.row.end(a)
a<-table.row.start(a)
a<-table.element(a,'Degrees of Freedom',header=TRUE)
a<-table.element(a,lx-2,2)
a<-table.row.end(a)
a<-table.row.start(a)
a<-table.element(a,'Number of Observations',header=TRUE)
a<-table.element(a,lx,2)
a<-table.row.end(a)
a<-table.end(a)
table.save(a,file='mytable.tab')