Free Statistics

of Irreproducible Research!

Author's title

Author*Unverified author*
R Software Modulerwasp_percentiles.wasp
Title produced by softwarePercentiles
Date of computationMon, 20 Oct 2008 17:12:30 -0600
Cite this page as followsStatistical Computations at FreeStatistics.org, Office for Research Development and Education, URL https://freestatistics.org/blog/index.php?v=date/2008/Oct/21/t1224544385laxf0btuhsx5z5k.htm/, Retrieved Sun, 19 May 2024 19:18:52 +0000
Statistical Computations at FreeStatistics.org, Office for Research Development and Education, URL https://freestatistics.org/blog/index.php?pk=18297, Retrieved Sun, 19 May 2024 19:18:52 +0000
QR Codes:

Original text written by user:
IsPrivate?No (this computation is public)
User-defined keywords
Estimated Impact137
Family? (F = Feedback message, R = changed R code, M = changed R Module, P = changed Parameters, D = changed Data)
F       [Percentiles] [Q6 P(a)] [2008-10-20 23:12:30] [7957bb37a64ed417bbed8444b0b0ea8a] [Current]
Feedback Forum
2008-10-25 11:50:20 [Kim Huysmans] [reply
Je hebt er een korte en bondige uitleg bijgezet. Maar je had ter verduidelijking er nog kunnen bijzetten dat er dus 80% kans is dat de waarde van de totale productie tussen de 89,8900 (eerste kolom bij waarde 0,1) en 111,6700 (eerste kolom bij waarde 0,9)zal liggen. Zoals je bij Q7 wel gedaan hebt.
2008-10-26 10:34:50 [Bonifer Spillemaeckers] [reply
Zoals Kim hierboven zegt, had je inderdaad de betekenis van het betrouwbaarheidsinterval iets meer kunnen toelichten.
2008-10-27 18:10:35 [Evelyn Ongena] [reply
Wat je zegt is juist, maar zoals al enkele keren is vermeld zou je het betrouwbaarheidsinterval een beetje kunnen toelichten hebben.
  2008-10-27 19:42:01 [Yara Van Overstraeten] [reply
De gevonden berekeningen zijn correct. Je had inderdaad zoals in vraag Q7 de gevonden waarden kunnen verklaren. Je had misschien ook bij de vorige vragen (Q1-Q5) een link kunnen zetten, dit maakt het gemakkelijker om feedback te geven.

Post a new message
Dataseries X:
110,40
96,40
101,90
106,20
81,00
94,70
101,00
109,40
102,30
90,70
96,20
96,10
106,00
103,10
102,00
104,70
86,00
92,10
106,90
112,60
101,70
92,00
97,40
97,00
105,40
102,70
98,10
104,50
87,40
89,90
109,80
111,70
98,60
96,90
95,10
97,00
112,70
102,90
97,40
111,40
87,40
96,80
114,10
110,30
103,90
101,60
94,60
95,90
104,70
102,80
98,10
113,90
80,90
95,70
113,20
105,90
108,80
102,30
99,00
100,70
115,50


Summary of computational transaction
Raw Inputview raw input (R code)
Raw Outputview raw output of R engine
Computing time3 seconds
R Server'George Udny Yule' @ 72.249.76.132

\begin{tabular}{lllllllll}
\hline
Summary of computational transaction \tabularnewline
Raw Input & view raw input (R code)  \tabularnewline
Raw Output & view raw output of R engine  \tabularnewline
Computing time & 3 seconds \tabularnewline
R Server & 'George Udny Yule' @ 72.249.76.132 \tabularnewline
\hline
\end{tabular}
%Source: https://freestatistics.org/blog/index.php?pk=18297&T=0

[TABLE]
[ROW][C]Summary of computational transaction[/C][/ROW]
[ROW][C]Raw Input[/C][C]view raw input (R code) [/C][/ROW]
[ROW][C]Raw Output[/C][C]view raw output of R engine [/C][/ROW]
[ROW][C]Computing time[/C][C]3 seconds[/C][/ROW]
[ROW][C]R Server[/C][C]'George Udny Yule' @ 72.249.76.132[/C][/ROW]
[/TABLE]
Source: https://freestatistics.org/blog/index.php?pk=18297&T=0

Globally Unique Identifier (entire table): ba.freestatistics.org/blog/index.php?pk=18297&T=0

As an alternative you can also use a QR Code:  

The GUIDs for individual cells are displayed in the table below:

Summary of computational transaction
Raw Inputview raw input (R code)
Raw Outputview raw output of R engine
Computing time3 seconds
R Server'George Udny Yule' @ 72.249.76.132


Percentiles - Ungrouped Data
pWeighted Average at XnpWeighted Average at X(n+1)pEmpirical Distribution FunctionEmpirical Distribution Function - AveragingEmpirical Distribution Function - InterpolationClosest ObservationTrue Basic - Statistics Graphics ToolkitMS Excel (old versions)
0.0280.92280.92481818280.980.97680.9
0.0483.283.4868686.568183.681
0.0686.92487.00887.487.487.487.486.39287.4
0.0887.487.487.487.489.487.487.487.4
0.189.9890.0690.790.790.789.990.5489.9
0.1291.11691.272929292.0290.791.42890.7
0.1492.05492.06892.192.193.192.192.03292.1
0.169494.494.694.694.6694.692.394.6
0.1894.69894.76494.794.795.0294.795.03694.7
0.295.2295.3495.795.795.795.195.4695.1
0.2295.78495.82895.995.995.9495.795.77295.9
0.2496.02896.07696.196.196.1496.195.92496.1
0.2696.18696.22496.296.296.3296.296.37696.2
0.2896.43296.54496.896.896.7296.496.65696.4
0.396.8396.8696.996.996.996.896.8496.9
0.3296.95296.9849797979796.91697
0.349797.032979797.169797.36897
0.3697.38497.497.497.497.497.497.497.4
0.3897.52697.79298.198.197.9697.497.70898.1
0.498.198.198.198.198.198.198.198.1
0.4298.4198.61698.698.698.6898.698.98498.6
0.4498.93699.476999999.6899100.22499
0.46100.718100.856101101100.88100.7100.844101
0.48101.168101.456101.6101.6101.48101101.144101.6
0.5101.65101.7101.7101.7101.7101.7101.7101.7
0.52101.844101.924101.9101.9101.92101.9101.976101.9
0.54101.994102.144102102102.12102102.156102
0.56102.3102.3102.3102.3102.3102.3102.3102.3
0.58102.452102.684102.7102.7102.62102.3102.316102.7
0.6102.76102.82102.8102.8102.8102.8102.88102.8
0.62102.882102.988102.9102.9102.94102.9103.012102.9
0.64103.132103.644103.9103.9103.42103.1103.356103.9
0.66104.056104.452104.5104.5104.26103.9103.948104.5
0.68104.596104.7104.7104.7104.66104.5104.7104.7
0.7104.7104.98104.7104.7104.7104.7105.12104.7
0.72105.344105.72105.4105.4105.5105.4105.58105.9
0.74105.914105.988106106105.94105.9105.912106
0.76106.072106.284106.2106.2106.12106106.816106.2
0.78106.606107.584106.9106.9106.76106.9108.116106.9
0.8108.42109.16108.8108.8108.8108.8109.04109.4
0.82109.408109.736109.8109.8109.48109.4109.464109.8
0.84109.92110.308110.3110.3110109.8110.392110.3
0.86110.346110.72110.4110.4110.36110.3111.08110.4
0.88111.08111.568111.4111.4111.2111.4111.532111.7
0.9111.67112.42111.7111.7111.7111.7111.88112.6
0.92112.612112.72112.7112.7112.62112.6113.18112.7
0.94112.87113.396113.2113.2112.9112.7113.704113.2
0.96113.592114.004113.9113.9113.62113.9113.996114.1
0.98114.056115.164114.1114.1114.06114.1114.436115.5

\begin{tabular}{lllllllll}
\hline
Percentiles - Ungrouped Data \tabularnewline
p & Weighted Average at Xnp & Weighted Average at X(n+1)p & Empirical Distribution Function & Empirical Distribution Function - Averaging & Empirical Distribution Function - Interpolation & Closest Observation & True Basic - Statistics Graphics Toolkit & MS Excel (old versions) \tabularnewline
0.02 & 80.922 & 80.924 & 81 & 81 & 82 & 80.9 & 80.976 & 80.9 \tabularnewline
0.04 & 83.2 & 83.4 & 86 & 86 & 86.56 & 81 & 83.6 & 81 \tabularnewline
0.06 & 86.924 & 87.008 & 87.4 & 87.4 & 87.4 & 87.4 & 86.392 & 87.4 \tabularnewline
0.08 & 87.4 & 87.4 & 87.4 & 87.4 & 89.4 & 87.4 & 87.4 & 87.4 \tabularnewline
0.1 & 89.98 & 90.06 & 90.7 & 90.7 & 90.7 & 89.9 & 90.54 & 89.9 \tabularnewline
0.12 & 91.116 & 91.272 & 92 & 92 & 92.02 & 90.7 & 91.428 & 90.7 \tabularnewline
0.14 & 92.054 & 92.068 & 92.1 & 92.1 & 93.1 & 92.1 & 92.032 & 92.1 \tabularnewline
0.16 & 94 & 94.4 & 94.6 & 94.6 & 94.66 & 94.6 & 92.3 & 94.6 \tabularnewline
0.18 & 94.698 & 94.764 & 94.7 & 94.7 & 95.02 & 94.7 & 95.036 & 94.7 \tabularnewline
0.2 & 95.22 & 95.34 & 95.7 & 95.7 & 95.7 & 95.1 & 95.46 & 95.1 \tabularnewline
0.22 & 95.784 & 95.828 & 95.9 & 95.9 & 95.94 & 95.7 & 95.772 & 95.9 \tabularnewline
0.24 & 96.028 & 96.076 & 96.1 & 96.1 & 96.14 & 96.1 & 95.924 & 96.1 \tabularnewline
0.26 & 96.186 & 96.224 & 96.2 & 96.2 & 96.32 & 96.2 & 96.376 & 96.2 \tabularnewline
0.28 & 96.432 & 96.544 & 96.8 & 96.8 & 96.72 & 96.4 & 96.656 & 96.4 \tabularnewline
0.3 & 96.83 & 96.86 & 96.9 & 96.9 & 96.9 & 96.8 & 96.84 & 96.9 \tabularnewline
0.32 & 96.952 & 96.984 & 97 & 97 & 97 & 97 & 96.916 & 97 \tabularnewline
0.34 & 97 & 97.032 & 97 & 97 & 97.16 & 97 & 97.368 & 97 \tabularnewline
0.36 & 97.384 & 97.4 & 97.4 & 97.4 & 97.4 & 97.4 & 97.4 & 97.4 \tabularnewline
0.38 & 97.526 & 97.792 & 98.1 & 98.1 & 97.96 & 97.4 & 97.708 & 98.1 \tabularnewline
0.4 & 98.1 & 98.1 & 98.1 & 98.1 & 98.1 & 98.1 & 98.1 & 98.1 \tabularnewline
0.42 & 98.41 & 98.616 & 98.6 & 98.6 & 98.68 & 98.6 & 98.984 & 98.6 \tabularnewline
0.44 & 98.936 & 99.476 & 99 & 99 & 99.68 & 99 & 100.224 & 99 \tabularnewline
0.46 & 100.718 & 100.856 & 101 & 101 & 100.88 & 100.7 & 100.844 & 101 \tabularnewline
0.48 & 101.168 & 101.456 & 101.6 & 101.6 & 101.48 & 101 & 101.144 & 101.6 \tabularnewline
0.5 & 101.65 & 101.7 & 101.7 & 101.7 & 101.7 & 101.7 & 101.7 & 101.7 \tabularnewline
0.52 & 101.844 & 101.924 & 101.9 & 101.9 & 101.92 & 101.9 & 101.976 & 101.9 \tabularnewline
0.54 & 101.994 & 102.144 & 102 & 102 & 102.12 & 102 & 102.156 & 102 \tabularnewline
0.56 & 102.3 & 102.3 & 102.3 & 102.3 & 102.3 & 102.3 & 102.3 & 102.3 \tabularnewline
0.58 & 102.452 & 102.684 & 102.7 & 102.7 & 102.62 & 102.3 & 102.316 & 102.7 \tabularnewline
0.6 & 102.76 & 102.82 & 102.8 & 102.8 & 102.8 & 102.8 & 102.88 & 102.8 \tabularnewline
0.62 & 102.882 & 102.988 & 102.9 & 102.9 & 102.94 & 102.9 & 103.012 & 102.9 \tabularnewline
0.64 & 103.132 & 103.644 & 103.9 & 103.9 & 103.42 & 103.1 & 103.356 & 103.9 \tabularnewline
0.66 & 104.056 & 104.452 & 104.5 & 104.5 & 104.26 & 103.9 & 103.948 & 104.5 \tabularnewline
0.68 & 104.596 & 104.7 & 104.7 & 104.7 & 104.66 & 104.5 & 104.7 & 104.7 \tabularnewline
0.7 & 104.7 & 104.98 & 104.7 & 104.7 & 104.7 & 104.7 & 105.12 & 104.7 \tabularnewline
0.72 & 105.344 & 105.72 & 105.4 & 105.4 & 105.5 & 105.4 & 105.58 & 105.9 \tabularnewline
0.74 & 105.914 & 105.988 & 106 & 106 & 105.94 & 105.9 & 105.912 & 106 \tabularnewline
0.76 & 106.072 & 106.284 & 106.2 & 106.2 & 106.12 & 106 & 106.816 & 106.2 \tabularnewline
0.78 & 106.606 & 107.584 & 106.9 & 106.9 & 106.76 & 106.9 & 108.116 & 106.9 \tabularnewline
0.8 & 108.42 & 109.16 & 108.8 & 108.8 & 108.8 & 108.8 & 109.04 & 109.4 \tabularnewline
0.82 & 109.408 & 109.736 & 109.8 & 109.8 & 109.48 & 109.4 & 109.464 & 109.8 \tabularnewline
0.84 & 109.92 & 110.308 & 110.3 & 110.3 & 110 & 109.8 & 110.392 & 110.3 \tabularnewline
0.86 & 110.346 & 110.72 & 110.4 & 110.4 & 110.36 & 110.3 & 111.08 & 110.4 \tabularnewline
0.88 & 111.08 & 111.568 & 111.4 & 111.4 & 111.2 & 111.4 & 111.532 & 111.7 \tabularnewline
0.9 & 111.67 & 112.42 & 111.7 & 111.7 & 111.7 & 111.7 & 111.88 & 112.6 \tabularnewline
0.92 & 112.612 & 112.72 & 112.7 & 112.7 & 112.62 & 112.6 & 113.18 & 112.7 \tabularnewline
0.94 & 112.87 & 113.396 & 113.2 & 113.2 & 112.9 & 112.7 & 113.704 & 113.2 \tabularnewline
0.96 & 113.592 & 114.004 & 113.9 & 113.9 & 113.62 & 113.9 & 113.996 & 114.1 \tabularnewline
0.98 & 114.056 & 115.164 & 114.1 & 114.1 & 114.06 & 114.1 & 114.436 & 115.5 \tabularnewline
\hline
\end{tabular}
%Source: https://freestatistics.org/blog/index.php?pk=18297&T=1

[TABLE]
[ROW][C]Percentiles - Ungrouped Data[/C][/ROW]
[ROW][C]p[/C][C]Weighted Average at Xnp[/C][C]Weighted Average at X(n+1)p[/C][C]Empirical Distribution Function[/C][C]Empirical Distribution Function - Averaging[/C][C]Empirical Distribution Function - Interpolation[/C][C]Closest Observation[/C][C]True Basic - Statistics Graphics Toolkit[/C][C]MS Excel (old versions)[/C][/ROW]
[ROW][C]0.02[/C][C]80.922[/C][C]80.924[/C][C]81[/C][C]81[/C][C]82[/C][C]80.9[/C][C]80.976[/C][C]80.9[/C][/ROW]
[ROW][C]0.04[/C][C]83.2[/C][C]83.4[/C][C]86[/C][C]86[/C][C]86.56[/C][C]81[/C][C]83.6[/C][C]81[/C][/ROW]
[ROW][C]0.06[/C][C]86.924[/C][C]87.008[/C][C]87.4[/C][C]87.4[/C][C]87.4[/C][C]87.4[/C][C]86.392[/C][C]87.4[/C][/ROW]
[ROW][C]0.08[/C][C]87.4[/C][C]87.4[/C][C]87.4[/C][C]87.4[/C][C]89.4[/C][C]87.4[/C][C]87.4[/C][C]87.4[/C][/ROW]
[ROW][C]0.1[/C][C]89.98[/C][C]90.06[/C][C]90.7[/C][C]90.7[/C][C]90.7[/C][C]89.9[/C][C]90.54[/C][C]89.9[/C][/ROW]
[ROW][C]0.12[/C][C]91.116[/C][C]91.272[/C][C]92[/C][C]92[/C][C]92.02[/C][C]90.7[/C][C]91.428[/C][C]90.7[/C][/ROW]
[ROW][C]0.14[/C][C]92.054[/C][C]92.068[/C][C]92.1[/C][C]92.1[/C][C]93.1[/C][C]92.1[/C][C]92.032[/C][C]92.1[/C][/ROW]
[ROW][C]0.16[/C][C]94[/C][C]94.4[/C][C]94.6[/C][C]94.6[/C][C]94.66[/C][C]94.6[/C][C]92.3[/C][C]94.6[/C][/ROW]
[ROW][C]0.18[/C][C]94.698[/C][C]94.764[/C][C]94.7[/C][C]94.7[/C][C]95.02[/C][C]94.7[/C][C]95.036[/C][C]94.7[/C][/ROW]
[ROW][C]0.2[/C][C]95.22[/C][C]95.34[/C][C]95.7[/C][C]95.7[/C][C]95.7[/C][C]95.1[/C][C]95.46[/C][C]95.1[/C][/ROW]
[ROW][C]0.22[/C][C]95.784[/C][C]95.828[/C][C]95.9[/C][C]95.9[/C][C]95.94[/C][C]95.7[/C][C]95.772[/C][C]95.9[/C][/ROW]
[ROW][C]0.24[/C][C]96.028[/C][C]96.076[/C][C]96.1[/C][C]96.1[/C][C]96.14[/C][C]96.1[/C][C]95.924[/C][C]96.1[/C][/ROW]
[ROW][C]0.26[/C][C]96.186[/C][C]96.224[/C][C]96.2[/C][C]96.2[/C][C]96.32[/C][C]96.2[/C][C]96.376[/C][C]96.2[/C][/ROW]
[ROW][C]0.28[/C][C]96.432[/C][C]96.544[/C][C]96.8[/C][C]96.8[/C][C]96.72[/C][C]96.4[/C][C]96.656[/C][C]96.4[/C][/ROW]
[ROW][C]0.3[/C][C]96.83[/C][C]96.86[/C][C]96.9[/C][C]96.9[/C][C]96.9[/C][C]96.8[/C][C]96.84[/C][C]96.9[/C][/ROW]
[ROW][C]0.32[/C][C]96.952[/C][C]96.984[/C][C]97[/C][C]97[/C][C]97[/C][C]97[/C][C]96.916[/C][C]97[/C][/ROW]
[ROW][C]0.34[/C][C]97[/C][C]97.032[/C][C]97[/C][C]97[/C][C]97.16[/C][C]97[/C][C]97.368[/C][C]97[/C][/ROW]
[ROW][C]0.36[/C][C]97.384[/C][C]97.4[/C][C]97.4[/C][C]97.4[/C][C]97.4[/C][C]97.4[/C][C]97.4[/C][C]97.4[/C][/ROW]
[ROW][C]0.38[/C][C]97.526[/C][C]97.792[/C][C]98.1[/C][C]98.1[/C][C]97.96[/C][C]97.4[/C][C]97.708[/C][C]98.1[/C][/ROW]
[ROW][C]0.4[/C][C]98.1[/C][C]98.1[/C][C]98.1[/C][C]98.1[/C][C]98.1[/C][C]98.1[/C][C]98.1[/C][C]98.1[/C][/ROW]
[ROW][C]0.42[/C][C]98.41[/C][C]98.616[/C][C]98.6[/C][C]98.6[/C][C]98.68[/C][C]98.6[/C][C]98.984[/C][C]98.6[/C][/ROW]
[ROW][C]0.44[/C][C]98.936[/C][C]99.476[/C][C]99[/C][C]99[/C][C]99.68[/C][C]99[/C][C]100.224[/C][C]99[/C][/ROW]
[ROW][C]0.46[/C][C]100.718[/C][C]100.856[/C][C]101[/C][C]101[/C][C]100.88[/C][C]100.7[/C][C]100.844[/C][C]101[/C][/ROW]
[ROW][C]0.48[/C][C]101.168[/C][C]101.456[/C][C]101.6[/C][C]101.6[/C][C]101.48[/C][C]101[/C][C]101.144[/C][C]101.6[/C][/ROW]
[ROW][C]0.5[/C][C]101.65[/C][C]101.7[/C][C]101.7[/C][C]101.7[/C][C]101.7[/C][C]101.7[/C][C]101.7[/C][C]101.7[/C][/ROW]
[ROW][C]0.52[/C][C]101.844[/C][C]101.924[/C][C]101.9[/C][C]101.9[/C][C]101.92[/C][C]101.9[/C][C]101.976[/C][C]101.9[/C][/ROW]
[ROW][C]0.54[/C][C]101.994[/C][C]102.144[/C][C]102[/C][C]102[/C][C]102.12[/C][C]102[/C][C]102.156[/C][C]102[/C][/ROW]
[ROW][C]0.56[/C][C]102.3[/C][C]102.3[/C][C]102.3[/C][C]102.3[/C][C]102.3[/C][C]102.3[/C][C]102.3[/C][C]102.3[/C][/ROW]
[ROW][C]0.58[/C][C]102.452[/C][C]102.684[/C][C]102.7[/C][C]102.7[/C][C]102.62[/C][C]102.3[/C][C]102.316[/C][C]102.7[/C][/ROW]
[ROW][C]0.6[/C][C]102.76[/C][C]102.82[/C][C]102.8[/C][C]102.8[/C][C]102.8[/C][C]102.8[/C][C]102.88[/C][C]102.8[/C][/ROW]
[ROW][C]0.62[/C][C]102.882[/C][C]102.988[/C][C]102.9[/C][C]102.9[/C][C]102.94[/C][C]102.9[/C][C]103.012[/C][C]102.9[/C][/ROW]
[ROW][C]0.64[/C][C]103.132[/C][C]103.644[/C][C]103.9[/C][C]103.9[/C][C]103.42[/C][C]103.1[/C][C]103.356[/C][C]103.9[/C][/ROW]
[ROW][C]0.66[/C][C]104.056[/C][C]104.452[/C][C]104.5[/C][C]104.5[/C][C]104.26[/C][C]103.9[/C][C]103.948[/C][C]104.5[/C][/ROW]
[ROW][C]0.68[/C][C]104.596[/C][C]104.7[/C][C]104.7[/C][C]104.7[/C][C]104.66[/C][C]104.5[/C][C]104.7[/C][C]104.7[/C][/ROW]
[ROW][C]0.7[/C][C]104.7[/C][C]104.98[/C][C]104.7[/C][C]104.7[/C][C]104.7[/C][C]104.7[/C][C]105.12[/C][C]104.7[/C][/ROW]
[ROW][C]0.72[/C][C]105.344[/C][C]105.72[/C][C]105.4[/C][C]105.4[/C][C]105.5[/C][C]105.4[/C][C]105.58[/C][C]105.9[/C][/ROW]
[ROW][C]0.74[/C][C]105.914[/C][C]105.988[/C][C]106[/C][C]106[/C][C]105.94[/C][C]105.9[/C][C]105.912[/C][C]106[/C][/ROW]
[ROW][C]0.76[/C][C]106.072[/C][C]106.284[/C][C]106.2[/C][C]106.2[/C][C]106.12[/C][C]106[/C][C]106.816[/C][C]106.2[/C][/ROW]
[ROW][C]0.78[/C][C]106.606[/C][C]107.584[/C][C]106.9[/C][C]106.9[/C][C]106.76[/C][C]106.9[/C][C]108.116[/C][C]106.9[/C][/ROW]
[ROW][C]0.8[/C][C]108.42[/C][C]109.16[/C][C]108.8[/C][C]108.8[/C][C]108.8[/C][C]108.8[/C][C]109.04[/C][C]109.4[/C][/ROW]
[ROW][C]0.82[/C][C]109.408[/C][C]109.736[/C][C]109.8[/C][C]109.8[/C][C]109.48[/C][C]109.4[/C][C]109.464[/C][C]109.8[/C][/ROW]
[ROW][C]0.84[/C][C]109.92[/C][C]110.308[/C][C]110.3[/C][C]110.3[/C][C]110[/C][C]109.8[/C][C]110.392[/C][C]110.3[/C][/ROW]
[ROW][C]0.86[/C][C]110.346[/C][C]110.72[/C][C]110.4[/C][C]110.4[/C][C]110.36[/C][C]110.3[/C][C]111.08[/C][C]110.4[/C][/ROW]
[ROW][C]0.88[/C][C]111.08[/C][C]111.568[/C][C]111.4[/C][C]111.4[/C][C]111.2[/C][C]111.4[/C][C]111.532[/C][C]111.7[/C][/ROW]
[ROW][C]0.9[/C][C]111.67[/C][C]112.42[/C][C]111.7[/C][C]111.7[/C][C]111.7[/C][C]111.7[/C][C]111.88[/C][C]112.6[/C][/ROW]
[ROW][C]0.92[/C][C]112.612[/C][C]112.72[/C][C]112.7[/C][C]112.7[/C][C]112.62[/C][C]112.6[/C][C]113.18[/C][C]112.7[/C][/ROW]
[ROW][C]0.94[/C][C]112.87[/C][C]113.396[/C][C]113.2[/C][C]113.2[/C][C]112.9[/C][C]112.7[/C][C]113.704[/C][C]113.2[/C][/ROW]
[ROW][C]0.96[/C][C]113.592[/C][C]114.004[/C][C]113.9[/C][C]113.9[/C][C]113.62[/C][C]113.9[/C][C]113.996[/C][C]114.1[/C][/ROW]
[ROW][C]0.98[/C][C]114.056[/C][C]115.164[/C][C]114.1[/C][C]114.1[/C][C]114.06[/C][C]114.1[/C][C]114.436[/C][C]115.5[/C][/ROW]
[/TABLE]
Source: https://freestatistics.org/blog/index.php?pk=18297&T=1

Globally Unique Identifier (entire table): ba.freestatistics.org/blog/index.php?pk=18297&T=1

As an alternative you can also use a QR Code:  

The GUIDs for individual cells are displayed in the table below:

Percentiles - Ungrouped Data
pWeighted Average at XnpWeighted Average at X(n+1)pEmpirical Distribution FunctionEmpirical Distribution Function - AveragingEmpirical Distribution Function - InterpolationClosest ObservationTrue Basic - Statistics Graphics ToolkitMS Excel (old versions)
0.0280.92280.92481818280.980.97680.9
0.0483.283.4868686.568183.681
0.0686.92487.00887.487.487.487.486.39287.4
0.0887.487.487.487.489.487.487.487.4
0.189.9890.0690.790.790.789.990.5489.9
0.1291.11691.272929292.0290.791.42890.7
0.1492.05492.06892.192.193.192.192.03292.1
0.169494.494.694.694.6694.692.394.6
0.1894.69894.76494.794.795.0294.795.03694.7
0.295.2295.3495.795.795.795.195.4695.1
0.2295.78495.82895.995.995.9495.795.77295.9
0.2496.02896.07696.196.196.1496.195.92496.1
0.2696.18696.22496.296.296.3296.296.37696.2
0.2896.43296.54496.896.896.7296.496.65696.4
0.396.8396.8696.996.996.996.896.8496.9
0.3296.95296.9849797979796.91697
0.349797.032979797.169797.36897
0.3697.38497.497.497.497.497.497.497.4
0.3897.52697.79298.198.197.9697.497.70898.1
0.498.198.198.198.198.198.198.198.1
0.4298.4198.61698.698.698.6898.698.98498.6
0.4498.93699.476999999.6899100.22499
0.46100.718100.856101101100.88100.7100.844101
0.48101.168101.456101.6101.6101.48101101.144101.6
0.5101.65101.7101.7101.7101.7101.7101.7101.7
0.52101.844101.924101.9101.9101.92101.9101.976101.9
0.54101.994102.144102102102.12102102.156102
0.56102.3102.3102.3102.3102.3102.3102.3102.3
0.58102.452102.684102.7102.7102.62102.3102.316102.7
0.6102.76102.82102.8102.8102.8102.8102.88102.8
0.62102.882102.988102.9102.9102.94102.9103.012102.9
0.64103.132103.644103.9103.9103.42103.1103.356103.9
0.66104.056104.452104.5104.5104.26103.9103.948104.5
0.68104.596104.7104.7104.7104.66104.5104.7104.7
0.7104.7104.98104.7104.7104.7104.7105.12104.7
0.72105.344105.72105.4105.4105.5105.4105.58105.9
0.74105.914105.988106106105.94105.9105.912106
0.76106.072106.284106.2106.2106.12106106.816106.2
0.78106.606107.584106.9106.9106.76106.9108.116106.9
0.8108.42109.16108.8108.8108.8108.8109.04109.4
0.82109.408109.736109.8109.8109.48109.4109.464109.8
0.84109.92110.308110.3110.3110109.8110.392110.3
0.86110.346110.72110.4110.4110.36110.3111.08110.4
0.88111.08111.568111.4111.4111.2111.4111.532111.7
0.9111.67112.42111.7111.7111.7111.7111.88112.6
0.92112.612112.72112.7112.7112.62112.6113.18112.7
0.94112.87113.396113.2113.2112.9112.7113.704113.2
0.96113.592114.004113.9113.9113.62113.9113.996114.1
0.98114.056115.164114.1114.1114.06114.1114.436115.5


Parameters (Session):
Parameters (R input):
R code (references can be found in the software module):
x <-sort(x[!is.na(x)])
q1 <- function(data,n,p,i,f) {
np <- n*p;
i <<- floor(np)
f <<- np - i
qvalue <- (1-f)*data[i] + f*data[i+1]
}
q2 <- function(data,n,p,i,f) {
np <- (n+1)*p
i <<- floor(np)
f <<- np - i
qvalue <- (1-f)*data[i] + f*data[i+1]
}
q3 <- function(data,n,p,i,f) {
np <- n*p
i <<- floor(np)
f <<- np - i
if (f==0) {
qvalue <- data[i]
} else {
qvalue <- data[i+1]
}
}
q4 <- function(data,n,p,i,f) {
np <- n*p
i <<- floor(np)
f <<- np - i
if (f==0) {
qvalue <- (data[i]+data[i+1])/2
} else {
qvalue <- data[i+1]
}
}
q5 <- function(data,n,p,i,f) {
np <- (n-1)*p
i <<- floor(np)
f <<- np - i
if (f==0) {
qvalue <- data[i+1]
} else {
qvalue <- data[i+1] + f*(data[i+2]-data[i+1])
}
}
q6 <- function(data,n,p,i,f) {
np <- n*p+0.5
i <<- floor(np)
f <<- np - i
qvalue <- data[i]
}
q7 <- function(data,n,p,i,f) {
np <- (n+1)*p
i <<- floor(np)
f <<- np - i
if (f==0) {
qvalue <- data[i]
} else {
qvalue <- f*data[i] + (1-f)*data[i+1]
}
}
q8 <- function(data,n,p,i,f) {
np <- (n+1)*p
i <<- floor(np)
f <<- np - i
if (f==0) {
qvalue <- data[i]
} else {
if (f == 0.5) {
qvalue <- (data[i]+data[i+1])/2
} else {
if (f < 0.5) {
qvalue <- data[i]
} else {
qvalue <- data[i+1]
}
}
}
}
lx <- length(x)
qval <- array(NA,dim=c(99,8))
mystep <- 25
mystart <- 25
if (lx>10){
mystep=10
mystart=10
}
if (lx>20){
mystep=5
mystart=5
}
if (lx>50){
mystep=2
mystart=2
}
if (lx>=100){
mystep=1
mystart=1
}
for (perc in seq(mystart,99,mystep)) {
qval[perc,1] <- q1(x,lx,perc/100,i,f)
qval[perc,2] <- q2(x,lx,perc/100,i,f)
qval[perc,3] <- q3(x,lx,perc/100,i,f)
qval[perc,4] <- q4(x,lx,perc/100,i,f)
qval[perc,5] <- q5(x,lx,perc/100,i,f)
qval[perc,6] <- q6(x,lx,perc/100,i,f)
qval[perc,7] <- q7(x,lx,perc/100,i,f)
qval[perc,8] <- q8(x,lx,perc/100,i,f)
}
bitmap(file='test1.png')
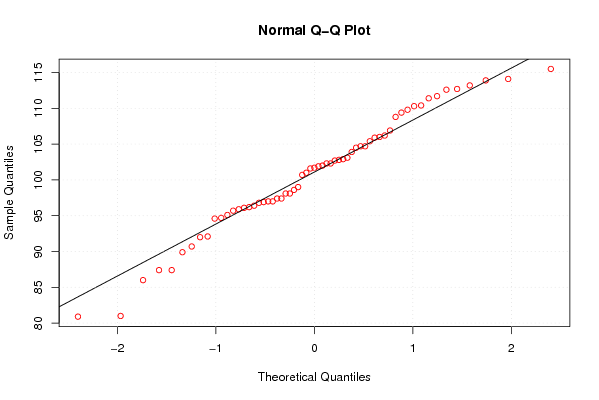
myqqnorm <- qqnorm(x,col=2)
qqline(x)
grid()
dev.off()
load(file='createtable')
a<-table.start()
a<-table.row.start(a)
a<-table.element(a,'Percentiles - Ungrouped Data',9,TRUE)
a<-table.row.end(a)
a<-table.row.start(a)
a<-table.element(a,'p',1,TRUE)
a<-table.element(a,hyperlink('method_1.htm', 'Weighted Average at Xnp',''),1,TRUE)
a<-table.element(a,hyperlink('method_2.htm','Weighted Average at X(n+1)p',''),1,TRUE)
a<-table.element(a,hyperlink('method_3.htm','Empirical Distribution Function',''),1,TRUE)
a<-table.element(a,hyperlink('method_4.htm','Empirical Distribution Function - Averaging',''),1,TRUE)
a<-table.element(a,hyperlink('method_5.htm','Empirical Distribution Function - Interpolation',''),1,TRUE)
a<-table.element(a,hyperlink('method_6.htm','Closest Observation',''),1,TRUE)
a<-table.element(a,hyperlink('method_7.htm','True Basic - Statistics Graphics Toolkit',''),1,TRUE)
a<-table.element(a,hyperlink('method_8.htm','MS Excel (old versions)',''),1,TRUE)
a<-table.row.end(a)
for (perc in seq(mystart,99,mystep)) {
a<-table.row.start(a)
a<-table.element(a,round(perc/100,2),1,TRUE)
for (j in 1:8) {
a<-table.element(a,round(qval[perc,j],6))
}
a<-table.row.end(a)
}
a<-table.end(a)
table.save(a,file='mytable.tab')