Free Statistics

of Irreproducible Research!

Author's title

Author*Unverified author*
R Software Modulerwasp_percentiles.wasp
Title produced by softwarePercentiles
Date of computationMon, 20 Oct 2008 16:55:03 -0600
Cite this page as followsStatistical Computations at FreeStatistics.org, Office for Research Development and Education, URL https://freestatistics.org/blog/index.php?v=date/2008/Oct/21/t12245433338l3fnggpl410oyo.htm/, Retrieved Sun, 19 May 2024 21:02:06 +0000
Statistical Computations at FreeStatistics.org, Office for Research Development and Education, URL https://freestatistics.org/blog/index.php?pk=18286, Retrieved Sun, 19 May 2024 21:02:06 +0000
QR Codes:

Original text written by user:
IsPrivate?No (this computation is public)
User-defined keywords
Estimated Impact137
Family? (F = Feedback message, R = changed R code, M = changed R Module, P = changed Parameters, D = changed Data)
F       [Percentiles] [Percentiles: werk...] [2008-10-20 22:55:03] [7957bb37a64ed417bbed8444b0b0ea8a] [Current]
Feedback Forum
2008-10-27 18:17:07 [Evelyn Ongena] [reply
Je hebt enkel de link in het document vervat, zonder enige uitleg of conclusie wat het moeilijk maakt je hierop te beoordelen.

Post a new message
Dataseries X:
582
552
436
602
640
551
421
382
382
427
542
708
465
474
371
463
515
509
380
313
313
359
427
415
402
388
353
464
429
398
291
272
241
288
365
312
325
346
282
362
369
340
308
294
306
328
351
366
350
356
295
359
380
360
336
299
262
299
313
357
356
368
284
338
352
342
315
277
317
291
326
353
371
356
274
352
347
345
336
276
312
330
325
328
332
341
316
377
380
373
346
272
283
302
301
303
320


Summary of computational transaction
Raw Inputview raw input (R code)
Raw Outputview raw output of R engine
Computing time1 seconds
R Server'Gwilym Jenkins' @ 72.249.127.135

\begin{tabular}{lllllllll}
\hline
Summary of computational transaction \tabularnewline
Raw Input & view raw input (R code)  \tabularnewline
Raw Output & view raw output of R engine  \tabularnewline
Computing time & 1 seconds \tabularnewline
R Server & 'Gwilym Jenkins' @ 72.249.127.135 \tabularnewline
\hline
\end{tabular}
%Source: https://freestatistics.org/blog/index.php?pk=18286&T=0

[TABLE]
[ROW][C]Summary of computational transaction[/C][/ROW]
[ROW][C]Raw Input[/C][C]view raw input (R code) [/C][/ROW]
[ROW][C]Raw Output[/C][C]view raw output of R engine [/C][/ROW]
[ROW][C]Computing time[/C][C]1 seconds[/C][/ROW]
[ROW][C]R Server[/C][C]'Gwilym Jenkins' @ 72.249.127.135[/C][/ROW]
[/TABLE]
Source: https://freestatistics.org/blog/index.php?pk=18286&T=0

Globally Unique Identifier (entire table): ba.freestatistics.org/blog/index.php?pk=18286&T=0

As an alternative you can also use a QR Code:  

The GUIDs for individual cells are displayed in the table below:

Summary of computational transaction
Raw Inputview raw input (R code)
Raw Outputview raw output of R engine
Computing time1 seconds
R Server'Gwilym Jenkins' @ 72.249.127.135


Percentiles - Ungrouped Data
pWeighted Average at XnpWeighted Average at X(n+1)pEmpirical Distribution FunctionEmpirical Distribution Function - AveragingEmpirical Distribution Function - InterpolationClosest ObservationTrue Basic - Statistics Graphics ToolkitMS Excel (old versions)
0.02260.74261.16262262271.2262241.84262
0.04272272272272273.68272272272
0.06275.64275.76276276276.76276274.24276
0.08280.8281.2282282282.68282277.8282
0.1283.7283.8284284286.4284283.2284
0.12289.92290.28291291291291288.72291
0.14292.74293.16294294294.44294291.84294
0.16297.08297.72299299299299296.28299
0.18299.92300.28301301301.28299299.72301
0.2302.4302.6303303303.6302302.4303
0.22306.68307.12308308308.48306306.88308
0.24312312312312312.04312312312
0.26313313313313313313313313
0.28313.32313.88315315314.76313314.12313
0.3316.1316.4317317316.8316316.6316
0.32320.2321.8325325323.6320323.2320
0.34325325.32325325325.64325325.68325
0.36327.84328328328328328328328
0.38329.72330.48330330330.96330331.52330
0.4335.2336336336336336336336
0.42337.48338.32338338338.64338339.68338
0.44340.68341.12341341341.24341341.88341
0.46343.86345.08345345345.16345345.92345
0.48346346.04346346346.08346346.96346
0.5348.5350350350350350350350
0.52351.44351.96352352351.92351351.04352
0.54352.38352.92353353352.84352352.08353
0.56353.96355.64356356355.28353353.36356
0.58356356356356356356356356
0.6357.4358.6359359358.2357357.4359
0.62359.14359.76360360359.52359359.24360
0.64362.24364.16365365363.32362362.84365
0.66366.04367.36368368366.72366366.64368
0.68368.96370.28369369369.56369369.72371
0.7371372.2371371371.4371371.8373
0.72376.36378.68377377377.36377378.32380
0.74380380380380380380380380
0.76381.44382382382381.92382382382
0.78385.96392.4388388387.28388393.6388
0.8400.4407.2402402401.2402409.8402
0.82418.24423.16421421419.32421424.84421
0.84427427.64427427427427428.36427
0.86431.94443.56436436432.92429455.44436
0.88463.36464.24464464463.48463464.76464
0.9467.7481474474468.6465502474
0.92510.44519.32515515510.92509537.68515
0.94543.62551.12551551544.16542551.88551
0.96555.6583.6582582556.8552600.4582
0.98604.28642.72640640605.04602705.28640

\begin{tabular}{lllllllll}
\hline
Percentiles - Ungrouped Data \tabularnewline
p & Weighted Average at Xnp & Weighted Average at X(n+1)p & Empirical Distribution Function & Empirical Distribution Function - Averaging & Empirical Distribution Function - Interpolation & Closest Observation & True Basic - Statistics Graphics Toolkit & MS Excel (old versions) \tabularnewline
0.02 & 260.74 & 261.16 & 262 & 262 & 271.2 & 262 & 241.84 & 262 \tabularnewline
0.04 & 272 & 272 & 272 & 272 & 273.68 & 272 & 272 & 272 \tabularnewline
0.06 & 275.64 & 275.76 & 276 & 276 & 276.76 & 276 & 274.24 & 276 \tabularnewline
0.08 & 280.8 & 281.2 & 282 & 282 & 282.68 & 282 & 277.8 & 282 \tabularnewline
0.1 & 283.7 & 283.8 & 284 & 284 & 286.4 & 284 & 283.2 & 284 \tabularnewline
0.12 & 289.92 & 290.28 & 291 & 291 & 291 & 291 & 288.72 & 291 \tabularnewline
0.14 & 292.74 & 293.16 & 294 & 294 & 294.44 & 294 & 291.84 & 294 \tabularnewline
0.16 & 297.08 & 297.72 & 299 & 299 & 299 & 299 & 296.28 & 299 \tabularnewline
0.18 & 299.92 & 300.28 & 301 & 301 & 301.28 & 299 & 299.72 & 301 \tabularnewline
0.2 & 302.4 & 302.6 & 303 & 303 & 303.6 & 302 & 302.4 & 303 \tabularnewline
0.22 & 306.68 & 307.12 & 308 & 308 & 308.48 & 306 & 306.88 & 308 \tabularnewline
0.24 & 312 & 312 & 312 & 312 & 312.04 & 312 & 312 & 312 \tabularnewline
0.26 & 313 & 313 & 313 & 313 & 313 & 313 & 313 & 313 \tabularnewline
0.28 & 313.32 & 313.88 & 315 & 315 & 314.76 & 313 & 314.12 & 313 \tabularnewline
0.3 & 316.1 & 316.4 & 317 & 317 & 316.8 & 316 & 316.6 & 316 \tabularnewline
0.32 & 320.2 & 321.8 & 325 & 325 & 323.6 & 320 & 323.2 & 320 \tabularnewline
0.34 & 325 & 325.32 & 325 & 325 & 325.64 & 325 & 325.68 & 325 \tabularnewline
0.36 & 327.84 & 328 & 328 & 328 & 328 & 328 & 328 & 328 \tabularnewline
0.38 & 329.72 & 330.48 & 330 & 330 & 330.96 & 330 & 331.52 & 330 \tabularnewline
0.4 & 335.2 & 336 & 336 & 336 & 336 & 336 & 336 & 336 \tabularnewline
0.42 & 337.48 & 338.32 & 338 & 338 & 338.64 & 338 & 339.68 & 338 \tabularnewline
0.44 & 340.68 & 341.12 & 341 & 341 & 341.24 & 341 & 341.88 & 341 \tabularnewline
0.46 & 343.86 & 345.08 & 345 & 345 & 345.16 & 345 & 345.92 & 345 \tabularnewline
0.48 & 346 & 346.04 & 346 & 346 & 346.08 & 346 & 346.96 & 346 \tabularnewline
0.5 & 348.5 & 350 & 350 & 350 & 350 & 350 & 350 & 350 \tabularnewline
0.52 & 351.44 & 351.96 & 352 & 352 & 351.92 & 351 & 351.04 & 352 \tabularnewline
0.54 & 352.38 & 352.92 & 353 & 353 & 352.84 & 352 & 352.08 & 353 \tabularnewline
0.56 & 353.96 & 355.64 & 356 & 356 & 355.28 & 353 & 353.36 & 356 \tabularnewline
0.58 & 356 & 356 & 356 & 356 & 356 & 356 & 356 & 356 \tabularnewline
0.6 & 357.4 & 358.6 & 359 & 359 & 358.2 & 357 & 357.4 & 359 \tabularnewline
0.62 & 359.14 & 359.76 & 360 & 360 & 359.52 & 359 & 359.24 & 360 \tabularnewline
0.64 & 362.24 & 364.16 & 365 & 365 & 363.32 & 362 & 362.84 & 365 \tabularnewline
0.66 & 366.04 & 367.36 & 368 & 368 & 366.72 & 366 & 366.64 & 368 \tabularnewline
0.68 & 368.96 & 370.28 & 369 & 369 & 369.56 & 369 & 369.72 & 371 \tabularnewline
0.7 & 371 & 372.2 & 371 & 371 & 371.4 & 371 & 371.8 & 373 \tabularnewline
0.72 & 376.36 & 378.68 & 377 & 377 & 377.36 & 377 & 378.32 & 380 \tabularnewline
0.74 & 380 & 380 & 380 & 380 & 380 & 380 & 380 & 380 \tabularnewline
0.76 & 381.44 & 382 & 382 & 382 & 381.92 & 382 & 382 & 382 \tabularnewline
0.78 & 385.96 & 392.4 & 388 & 388 & 387.28 & 388 & 393.6 & 388 \tabularnewline
0.8 & 400.4 & 407.2 & 402 & 402 & 401.2 & 402 & 409.8 & 402 \tabularnewline
0.82 & 418.24 & 423.16 & 421 & 421 & 419.32 & 421 & 424.84 & 421 \tabularnewline
0.84 & 427 & 427.64 & 427 & 427 & 427 & 427 & 428.36 & 427 \tabularnewline
0.86 & 431.94 & 443.56 & 436 & 436 & 432.92 & 429 & 455.44 & 436 \tabularnewline
0.88 & 463.36 & 464.24 & 464 & 464 & 463.48 & 463 & 464.76 & 464 \tabularnewline
0.9 & 467.7 & 481 & 474 & 474 & 468.6 & 465 & 502 & 474 \tabularnewline
0.92 & 510.44 & 519.32 & 515 & 515 & 510.92 & 509 & 537.68 & 515 \tabularnewline
0.94 & 543.62 & 551.12 & 551 & 551 & 544.16 & 542 & 551.88 & 551 \tabularnewline
0.96 & 555.6 & 583.6 & 582 & 582 & 556.8 & 552 & 600.4 & 582 \tabularnewline
0.98 & 604.28 & 642.72 & 640 & 640 & 605.04 & 602 & 705.28 & 640 \tabularnewline
\hline
\end{tabular}
%Source: https://freestatistics.org/blog/index.php?pk=18286&T=1

[TABLE]
[ROW][C]Percentiles - Ungrouped Data[/C][/ROW]
[ROW][C]p[/C][C]Weighted Average at Xnp[/C][C]Weighted Average at X(n+1)p[/C][C]Empirical Distribution Function[/C][C]Empirical Distribution Function - Averaging[/C][C]Empirical Distribution Function - Interpolation[/C][C]Closest Observation[/C][C]True Basic - Statistics Graphics Toolkit[/C][C]MS Excel (old versions)[/C][/ROW]
[ROW][C]0.02[/C][C]260.74[/C][C]261.16[/C][C]262[/C][C]262[/C][C]271.2[/C][C]262[/C][C]241.84[/C][C]262[/C][/ROW]
[ROW][C]0.04[/C][C]272[/C][C]272[/C][C]272[/C][C]272[/C][C]273.68[/C][C]272[/C][C]272[/C][C]272[/C][/ROW]
[ROW][C]0.06[/C][C]275.64[/C][C]275.76[/C][C]276[/C][C]276[/C][C]276.76[/C][C]276[/C][C]274.24[/C][C]276[/C][/ROW]
[ROW][C]0.08[/C][C]280.8[/C][C]281.2[/C][C]282[/C][C]282[/C][C]282.68[/C][C]282[/C][C]277.8[/C][C]282[/C][/ROW]
[ROW][C]0.1[/C][C]283.7[/C][C]283.8[/C][C]284[/C][C]284[/C][C]286.4[/C][C]284[/C][C]283.2[/C][C]284[/C][/ROW]
[ROW][C]0.12[/C][C]289.92[/C][C]290.28[/C][C]291[/C][C]291[/C][C]291[/C][C]291[/C][C]288.72[/C][C]291[/C][/ROW]
[ROW][C]0.14[/C][C]292.74[/C][C]293.16[/C][C]294[/C][C]294[/C][C]294.44[/C][C]294[/C][C]291.84[/C][C]294[/C][/ROW]
[ROW][C]0.16[/C][C]297.08[/C][C]297.72[/C][C]299[/C][C]299[/C][C]299[/C][C]299[/C][C]296.28[/C][C]299[/C][/ROW]
[ROW][C]0.18[/C][C]299.92[/C][C]300.28[/C][C]301[/C][C]301[/C][C]301.28[/C][C]299[/C][C]299.72[/C][C]301[/C][/ROW]
[ROW][C]0.2[/C][C]302.4[/C][C]302.6[/C][C]303[/C][C]303[/C][C]303.6[/C][C]302[/C][C]302.4[/C][C]303[/C][/ROW]
[ROW][C]0.22[/C][C]306.68[/C][C]307.12[/C][C]308[/C][C]308[/C][C]308.48[/C][C]306[/C][C]306.88[/C][C]308[/C][/ROW]
[ROW][C]0.24[/C][C]312[/C][C]312[/C][C]312[/C][C]312[/C][C]312.04[/C][C]312[/C][C]312[/C][C]312[/C][/ROW]
[ROW][C]0.26[/C][C]313[/C][C]313[/C][C]313[/C][C]313[/C][C]313[/C][C]313[/C][C]313[/C][C]313[/C][/ROW]
[ROW][C]0.28[/C][C]313.32[/C][C]313.88[/C][C]315[/C][C]315[/C][C]314.76[/C][C]313[/C][C]314.12[/C][C]313[/C][/ROW]
[ROW][C]0.3[/C][C]316.1[/C][C]316.4[/C][C]317[/C][C]317[/C][C]316.8[/C][C]316[/C][C]316.6[/C][C]316[/C][/ROW]
[ROW][C]0.32[/C][C]320.2[/C][C]321.8[/C][C]325[/C][C]325[/C][C]323.6[/C][C]320[/C][C]323.2[/C][C]320[/C][/ROW]
[ROW][C]0.34[/C][C]325[/C][C]325.32[/C][C]325[/C][C]325[/C][C]325.64[/C][C]325[/C][C]325.68[/C][C]325[/C][/ROW]
[ROW][C]0.36[/C][C]327.84[/C][C]328[/C][C]328[/C][C]328[/C][C]328[/C][C]328[/C][C]328[/C][C]328[/C][/ROW]
[ROW][C]0.38[/C][C]329.72[/C][C]330.48[/C][C]330[/C][C]330[/C][C]330.96[/C][C]330[/C][C]331.52[/C][C]330[/C][/ROW]
[ROW][C]0.4[/C][C]335.2[/C][C]336[/C][C]336[/C][C]336[/C][C]336[/C][C]336[/C][C]336[/C][C]336[/C][/ROW]
[ROW][C]0.42[/C][C]337.48[/C][C]338.32[/C][C]338[/C][C]338[/C][C]338.64[/C][C]338[/C][C]339.68[/C][C]338[/C][/ROW]
[ROW][C]0.44[/C][C]340.68[/C][C]341.12[/C][C]341[/C][C]341[/C][C]341.24[/C][C]341[/C][C]341.88[/C][C]341[/C][/ROW]
[ROW][C]0.46[/C][C]343.86[/C][C]345.08[/C][C]345[/C][C]345[/C][C]345.16[/C][C]345[/C][C]345.92[/C][C]345[/C][/ROW]
[ROW][C]0.48[/C][C]346[/C][C]346.04[/C][C]346[/C][C]346[/C][C]346.08[/C][C]346[/C][C]346.96[/C][C]346[/C][/ROW]
[ROW][C]0.5[/C][C]348.5[/C][C]350[/C][C]350[/C][C]350[/C][C]350[/C][C]350[/C][C]350[/C][C]350[/C][/ROW]
[ROW][C]0.52[/C][C]351.44[/C][C]351.96[/C][C]352[/C][C]352[/C][C]351.92[/C][C]351[/C][C]351.04[/C][C]352[/C][/ROW]
[ROW][C]0.54[/C][C]352.38[/C][C]352.92[/C][C]353[/C][C]353[/C][C]352.84[/C][C]352[/C][C]352.08[/C][C]353[/C][/ROW]
[ROW][C]0.56[/C][C]353.96[/C][C]355.64[/C][C]356[/C][C]356[/C][C]355.28[/C][C]353[/C][C]353.36[/C][C]356[/C][/ROW]
[ROW][C]0.58[/C][C]356[/C][C]356[/C][C]356[/C][C]356[/C][C]356[/C][C]356[/C][C]356[/C][C]356[/C][/ROW]
[ROW][C]0.6[/C][C]357.4[/C][C]358.6[/C][C]359[/C][C]359[/C][C]358.2[/C][C]357[/C][C]357.4[/C][C]359[/C][/ROW]
[ROW][C]0.62[/C][C]359.14[/C][C]359.76[/C][C]360[/C][C]360[/C][C]359.52[/C][C]359[/C][C]359.24[/C][C]360[/C][/ROW]
[ROW][C]0.64[/C][C]362.24[/C][C]364.16[/C][C]365[/C][C]365[/C][C]363.32[/C][C]362[/C][C]362.84[/C][C]365[/C][/ROW]
[ROW][C]0.66[/C][C]366.04[/C][C]367.36[/C][C]368[/C][C]368[/C][C]366.72[/C][C]366[/C][C]366.64[/C][C]368[/C][/ROW]
[ROW][C]0.68[/C][C]368.96[/C][C]370.28[/C][C]369[/C][C]369[/C][C]369.56[/C][C]369[/C][C]369.72[/C][C]371[/C][/ROW]
[ROW][C]0.7[/C][C]371[/C][C]372.2[/C][C]371[/C][C]371[/C][C]371.4[/C][C]371[/C][C]371.8[/C][C]373[/C][/ROW]
[ROW][C]0.72[/C][C]376.36[/C][C]378.68[/C][C]377[/C][C]377[/C][C]377.36[/C][C]377[/C][C]378.32[/C][C]380[/C][/ROW]
[ROW][C]0.74[/C][C]380[/C][C]380[/C][C]380[/C][C]380[/C][C]380[/C][C]380[/C][C]380[/C][C]380[/C][/ROW]
[ROW][C]0.76[/C][C]381.44[/C][C]382[/C][C]382[/C][C]382[/C][C]381.92[/C][C]382[/C][C]382[/C][C]382[/C][/ROW]
[ROW][C]0.78[/C][C]385.96[/C][C]392.4[/C][C]388[/C][C]388[/C][C]387.28[/C][C]388[/C][C]393.6[/C][C]388[/C][/ROW]
[ROW][C]0.8[/C][C]400.4[/C][C]407.2[/C][C]402[/C][C]402[/C][C]401.2[/C][C]402[/C][C]409.8[/C][C]402[/C][/ROW]
[ROW][C]0.82[/C][C]418.24[/C][C]423.16[/C][C]421[/C][C]421[/C][C]419.32[/C][C]421[/C][C]424.84[/C][C]421[/C][/ROW]
[ROW][C]0.84[/C][C]427[/C][C]427.64[/C][C]427[/C][C]427[/C][C]427[/C][C]427[/C][C]428.36[/C][C]427[/C][/ROW]
[ROW][C]0.86[/C][C]431.94[/C][C]443.56[/C][C]436[/C][C]436[/C][C]432.92[/C][C]429[/C][C]455.44[/C][C]436[/C][/ROW]
[ROW][C]0.88[/C][C]463.36[/C][C]464.24[/C][C]464[/C][C]464[/C][C]463.48[/C][C]463[/C][C]464.76[/C][C]464[/C][/ROW]
[ROW][C]0.9[/C][C]467.7[/C][C]481[/C][C]474[/C][C]474[/C][C]468.6[/C][C]465[/C][C]502[/C][C]474[/C][/ROW]
[ROW][C]0.92[/C][C]510.44[/C][C]519.32[/C][C]515[/C][C]515[/C][C]510.92[/C][C]509[/C][C]537.68[/C][C]515[/C][/ROW]
[ROW][C]0.94[/C][C]543.62[/C][C]551.12[/C][C]551[/C][C]551[/C][C]544.16[/C][C]542[/C][C]551.88[/C][C]551[/C][/ROW]
[ROW][C]0.96[/C][C]555.6[/C][C]583.6[/C][C]582[/C][C]582[/C][C]556.8[/C][C]552[/C][C]600.4[/C][C]582[/C][/ROW]
[ROW][C]0.98[/C][C]604.28[/C][C]642.72[/C][C]640[/C][C]640[/C][C]605.04[/C][C]602[/C][C]705.28[/C][C]640[/C][/ROW]
[/TABLE]
Source: https://freestatistics.org/blog/index.php?pk=18286&T=1

Globally Unique Identifier (entire table): ba.freestatistics.org/blog/index.php?pk=18286&T=1

As an alternative you can also use a QR Code:  

The GUIDs for individual cells are displayed in the table below:

Percentiles - Ungrouped Data
pWeighted Average at XnpWeighted Average at X(n+1)pEmpirical Distribution FunctionEmpirical Distribution Function - AveragingEmpirical Distribution Function - InterpolationClosest ObservationTrue Basic - Statistics Graphics ToolkitMS Excel (old versions)
0.02260.74261.16262262271.2262241.84262
0.04272272272272273.68272272272
0.06275.64275.76276276276.76276274.24276
0.08280.8281.2282282282.68282277.8282
0.1283.7283.8284284286.4284283.2284
0.12289.92290.28291291291291288.72291
0.14292.74293.16294294294.44294291.84294
0.16297.08297.72299299299299296.28299
0.18299.92300.28301301301.28299299.72301
0.2302.4302.6303303303.6302302.4303
0.22306.68307.12308308308.48306306.88308
0.24312312312312312.04312312312
0.26313313313313313313313313
0.28313.32313.88315315314.76313314.12313
0.3316.1316.4317317316.8316316.6316
0.32320.2321.8325325323.6320323.2320
0.34325325.32325325325.64325325.68325
0.36327.84328328328328328328328
0.38329.72330.48330330330.96330331.52330
0.4335.2336336336336336336336
0.42337.48338.32338338338.64338339.68338
0.44340.68341.12341341341.24341341.88341
0.46343.86345.08345345345.16345345.92345
0.48346346.04346346346.08346346.96346
0.5348.5350350350350350350350
0.52351.44351.96352352351.92351351.04352
0.54352.38352.92353353352.84352352.08353
0.56353.96355.64356356355.28353353.36356
0.58356356356356356356356356
0.6357.4358.6359359358.2357357.4359
0.62359.14359.76360360359.52359359.24360
0.64362.24364.16365365363.32362362.84365
0.66366.04367.36368368366.72366366.64368
0.68368.96370.28369369369.56369369.72371
0.7371372.2371371371.4371371.8373
0.72376.36378.68377377377.36377378.32380
0.74380380380380380380380380
0.76381.44382382382381.92382382382
0.78385.96392.4388388387.28388393.6388
0.8400.4407.2402402401.2402409.8402
0.82418.24423.16421421419.32421424.84421
0.84427427.64427427427427428.36427
0.86431.94443.56436436432.92429455.44436
0.88463.36464.24464464463.48463464.76464
0.9467.7481474474468.6465502474
0.92510.44519.32515515510.92509537.68515
0.94543.62551.12551551544.16542551.88551
0.96555.6583.6582582556.8552600.4582
0.98604.28642.72640640605.04602705.28640


Parameters (Session):
Parameters (R input):
R code (references can be found in the software module):
x <-sort(x[!is.na(x)])
q1 <- function(data,n,p,i,f) {
np <- n*p;
i <<- floor(np)
f <<- np - i
qvalue <- (1-f)*data[i] + f*data[i+1]
}
q2 <- function(data,n,p,i,f) {
np <- (n+1)*p
i <<- floor(np)
f <<- np - i
qvalue <- (1-f)*data[i] + f*data[i+1]
}
q3 <- function(data,n,p,i,f) {
np <- n*p
i <<- floor(np)
f <<- np - i
if (f==0) {
qvalue <- data[i]
} else {
qvalue <- data[i+1]
}
}
q4 <- function(data,n,p,i,f) {
np <- n*p
i <<- floor(np)
f <<- np - i
if (f==0) {
qvalue <- (data[i]+data[i+1])/2
} else {
qvalue <- data[i+1]
}
}
q5 <- function(data,n,p,i,f) {
np <- (n-1)*p
i <<- floor(np)
f <<- np - i
if (f==0) {
qvalue <- data[i+1]
} else {
qvalue <- data[i+1] + f*(data[i+2]-data[i+1])
}
}
q6 <- function(data,n,p,i,f) {
np <- n*p+0.5
i <<- floor(np)
f <<- np - i
qvalue <- data[i]
}
q7 <- function(data,n,p,i,f) {
np <- (n+1)*p
i <<- floor(np)
f <<- np - i
if (f==0) {
qvalue <- data[i]
} else {
qvalue <- f*data[i] + (1-f)*data[i+1]
}
}
q8 <- function(data,n,p,i,f) {
np <- (n+1)*p
i <<- floor(np)
f <<- np - i
if (f==0) {
qvalue <- data[i]
} else {
if (f == 0.5) {
qvalue <- (data[i]+data[i+1])/2
} else {
if (f < 0.5) {
qvalue <- data[i]
} else {
qvalue <- data[i+1]
}
}
}
}
lx <- length(x)
qval <- array(NA,dim=c(99,8))
mystep <- 25
mystart <- 25
if (lx>10){
mystep=10
mystart=10
}
if (lx>20){
mystep=5
mystart=5
}
if (lx>50){
mystep=2
mystart=2
}
if (lx>=100){
mystep=1
mystart=1
}
for (perc in seq(mystart,99,mystep)) {
qval[perc,1] <- q1(x,lx,perc/100,i,f)
qval[perc,2] <- q2(x,lx,perc/100,i,f)
qval[perc,3] <- q3(x,lx,perc/100,i,f)
qval[perc,4] <- q4(x,lx,perc/100,i,f)
qval[perc,5] <- q5(x,lx,perc/100,i,f)
qval[perc,6] <- q6(x,lx,perc/100,i,f)
qval[perc,7] <- q7(x,lx,perc/100,i,f)
qval[perc,8] <- q8(x,lx,perc/100,i,f)
}
bitmap(file='test1.png')
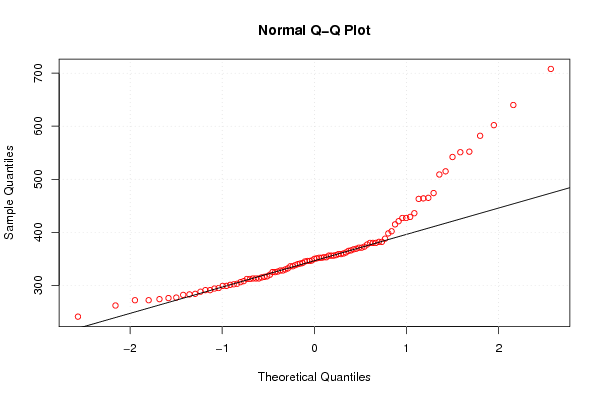
myqqnorm <- qqnorm(x,col=2)
qqline(x)
grid()
dev.off()
load(file='createtable')
a<-table.start()
a<-table.row.start(a)
a<-table.element(a,'Percentiles - Ungrouped Data',9,TRUE)
a<-table.row.end(a)
a<-table.row.start(a)
a<-table.element(a,'p',1,TRUE)
a<-table.element(a,hyperlink('method_1.htm', 'Weighted Average at Xnp',''),1,TRUE)
a<-table.element(a,hyperlink('method_2.htm','Weighted Average at X(n+1)p',''),1,TRUE)
a<-table.element(a,hyperlink('method_3.htm','Empirical Distribution Function',''),1,TRUE)
a<-table.element(a,hyperlink('method_4.htm','Empirical Distribution Function - Averaging',''),1,TRUE)
a<-table.element(a,hyperlink('method_5.htm','Empirical Distribution Function - Interpolation',''),1,TRUE)
a<-table.element(a,hyperlink('method_6.htm','Closest Observation',''),1,TRUE)
a<-table.element(a,hyperlink('method_7.htm','True Basic - Statistics Graphics Toolkit',''),1,TRUE)
a<-table.element(a,hyperlink('method_8.htm','MS Excel (old versions)',''),1,TRUE)
a<-table.row.end(a)
for (perc in seq(mystart,99,mystep)) {
a<-table.row.start(a)
a<-table.element(a,round(perc/100,2),1,TRUE)
for (j in 1:8) {
a<-table.element(a,round(qval[perc,j],6))
}
a<-table.row.end(a)
}
a<-table.end(a)
table.save(a,file='mytable.tab')