Free Statistics

of Irreproducible Research!

Author's title

Author*The author of this computation has been verified*
R Software Modulerwasp_correlation.wasp
Title produced by softwarePearson Correlation
Date of computationMon, 20 Oct 2008 16:36:31 -0600
Cite this page as followsStatistical Computations at FreeStatistics.org, Office for Research Development and Education, URL https://freestatistics.org/blog/index.php?v=date/2008/Oct/21/t1224542240fb6hr4ah6y5oc2c.htm/, Retrieved Sun, 19 May 2024 19:41:10 +0000
Statistical Computations at FreeStatistics.org, Office for Research Development and Education, URL https://freestatistics.org/blog/index.php?pk=18269, Retrieved Sun, 19 May 2024 19:41:10 +0000
QR Codes:

Original text written by user:
IsPrivate?No (this computation is public)
User-defined keywords
Estimated Impact177
Family? (F = Feedback message, R = changed R code, M = changed R Module, P = changed Parameters, D = changed Data)
-     [Pearson Correlation] [Investigating ass...] [2007-10-22 22:08:56] [8cd6641b921d30ebe00b648d1481bba0]
F    D    [Pearson Correlation] [Associatie bouwve...] [2008-10-20 22:36:31] [de3f0516a1536f7c4a656924d8bc8d07] [Current]
Feedback Forum
2008-10-25 13:23:57 [Davy De Nef] [reply
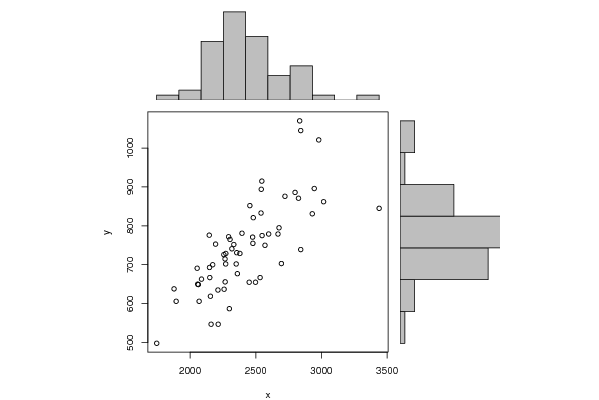
Aan de hand van de Pearson Correlation vinden we hier een onderlinge samenhang terug van 75%. Dit is nog altijd groot. De grafiek verloopt stijgend, wat wijst op een stijgende rechte. De punten liggen hier zowel links, als rechts, verder van de rechte, dan daarnet.
2008-10-25 13:49:36 [Astrid Sniekers] [reply
De student heeft geen vergelijking gemaakt tussen tijdreeks 2 en 3, 2 en 4 en 3 en 4!!!
De uitleg van de student is beperkt tot het minimum. Beknopt. De uitleg had iets uitgebreider gekund.
2008-10-26 23:19:11 [Kristof Augustyns] [reply
Hier helemaal dezelfde berekeningen als bij het Vlaams Gewest.
Enkel is hier de correlatie niet zo groot, maar een 75% of 0,75.
De samenhang tussen België en Waals gewest is nog vrij hoog, maar niet zo hoog als de relatie België - Vlaams Gewest.
Er kan ook een mooie rechte getrokken worden van de linkse onderhoek naar de rechtse bovenhoek.
Student heef niet genoeg uitleg gegeven.

Post a new message
Dataseries X:
2266
1878
2267
2069
1746
2299
2360
2214
2825
2355
2333
3016
2155
2172
2150
2533
2058
2160
2259
2498
2695
2799
2945
2930
2318
2540
2570
2669
2450
2842
3439
2677
2979
2257
2842
2546
2455
2293
2379
2478
2054
2272
2351
2271
2542
2304
2194
2722
2395
2146
1894
2548
2087
2063
2481
2476
2212
2834
2148
2598
Dataseries Y:
715
638
656
606
498
587
677
547
871
731
752
862
619
700
667
667
650
547
637
655
703
886
896
831
741
833
750
779
655
739
845
795
1021
726
1045
915
852
772
729
755
691
729
702
702
894
765
753
876
781
776
606
775
663
649
821
771
635
1070
693
779


Summary of computational transaction
Raw Inputview raw input (R code)
Raw Outputview raw output of R engine
Computing time1 seconds
R Server'George Udny Yule' @ 72.249.76.132

\begin{tabular}{lllllllll}
\hline
Summary of computational transaction \tabularnewline
Raw Input & view raw input (R code)  \tabularnewline
Raw Output & view raw output of R engine  \tabularnewline
Computing time & 1 seconds \tabularnewline
R Server & 'George Udny Yule' @ 72.249.76.132 \tabularnewline
\hline
\end{tabular}
%Source: https://freestatistics.org/blog/index.php?pk=18269&T=0

[TABLE]
[ROW][C]Summary of computational transaction[/C][/ROW]
[ROW][C]Raw Input[/C][C]view raw input (R code) [/C][/ROW]
[ROW][C]Raw Output[/C][C]view raw output of R engine [/C][/ROW]
[ROW][C]Computing time[/C][C]1 seconds[/C][/ROW]
[ROW][C]R Server[/C][C]'George Udny Yule' @ 72.249.76.132[/C][/ROW]
[/TABLE]
Source: https://freestatistics.org/blog/index.php?pk=18269&T=0

Globally Unique Identifier (entire table): ba.freestatistics.org/blog/index.php?pk=18269&T=0

As an alternative you can also use a QR Code:  

The GUIDs for individual cells are displayed in the table below:

Summary of computational transaction
Raw Inputview raw input (R code)
Raw Outputview raw output of R engine
Computing time1 seconds
R Server'George Udny Yule' @ 72.249.76.132


Pearson Product Moment Correlation - Ungrouped Data
StatisticVariable XVariable Y
Mean2421.8744.683333333333
Biased Variance99145.926666666713329.9830555556
Biased Standard Deviation314.874461756851115.455545798180
Covariance27614.7152542373
Correlation0.746945807301537
Determination0.557928039045345
T-Test8.55572083712342
p-value (2 sided)7.22444326584082e-12
p-value (1 sided)3.61222163292041e-12
Degrees of Freedom58
Number of Observations60

\begin{tabular}{lllllllll}
\hline
Pearson Product Moment Correlation - Ungrouped Data \tabularnewline
Statistic & Variable X & Variable Y \tabularnewline
Mean & 2421.8 & 744.683333333333 \tabularnewline
Biased Variance & 99145.9266666667 & 13329.9830555556 \tabularnewline
Biased Standard Deviation & 314.874461756851 & 115.455545798180 \tabularnewline
Covariance & 27614.7152542373 \tabularnewline
Correlation & 0.746945807301537 \tabularnewline
Determination & 0.557928039045345 \tabularnewline
T-Test & 8.55572083712342 \tabularnewline
p-value (2 sided) & 7.22444326584082e-12 \tabularnewline
p-value (1 sided) & 3.61222163292041e-12 \tabularnewline
Degrees of Freedom & 58 \tabularnewline
Number of Observations & 60 \tabularnewline
\hline
\end{tabular}
%Source: https://freestatistics.org/blog/index.php?pk=18269&T=1

[TABLE]
[ROW][C]Pearson Product Moment Correlation - Ungrouped Data[/C][/ROW]
[ROW][C]Statistic[/C][C]Variable X[/C][C]Variable Y[/C][/ROW]
[ROW][C]Mean[/C][C]2421.8[/C][C]744.683333333333[/C][/ROW]
[ROW][C]Biased Variance[/C][C]99145.9266666667[/C][C]13329.9830555556[/C][/ROW]
[ROW][C]Biased Standard Deviation[/C][C]314.874461756851[/C][C]115.455545798180[/C][/ROW]
[ROW][C]Covariance[/C][C]27614.7152542373[/C][/ROW]
[ROW][C]Correlation[/C][C]0.746945807301537[/C][/ROW]
[ROW][C]Determination[/C][C]0.557928039045345[/C][/ROW]
[ROW][C]T-Test[/C][C]8.55572083712342[/C][/ROW]
[ROW][C]p-value (2 sided)[/C][C]7.22444326584082e-12[/C][/ROW]
[ROW][C]p-value (1 sided)[/C][C]3.61222163292041e-12[/C][/ROW]
[ROW][C]Degrees of Freedom[/C][C]58[/C][/ROW]
[ROW][C]Number of Observations[/C][C]60[/C][/ROW]
[/TABLE]
Source: https://freestatistics.org/blog/index.php?pk=18269&T=1

Globally Unique Identifier (entire table): ba.freestatistics.org/blog/index.php?pk=18269&T=1

As an alternative you can also use a QR Code:  

The GUIDs for individual cells are displayed in the table below:

Pearson Product Moment Correlation - Ungrouped Data
StatisticVariable XVariable Y
Mean2421.8744.683333333333
Biased Variance99145.926666666713329.9830555556
Biased Standard Deviation314.874461756851115.455545798180
Covariance27614.7152542373
Correlation0.746945807301537
Determination0.557928039045345
T-Test8.55572083712342
p-value (2 sided)7.22444326584082e-12
p-value (1 sided)3.61222163292041e-12
Degrees of Freedom58
Number of Observations60


Parameters (Session):
Parameters (R input):
R code (references can be found in the software module):
bitmap(file='test1.png')
histx <- hist(x, plot=FALSE)
histy <- hist(y, plot=FALSE)
maxcounts <- max(c(histx$counts, histx$counts))
xrange <- c(min(x),max(x))
yrange <- c(min(y),max(y))
nf <- layout(matrix(c(2,0,1,3),2,2,byrow=TRUE), c(3,1), c(1,3), TRUE)
par(mar=c(4,4,1,1))
plot(x, y, xlim=xrange, ylim=yrange, xlab=xlab, ylab=ylab)
par(mar=c(0,4,1,1))
barplot(histx$counts, axes=FALSE, ylim=c(0, maxcounts), space=0)
par(mar=c(4,0,1,1))
barplot(histy$counts, axes=FALSE, xlim=c(0, maxcounts), space=0, horiz=TRUE)
dev.off()
lx = length(x)
makebiased = (lx-1)/lx
varx = var(x)*makebiased
vary = var(y)*makebiased
corxy <- cor.test(x,y,method='pearson')
cxy <- as.matrix(corxy$estimate)[1,1]
load(file='createtable')
a<-table.start()
a<-table.row.start(a)
a<-table.element(a,'Pearson Product Moment Correlation - Ungrouped Data',3,TRUE)
a<-table.row.end(a)
a<-table.row.start(a)
a<-table.element(a,'Statistic',1,TRUE)
a<-table.element(a,'Variable X',1,TRUE)
a<-table.element(a,'Variable Y',1,TRUE)
a<-table.row.end(a)
a<-table.row.start(a)
a<-table.element(a,hyperlink('arithmetic_mean.htm','Mean',''),header=TRUE)
a<-table.element(a,mean(x))
a<-table.element(a,mean(y))
a<-table.row.end(a)
a<-table.row.start(a)
a<-table.element(a,hyperlink('biased.htm','Biased Variance',''),header=TRUE)
a<-table.element(a,varx)
a<-table.element(a,vary)
a<-table.row.end(a)
a<-table.row.start(a)
a<-table.element(a,hyperlink('biased1.htm','Biased Standard Deviation',''),header=TRUE)
a<-table.element(a,sqrt(varx))
a<-table.element(a,sqrt(vary))
a<-table.row.end(a)
a<-table.row.start(a)
a<-table.element(a,hyperlink('covariance.htm','Covariance',''),header=TRUE)
a<-table.element(a,cov(x,y),2)
a<-table.row.end(a)
a<-table.row.start(a)
a<-table.element(a,hyperlink('pearson_correlation.htm','Correlation',''),header=TRUE)
a<-table.element(a,cxy,2)
a<-table.row.end(a)
a<-table.row.start(a)
a<-table.element(a,hyperlink('coeff_of_determination.htm','Determination',''),header=TRUE)
a<-table.element(a,cxy*cxy,2)
a<-table.row.end(a)
a<-table.row.start(a)
a<-table.element(a,hyperlink('ttest_statistic.htm','T-Test',''),header=TRUE)
a<-table.element(a,as.matrix(corxy$statistic)[1,1],2)
a<-table.row.end(a)
a<-table.row.start(a)
a<-table.element(a,'p-value (2 sided)',header=TRUE)
a<-table.element(a,(p2 <- as.matrix(corxy$p.value)[1,1]),2)
a<-table.row.end(a)
a<-table.row.start(a)
a<-table.element(a,'p-value (1 sided)',header=TRUE)
a<-table.element(a,p2/2,2)
a<-table.row.end(a)
a<-table.row.start(a)
a<-table.element(a,'Degrees of Freedom',header=TRUE)
a<-table.element(a,lx-2,2)
a<-table.row.end(a)
a<-table.row.start(a)
a<-table.element(a,'Number of Observations',header=TRUE)
a<-table.element(a,lx,2)
a<-table.row.end(a)
a<-table.end(a)
table.save(a,file='mytable.tab')