Free Statistics

of Irreproducible Research!

Author's title

Author*The author of this computation has been verified*
R Software Modulerwasp_correlation.wasp
Title produced by softwarePearson Correlation
Date of computationMon, 20 Oct 2008 16:32:48 -0600
Cite this page as followsStatistical Computations at FreeStatistics.org, Office for Research Development and Education, URL https://freestatistics.org/blog/index.php?v=date/2008/Oct/21/t1224542075nbuy9g82lk4r7pq.htm/, Retrieved Sun, 19 May 2024 17:12:45 +0000
Statistical Computations at FreeStatistics.org, Office for Research Development and Education, URL https://freestatistics.org/blog/index.php?pk=18267, Retrieved Sun, 19 May 2024 17:12:45 +0000
QR Codes:

Original text written by user:
IsPrivate?No (this computation is public)
User-defined keywords
Estimated Impact179
Family? (F = Feedback message, R = changed R code, M = changed R Module, P = changed Parameters, D = changed Data)
-     [Pearson Correlation] [Investigating ass...] [2007-10-22 22:08:56] [8cd6641b921d30ebe00b648d1481bba0]
F    D    [Pearson Correlation] [Associatie Bouwve...] [2008-10-20 22:32:48] [de3f0516a1536f7c4a656924d8bc8d07] [Current]
Feedback Forum
2008-10-25 13:20:30 [Davy De Nef] [reply
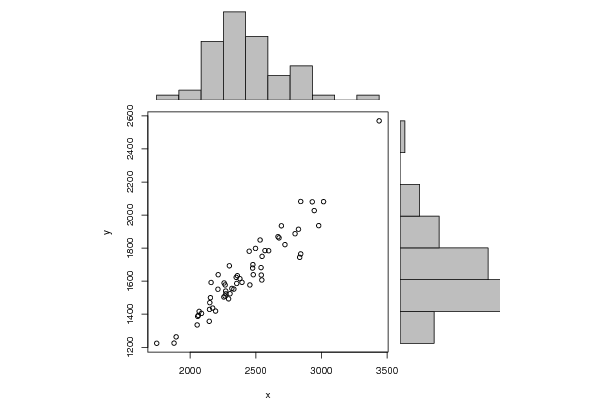
De student gaat hier na wat het onderling verband is van 2 reeksen. Zo bekomt hij een correlatie van bijna 95%. Dat is zeer groot. Dat kunnen we ook afleiden uit de grafiek. We kunnen een denkbeeldige stijgende rechte tekenen. Dit duidt op een positieve correlatie.
2008-10-25 13:49:05 [Astrid Sniekers] [reply
De student heeft geen vergelijking gemaakt tussen tijdreeks 2 en 3, 2 en 4 en 3 en 4!!!
De uitleg van de student is beperkt tot het minimum. Beknopt. De uitleg had iets uitgebreider gekund.
2008-10-26 23:16:26 [Kristof Augustyns] [reply
Er is hier een correlatie van ongeveer 95% of 0,95 en als je weet dat correlatie tussen -1 en 1 zit, dan weet je dat dit heel hoog is.
De samenhang tussen beide is heel groot.
Als bouwvergunningen in het Vlaams Gewest zouden dalen met 50%, dan zullen de bouwvergunningen in België wel eens even hard kunnen dalen (45%).
Je ziet ook dat je een mooie rechte kunt trekken van links vanonder naar rechts vanboven.
Veel uitleg is er door de student weeral eens niet gegeven.

Post a new message
Dataseries X:
2266
1878
2267
2069
1746
2299
2360
2214
2825
2355
2333
3016
2155
2172
2150
2533
2058
2160
2259
2498
2695
2799
2945
2930
2318
2540
2570
2669
2450
2842
3439
2677
2979
2257
2842
2546
2455
2293
2379
2478
2054
2272
2351
2271
2542
2304
2194
2722
2395
2146
1894
2548
2087
2063
2481
2476
2212
2834
2148
2598
Dataseries Y:
1510
1225
1577
1417
1224
1693
1633
1639
1914
1586
1552
2081
1500
1437
1470
1849
1387
1592
1589
1798
1935
1887
2027
2080
1556
1682
1785
1869
1781
2082
2570
1862
1936
1504
1765
1607
1577
1493
1615
1700
1335
1523
1623
1540
1637
1524
1419
1821
1593
1357
1263
1750
1405
1393
1639
1679
1551
1744
1429
1784


Summary of computational transaction
Raw Inputview raw input (R code)
Raw Outputview raw output of R engine
Computing time1 seconds
R Server'George Udny Yule' @ 72.249.76.132

\begin{tabular}{lllllllll}
\hline
Summary of computational transaction \tabularnewline
Raw Input & view raw input (R code)  \tabularnewline
Raw Output & view raw output of R engine  \tabularnewline
Computing time & 1 seconds \tabularnewline
R Server & 'George Udny Yule' @ 72.249.76.132 \tabularnewline
\hline
\end{tabular}
%Source: https://freestatistics.org/blog/index.php?pk=18267&T=0

[TABLE]
[ROW][C]Summary of computational transaction[/C][/ROW]
[ROW][C]Raw Input[/C][C]view raw input (R code) [/C][/ROW]
[ROW][C]Raw Output[/C][C]view raw output of R engine [/C][/ROW]
[ROW][C]Computing time[/C][C]1 seconds[/C][/ROW]
[ROW][C]R Server[/C][C]'George Udny Yule' @ 72.249.76.132[/C][/ROW]
[/TABLE]
Source: https://freestatistics.org/blog/index.php?pk=18267&T=0

Globally Unique Identifier (entire table): ba.freestatistics.org/blog/index.php?pk=18267&T=0

As an alternative you can also use a QR Code:  

The GUIDs for individual cells are displayed in the table below:

Summary of computational transaction
Raw Inputview raw input (R code)
Raw Outputview raw output of R engine
Computing time1 seconds
R Server'George Udny Yule' @ 72.249.76.132


Pearson Product Moment Correlation - Ungrouped Data
StatisticVariable XVariable Y
Mean2421.81649.91666666667
Biased Variance99145.926666666757106.9430555556
Biased Standard Deviation314.874461756851238.970590356963
Covariance72665.2542372881
Correlation0.949610841111645
Determination0.901760749556765
T-Test23.0736946349920
p-value (2 sided)0
p-value (1 sided)0
Degrees of Freedom58
Number of Observations60

\begin{tabular}{lllllllll}
\hline
Pearson Product Moment Correlation - Ungrouped Data \tabularnewline
Statistic & Variable X & Variable Y \tabularnewline
Mean & 2421.8 & 1649.91666666667 \tabularnewline
Biased Variance & 99145.9266666667 & 57106.9430555556 \tabularnewline
Biased Standard Deviation & 314.874461756851 & 238.970590356963 \tabularnewline
Covariance & 72665.2542372881 \tabularnewline
Correlation & 0.949610841111645 \tabularnewline
Determination & 0.901760749556765 \tabularnewline
T-Test & 23.0736946349920 \tabularnewline
p-value (2 sided) & 0 \tabularnewline
p-value (1 sided) & 0 \tabularnewline
Degrees of Freedom & 58 \tabularnewline
Number of Observations & 60 \tabularnewline
\hline
\end{tabular}
%Source: https://freestatistics.org/blog/index.php?pk=18267&T=1

[TABLE]
[ROW][C]Pearson Product Moment Correlation - Ungrouped Data[/C][/ROW]
[ROW][C]Statistic[/C][C]Variable X[/C][C]Variable Y[/C][/ROW]
[ROW][C]Mean[/C][C]2421.8[/C][C]1649.91666666667[/C][/ROW]
[ROW][C]Biased Variance[/C][C]99145.9266666667[/C][C]57106.9430555556[/C][/ROW]
[ROW][C]Biased Standard Deviation[/C][C]314.874461756851[/C][C]238.970590356963[/C][/ROW]
[ROW][C]Covariance[/C][C]72665.2542372881[/C][/ROW]
[ROW][C]Correlation[/C][C]0.949610841111645[/C][/ROW]
[ROW][C]Determination[/C][C]0.901760749556765[/C][/ROW]
[ROW][C]T-Test[/C][C]23.0736946349920[/C][/ROW]
[ROW][C]p-value (2 sided)[/C][C]0[/C][/ROW]
[ROW][C]p-value (1 sided)[/C][C]0[/C][/ROW]
[ROW][C]Degrees of Freedom[/C][C]58[/C][/ROW]
[ROW][C]Number of Observations[/C][C]60[/C][/ROW]
[/TABLE]
Source: https://freestatistics.org/blog/index.php?pk=18267&T=1

Globally Unique Identifier (entire table): ba.freestatistics.org/blog/index.php?pk=18267&T=1

As an alternative you can also use a QR Code:  

The GUIDs for individual cells are displayed in the table below:

Pearson Product Moment Correlation - Ungrouped Data
StatisticVariable XVariable Y
Mean2421.81649.91666666667
Biased Variance99145.926666666757106.9430555556
Biased Standard Deviation314.874461756851238.970590356963
Covariance72665.2542372881
Correlation0.949610841111645
Determination0.901760749556765
T-Test23.0736946349920
p-value (2 sided)0
p-value (1 sided)0
Degrees of Freedom58
Number of Observations60


Parameters (Session):
Parameters (R input):
R code (references can be found in the software module):
bitmap(file='test1.png')
histx <- hist(x, plot=FALSE)
histy <- hist(y, plot=FALSE)
maxcounts <- max(c(histx$counts, histx$counts))
xrange <- c(min(x),max(x))
yrange <- c(min(y),max(y))
nf <- layout(matrix(c(2,0,1,3),2,2,byrow=TRUE), c(3,1), c(1,3), TRUE)
par(mar=c(4,4,1,1))
plot(x, y, xlim=xrange, ylim=yrange, xlab=xlab, ylab=ylab)
par(mar=c(0,4,1,1))
barplot(histx$counts, axes=FALSE, ylim=c(0, maxcounts), space=0)
par(mar=c(4,0,1,1))
barplot(histy$counts, axes=FALSE, xlim=c(0, maxcounts), space=0, horiz=TRUE)
dev.off()
lx = length(x)
makebiased = (lx-1)/lx
varx = var(x)*makebiased
vary = var(y)*makebiased
corxy <- cor.test(x,y,method='pearson')
cxy <- as.matrix(corxy$estimate)[1,1]
load(file='createtable')
a<-table.start()
a<-table.row.start(a)
a<-table.element(a,'Pearson Product Moment Correlation - Ungrouped Data',3,TRUE)
a<-table.row.end(a)
a<-table.row.start(a)
a<-table.element(a,'Statistic',1,TRUE)
a<-table.element(a,'Variable X',1,TRUE)
a<-table.element(a,'Variable Y',1,TRUE)
a<-table.row.end(a)
a<-table.row.start(a)
a<-table.element(a,hyperlink('arithmetic_mean.htm','Mean',''),header=TRUE)
a<-table.element(a,mean(x))
a<-table.element(a,mean(y))
a<-table.row.end(a)
a<-table.row.start(a)
a<-table.element(a,hyperlink('biased.htm','Biased Variance',''),header=TRUE)
a<-table.element(a,varx)
a<-table.element(a,vary)
a<-table.row.end(a)
a<-table.row.start(a)
a<-table.element(a,hyperlink('biased1.htm','Biased Standard Deviation',''),header=TRUE)
a<-table.element(a,sqrt(varx))
a<-table.element(a,sqrt(vary))
a<-table.row.end(a)
a<-table.row.start(a)
a<-table.element(a,hyperlink('covariance.htm','Covariance',''),header=TRUE)
a<-table.element(a,cov(x,y),2)
a<-table.row.end(a)
a<-table.row.start(a)
a<-table.element(a,hyperlink('pearson_correlation.htm','Correlation',''),header=TRUE)
a<-table.element(a,cxy,2)
a<-table.row.end(a)
a<-table.row.start(a)
a<-table.element(a,hyperlink('coeff_of_determination.htm','Determination',''),header=TRUE)
a<-table.element(a,cxy*cxy,2)
a<-table.row.end(a)
a<-table.row.start(a)
a<-table.element(a,hyperlink('ttest_statistic.htm','T-Test',''),header=TRUE)
a<-table.element(a,as.matrix(corxy$statistic)[1,1],2)
a<-table.row.end(a)
a<-table.row.start(a)
a<-table.element(a,'p-value (2 sided)',header=TRUE)
a<-table.element(a,(p2 <- as.matrix(corxy$p.value)[1,1]),2)
a<-table.row.end(a)
a<-table.row.start(a)
a<-table.element(a,'p-value (1 sided)',header=TRUE)
a<-table.element(a,p2/2,2)
a<-table.row.end(a)
a<-table.row.start(a)
a<-table.element(a,'Degrees of Freedom',header=TRUE)
a<-table.element(a,lx-2,2)
a<-table.row.end(a)
a<-table.row.start(a)
a<-table.element(a,'Number of Observations',header=TRUE)
a<-table.element(a,lx,2)
a<-table.row.end(a)
a<-table.end(a)
table.save(a,file='mytable.tab')