Free Statistics
of Irreproducible Research!
Description of Statistical Computation | |||||||||||||||||||||
|---|---|---|---|---|---|---|---|---|---|---|---|---|---|---|---|---|---|---|---|---|---|
| Author's title | |||||||||||||||||||||
| Author | *The author of this computation has been verified* | ||||||||||||||||||||
| R Software Module | rwasp_backtobackhist.wasp | ||||||||||||||||||||
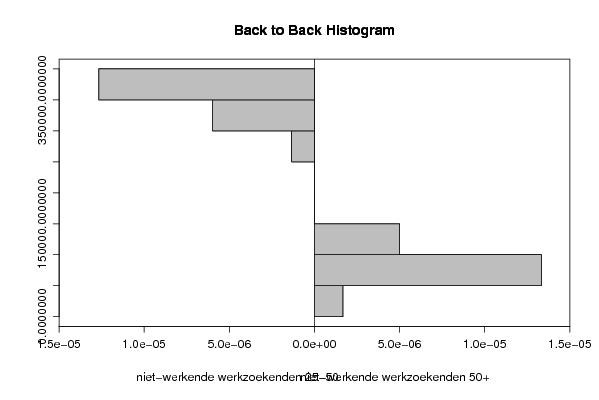
| Title produced by software | Back to Back Histogram | ||||||||||||||||||||
| Date of computation | Mon, 20 Oct 2008 15:53:01 -0600 | ||||||||||||||||||||
| Cite this page as follows | Statistical Computations at FreeStatistics.org, Office for Research Development and Education, URL https://freestatistics.org/blog/index.php?v=date/2008/Oct/20/t1224539626jlavlpy5r6tr39r.htm/, Retrieved Sun, 19 May 2024 13:20:08 +0000 | ||||||||||||||||||||
| Statistical Computations at FreeStatistics.org, Office for Research Development and Education, URL https://freestatistics.org/blog/index.php?pk=18214, Retrieved Sun, 19 May 2024 13:20:08 +0000 | |||||||||||||||||||||
| QR Codes: | |||||||||||||||||||||
|
| |||||||||||||||||||||
| Original text written by user: | |||||||||||||||||||||
| IsPrivate? | No (this computation is public) | ||||||||||||||||||||
| User-defined keywords | |||||||||||||||||||||
| Estimated Impact | 90 | ||||||||||||||||||||
Tree of Dependent Computations | |||||||||||||||||||||
| Family? (F = Feedback message, R = changed R code, M = changed R Module, P = changed Parameters, D = changed Data) | |||||||||||||||||||||
| - [Back to Back Histogram] [Q8 25-50 & 50+] [2008-10-20 21:53:01] [d96f761aa3e94002e7c05c3c847d2c79] [Current] | |||||||||||||||||||||
| Feedback Forum | |||||||||||||||||||||
Post a new message | |||||||||||||||||||||
Dataset | |||||||||||||||||||||
| Dataseries X: | |||||||||||||||||||||
375787 372720 364431 370490 376974 377632 378205 370861 369167 371551 382842 381903 384502 392058 384359 388884 386586 387495 385705 378670 377367 376911 389827 387820 387267 380575 372402 376740 377795 376126 370804 367980 367866 366121 379421 378519 372423 355072 344693 342892 344178 337606 327103 323953 316532 306307 327225 329573 313761 307836 300074 304198 306122 300414 292133 290616 280244 285179 305486 305957 | |||||||||||||||||||||
| Dataseries Y: | |||||||||||||||||||||
44277 44976 45406 47379 49200 50221 51573 53091 53337 54978 57885 67099 67169 69796 70600 71982 73957 75273 76322 77078 77954 79238 82179 83834 83744 84861 86478 88290 90287 91230 92380 92506 94172 94728 96581 97344 98346 98214 98366 98768 99832 99976 99961 100164 99964 99304 104008 104644 103950 104263 104241 105141 106018 105866 105944 106379 105082 104915 107026 107306 | |||||||||||||||||||||
Tables (Output of Computation) | |||||||||||||||||||||
| |||||||||||||||||||||
Figures (Output of Computation) | |||||||||||||||||||||
Input Parameters & R Code | |||||||||||||||||||||
| Parameters (Session): | |||||||||||||||||||||
| par1 = grey ; par2 = grey ; par3 = TRUE ; par4 = niet-werkende werkzoekenden 25-50 ; par5 = niet-werkende werkzoekenden 50+ ; | |||||||||||||||||||||
| Parameters (R input): | |||||||||||||||||||||
| par1 = grey ; par2 = grey ; par3 = TRUE ; par4 = niet-werkende werkzoekenden 25-50 ; par5 = niet-werkende werkzoekenden 50+ ; | |||||||||||||||||||||
| R code (references can be found in the software module): | |||||||||||||||||||||
if (par3 == 'TRUE') par3 <- TRUE | |||||||||||||||||||||