Free Statistics
of Irreproducible Research!
Description of Statistical Computation | |||||||||||||||||||||
|---|---|---|---|---|---|---|---|---|---|---|---|---|---|---|---|---|---|---|---|---|---|
| Author's title | |||||||||||||||||||||
| Author | *The author of this computation has been verified* | ||||||||||||||||||||
| R Software Module | rwasp_backtobackhist.wasp | ||||||||||||||||||||
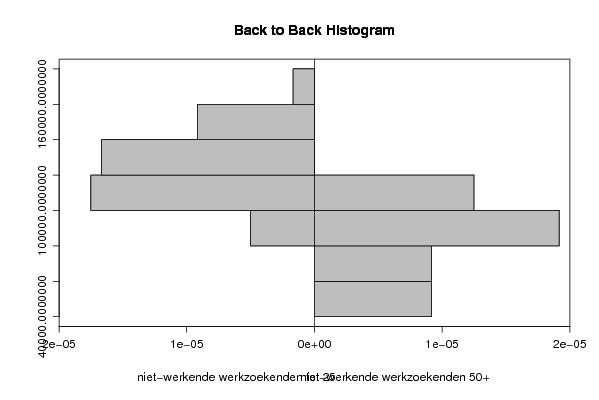
| Title produced by software | Back to Back Histogram | ||||||||||||||||||||
| Date of computation | Mon, 20 Oct 2008 15:51:13 -0600 | ||||||||||||||||||||
| Cite this page as follows | Statistical Computations at FreeStatistics.org, Office for Research Development and Education, URL https://freestatistics.org/blog/index.php?v=date/2008/Oct/20/t12245395138a55qwlcbjwodex.htm/, Retrieved Sun, 19 May 2024 13:07:14 +0000 | ||||||||||||||||||||
| Statistical Computations at FreeStatistics.org, Office for Research Development and Education, URL https://freestatistics.org/blog/index.php?pk=18210, Retrieved Sun, 19 May 2024 13:07:14 +0000 | |||||||||||||||||||||
| QR Codes: | |||||||||||||||||||||
|
| |||||||||||||||||||||
| Original text written by user: | |||||||||||||||||||||
| IsPrivate? | No (this computation is public) | ||||||||||||||||||||
| User-defined keywords | |||||||||||||||||||||
| Estimated Impact | 101 | ||||||||||||||||||||
Tree of Dependent Computations | |||||||||||||||||||||
| Family? (F = Feedback message, R = changed R code, M = changed R Module, P = changed Parameters, D = changed Data) | |||||||||||||||||||||
| F [Back to Back Histogram] [Q8 25 & 50+] [2008-10-20 21:51:13] [d96f761aa3e94002e7c05c3c847d2c79] [Current] | |||||||||||||||||||||
| Feedback Forum | |||||||||||||||||||||
Post a new message | |||||||||||||||||||||
Dataset | |||||||||||||||||||||
| Dataseries X: | |||||||||||||||||||||
157928 147768 137507 136919 136151 133001 125554 119647 114158 116193 152803 161761 160942 149470 139208 134588 130322 126611 122401 117352 112135 112879 148729 157230 157221 146681 136524 132111 125326 122716 116615 113719 110737 112093 143565 149946 149147 134339 122683 115614 116566 111272 104609 101802 94542 93051 124129 130374 123946 114971 105531 104919 104782 101281 94545 93248 84031 87486 115867 120327 | |||||||||||||||||||||
| Dataseries Y: | |||||||||||||||||||||
44277 44976 45406 47379 49200 50221 51573 53091 53337 54978 57885 67099 67169 69796 70600 71982 73957 75273 76322 77078 77954 79238 82179 83834 83744 84861 86478 88290 90287 91230 92380 92506 94172 94728 96581 97344 98346 98214 98366 98768 99832 99976 99961 100164 99964 99304 104008 104644 103950 104263 104241 105141 106018 105866 105944 106379 105082 104915 107026 107306 | |||||||||||||||||||||
Tables (Output of Computation) | |||||||||||||||||||||
| |||||||||||||||||||||
Figures (Output of Computation) | |||||||||||||||||||||
Input Parameters & R Code | |||||||||||||||||||||
| Parameters (Session): | |||||||||||||||||||||
| par1 = grey ; par2 = grey ; par3 = TRUE ; par4 = niet-werkende werkzoekenden tot 25 ; par5 = niet-werkende werkzoekenden 50+ ; | |||||||||||||||||||||
| Parameters (R input): | |||||||||||||||||||||
| par1 = grey ; par2 = grey ; par3 = TRUE ; par4 = niet-werkende werkzoekenden tot 25 ; par5 = niet-werkende werkzoekenden 50+ ; | |||||||||||||||||||||
| R code (references can be found in the software module): | |||||||||||||||||||||
if (par3 == 'TRUE') par3 <- TRUE | |||||||||||||||||||||