Free Statistics
of Irreproducible Research!
Description of Statistical Computation | |||||||||||||||||||||
|---|---|---|---|---|---|---|---|---|---|---|---|---|---|---|---|---|---|---|---|---|---|
| Author's title | |||||||||||||||||||||
| Author | *Unverified author* | ||||||||||||||||||||
| R Software Module | rwasp_backtobackhist.wasp | ||||||||||||||||||||
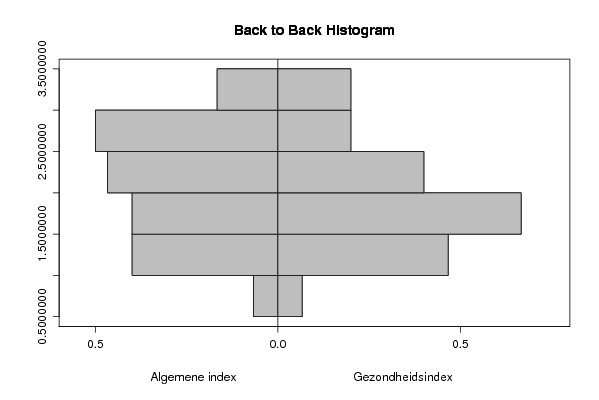
| Title produced by software | Back to Back Histogram | ||||||||||||||||||||
| Date of computation | Mon, 20 Oct 2008 15:08:22 -0600 | ||||||||||||||||||||
| Cite this page as follows | Statistical Computations at FreeStatistics.org, Office for Research Development and Education, URL https://freestatistics.org/blog/index.php?v=date/2008/Oct/20/t1224537051pgfsscpdvgi46v1.htm/, Retrieved Sun, 19 May 2024 15:41:39 +0000 | ||||||||||||||||||||
| Statistical Computations at FreeStatistics.org, Office for Research Development and Education, URL https://freestatistics.org/blog/index.php?pk=18156, Retrieved Sun, 19 May 2024 15:41:39 +0000 | |||||||||||||||||||||
| QR Codes: | |||||||||||||||||||||
|
| |||||||||||||||||||||
| Original text written by user: | |||||||||||||||||||||
| IsPrivate? | No (this computation is public) | ||||||||||||||||||||
| User-defined keywords | |||||||||||||||||||||
| Estimated Impact | 128 | ||||||||||||||||||||
Tree of Dependent Computations | |||||||||||||||||||||
| Family? (F = Feedback message, R = changed R code, M = changed R Module, P = changed Parameters, D = changed Data) | |||||||||||||||||||||
| - [Harrell-Davis Quantiles] [Harrel Davis 95% ...] [2008-10-20 19:54:02] [5305bc6b3d76cda90639c127230e61c1] F RMPD [Back to Back Histogram] [BTB histogram Alg...] [2008-10-20 21:08:22] [0fc8b84b021dde8f76b6764c606a2f06] [Current] F RMPD [Pearson Correlation] [Correlation Algem...] [2008-10-20 21:13:44] [5305bc6b3d76cda90639c127230e61c1] F D [Pearson Correlation] [Correlatie Algeme...] [2008-10-20 21:16:34] [5305bc6b3d76cda90639c127230e61c1] F D [Pearson Correlation] [Correlatie Gezond...] [2008-10-20 21:21:23] [5305bc6b3d76cda90639c127230e61c1] F D [Pearson Correlation] [Correlation Gezon...] [2008-10-20 21:24:45] [5305bc6b3d76cda90639c127230e61c1] | |||||||||||||||||||||
| Feedback Forum | |||||||||||||||||||||
Post a new message | |||||||||||||||||||||
Dataset | |||||||||||||||||||||
| Dataseries X: | |||||||||||||||||||||
2,2 2,3 2,1 2,8 3,1 2,9 2,6 2,7 2,3 2,3 2,1 2,2 2,9 2,6 2,7 1,8 1,3 0,9 1,3 1,3 1,3 1,3 1,1 1,4 1,2 1,7 1,8 1,5 1 1,6 1,5 1,8 1,8 1,6 1,9 1,7 1,6 1,3 1,1 1,9 2,6 2,3 2,4 2,2 2 2,9 2,6 2,3 2,3 2,6 3,1 2,8 2,5 2,9 3,1 3,1 3,2 2,5 2,6 2,9 | |||||||||||||||||||||
| Dataseries Y: | |||||||||||||||||||||
2,1 2,2 2,2 2,7 3,1 3,2 3,1 3,1 2,8 3 2,8 2,7 3,2 3,1 3 2 1,7 1,2 1,4 1,3 1,3 1,1 0,9 1,2 0,9 1,3 1,4 1,5 1,1 1,6 1,5 1,6 1,7 1,6 1,7 1,6 1,6 1,3 1,1 1,6 1,9 1,6 1,7 1,6 1,4 2,1 1,9 1,7 1,8 2 2,5 2,1 2,1 2,3 2,4 2,4 2,3 1,7 2 2,3 | |||||||||||||||||||||
Tables (Output of Computation) | |||||||||||||||||||||
| |||||||||||||||||||||
Figures (Output of Computation) | |||||||||||||||||||||
Input Parameters & R Code | |||||||||||||||||||||
| Parameters (Session): | |||||||||||||||||||||
| par1 = grey ; par2 = grey ; par3 = TRUE ; par4 = Algemene index ; par5 = Gezondheidsindex ; | |||||||||||||||||||||
| Parameters (R input): | |||||||||||||||||||||
| par1 = grey ; par2 = grey ; par3 = TRUE ; par4 = Algemene index ; par5 = Gezondheidsindex ; | |||||||||||||||||||||
| R code (references can be found in the software module): | |||||||||||||||||||||
if (par3 == 'TRUE') par3 <- TRUE | |||||||||||||||||||||