Free Statistics

of Irreproducible Research!

Author's title

Author*Unverified author*
R Software Modulerwasp_histogram.wasp
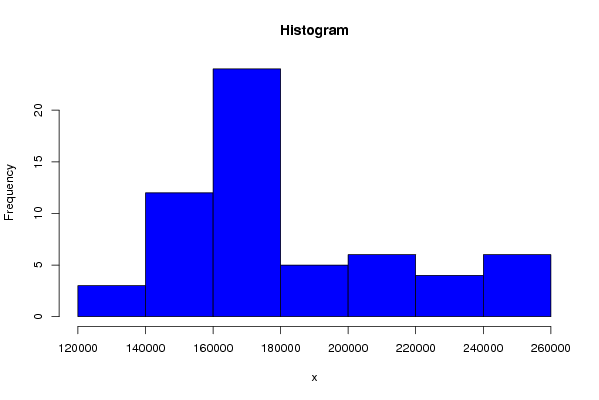
Title produced by softwareHistogram
Date of computationMon, 20 Oct 2008 14:55:49 -0600
Cite this page as followsStatistical Computations at FreeStatistics.org, Office for Research Development and Education, URL https://freestatistics.org/blog/index.php?v=date/2008/Oct/20/t1224536204zbnc18mvnynwj4c.htm/, Retrieved Sun, 19 May 2024 15:22:08 +0000
Statistical Computations at FreeStatistics.org, Office for Research Development and Education, URL https://freestatistics.org/blog/index.php?pk=18139, Retrieved Sun, 19 May 2024 15:22:08 +0000
QR Codes:

Original text written by user:
IsPrivate?No (this computation is public)
User-defined keywords
Estimated Impact108
Family? (F = Feedback message, R = changed R code, M = changed R Module, P = changed Parameters, D = changed Data)
F       [Histogram] [histogram kolom 1...] [2008-10-20 20:55:49] [e81ac192d6ae6d77191d83851a692999] [Current]
Feedback Forum
2008-10-24 12:20:32 [Kim Wester] [reply
Correct. Wellicht dat u de titel had kunnen aanpassen.

Post a new message
Dataseries X:
136088
134858
135998
148719
152125
149825
145065
144940
150683
149678
148957
153314
159109
158653
158054
162421
167026
167581
169255
168718
176984
173170
169821
173700
172552
171853
171087
171508
173323
169977
171670
171645
175267
173860
174767
174839
174577
171196
178204
184869
186326
185203
189578
194721
201484
200504
210832
212925
219381
215688
222266
227621
235098
235932
243127
246454
253324
248665
251207
258043


Summary of computational transaction
Raw Inputview raw input (R code)
Raw Outputview raw output of R engine
Computing time1 seconds
R Server'Gwilym Jenkins' @ 72.249.127.135

\begin{tabular}{lllllllll}
\hline
Summary of computational transaction \tabularnewline
Raw Input & view raw input (R code)  \tabularnewline
Raw Output & view raw output of R engine  \tabularnewline
Computing time & 1 seconds \tabularnewline
R Server & 'Gwilym Jenkins' @ 72.249.127.135 \tabularnewline
\hline
\end{tabular}
%Source: https://freestatistics.org/blog/index.php?pk=18139&T=0

[TABLE]
[ROW][C]Summary of computational transaction[/C][/ROW]
[ROW][C]Raw Input[/C][C]view raw input (R code) [/C][/ROW]
[ROW][C]Raw Output[/C][C]view raw output of R engine [/C][/ROW]
[ROW][C]Computing time[/C][C]1 seconds[/C][/ROW]
[ROW][C]R Server[/C][C]'Gwilym Jenkins' @ 72.249.127.135[/C][/ROW]
[/TABLE]
Source: https://freestatistics.org/blog/index.php?pk=18139&T=0

Globally Unique Identifier (entire table): ba.freestatistics.org/blog/index.php?pk=18139&T=0

As an alternative you can also use a QR Code:  

The GUIDs for individual cells are displayed in the table below:

Summary of computational transaction
Raw Inputview raw input (R code)
Raw Outputview raw output of R engine
Computing time1 seconds
R Server'Gwilym Jenkins' @ 72.249.127.135


Frequency Table (Histogram)
BinsMidpointAbs. FrequencyRel. FrequencyCumul. Rel. Freq.Density
[120000,140000[13000030.050.053e-06
[140000,160000[150000120.20.251e-05
[160000,180000[170000240.40.652e-05
[180000,2e+05[19000050.0833330.7333334e-06
[2e+05,220000[21000060.10.8333335e-06
[220000,240000[23000040.0666670.93e-06
[240000,260000]25000060.115e-06

\begin{tabular}{lllllllll}
\hline
Frequency Table (Histogram) \tabularnewline
Bins & Midpoint & Abs. Frequency & Rel. Frequency & Cumul. Rel. Freq. & Density \tabularnewline
[120000,140000[ & 130000 & 3 & 0.05 & 0.05 & 3e-06 \tabularnewline
[140000,160000[ & 150000 & 12 & 0.2 & 0.25 & 1e-05 \tabularnewline
[160000,180000[ & 170000 & 24 & 0.4 & 0.65 & 2e-05 \tabularnewline
[180000,2e+05[ & 190000 & 5 & 0.083333 & 0.733333 & 4e-06 \tabularnewline
[2e+05,220000[ & 210000 & 6 & 0.1 & 0.833333 & 5e-06 \tabularnewline
[220000,240000[ & 230000 & 4 & 0.066667 & 0.9 & 3e-06 \tabularnewline
[240000,260000] & 250000 & 6 & 0.1 & 1 & 5e-06 \tabularnewline
\hline
\end{tabular}
%Source: https://freestatistics.org/blog/index.php?pk=18139&T=1

[TABLE]
[ROW][C]Frequency Table (Histogram)[/C][/ROW]
[ROW][C]Bins[/C][C]Midpoint[/C][C]Abs. Frequency[/C][C]Rel. Frequency[/C][C]Cumul. Rel. Freq.[/C][C]Density[/C][/ROW]
[ROW][C][120000,140000[[/C][C]130000[/C][C]3[/C][C]0.05[/C][C]0.05[/C][C]3e-06[/C][/ROW]
[ROW][C][140000,160000[[/C][C]150000[/C][C]12[/C][C]0.2[/C][C]0.25[/C][C]1e-05[/C][/ROW]
[ROW][C][160000,180000[[/C][C]170000[/C][C]24[/C][C]0.4[/C][C]0.65[/C][C]2e-05[/C][/ROW]
[ROW][C][180000,2e+05[[/C][C]190000[/C][C]5[/C][C]0.083333[/C][C]0.733333[/C][C]4e-06[/C][/ROW]
[ROW][C][2e+05,220000[[/C][C]210000[/C][C]6[/C][C]0.1[/C][C]0.833333[/C][C]5e-06[/C][/ROW]
[ROW][C][220000,240000[[/C][C]230000[/C][C]4[/C][C]0.066667[/C][C]0.9[/C][C]3e-06[/C][/ROW]
[ROW][C][240000,260000][/C][C]250000[/C][C]6[/C][C]0.1[/C][C]1[/C][C]5e-06[/C][/ROW]
[/TABLE]
Source: https://freestatistics.org/blog/index.php?pk=18139&T=1

Globally Unique Identifier (entire table): ba.freestatistics.org/blog/index.php?pk=18139&T=1

As an alternative you can also use a QR Code:  

The GUIDs for individual cells are displayed in the table below:

Frequency Table (Histogram)
BinsMidpointAbs. FrequencyRel. FrequencyCumul. Rel. Freq.Density
[120000,140000[13000030.050.053e-06
[140000,160000[150000120.20.251e-05
[160000,180000[170000240.40.652e-05
[180000,2e+05[19000050.0833330.7333334e-06
[2e+05,220000[21000060.10.8333335e-06
[220000,240000[23000040.0666670.93e-06
[240000,260000]25000060.115e-06


Parameters (Session):
par2 = blue ; par3 = FALSE ; par4 = Unknown ;
Parameters (R input):
par1 = ; par2 = blue ; par3 = FALSE ; par4 = Unknown ;
R code (references can be found in the software module):
par1 <- as.numeric(par1)
if (par3 == 'TRUE') par3 <- TRUE
if (par3 == 'FALSE') par3 <- FALSE
if (par4 == 'Unknown') par1 <- as.numeric(par1)
if (par4 == 'Interval/Ratio') par1 <- as.numeric(par1)
if (par4 == '3-point Likert') par1 <- c(1:3 - 0.5, 3.5)
if (par4 == '4-point Likert') par1 <- c(1:4 - 0.5, 4.5)
if (par4 == '5-point Likert') par1 <- c(1:5 - 0.5, 5.5)
if (par4 == '6-point Likert') par1 <- c(1:6 - 0.5, 6.5)
if (par4 == '7-point Likert') par1 <- c(1:7 - 0.5, 7.5)
if (par4 == '8-point Likert') par1 <- c(1:8 - 0.5, 8.5)
if (par4 == '9-point Likert') par1 <- c(1:9 - 0.5, 9.5)
if (par4 == '10-point Likert') par1 <- c(1:10 - 0.5, 10.5)
bitmap(file='test1.png')
if (is.na(par1)) {
myhist<-hist(x,col=par2,main=main,xlab=xlab,right=par3)
} else {
if (par1 < 0) par1 <- 3
if (par1 > 50) par1 <- 50
myhist<-hist(x,breaks=par1,col=par2,main=main,xlab=xlab,right=par3)
}
dev.off()
myhist
n <- length(x)
load(file='createtable')
a<-table.start()
a<-table.row.start(a)
a<-table.element(a,hyperlink('histogram.htm','Frequency Table (Histogram)',''),6,TRUE)
a<-table.row.end(a)
a<-table.row.start(a)
a<-table.element(a,'Bins',header=TRUE)
a<-table.element(a,'Midpoint',header=TRUE)
a<-table.element(a,'Abs. Frequency',header=TRUE)
a<-table.element(a,'Rel. Frequency',header=TRUE)
a<-table.element(a,'Cumul. Rel. Freq.',header=TRUE)
a<-table.element(a,'Density',header=TRUE)
a<-table.row.end(a)
crf <- 0
if (par3 == FALSE) mybracket <- '[' else mybracket <- ']'
mynumrows <- (length(myhist$breaks)-1)
for (i in 1:mynumrows) {
a<-table.row.start(a)
if (i == 1)
dum <- paste('[',myhist$breaks[i],sep='')
else
dum <- paste(mybracket,myhist$breaks[i],sep='')
dum <- paste(dum,myhist$breaks[i+1],sep=',')
if (i==mynumrows)
dum <- paste(dum,']',sep='')
else
dum <- paste(dum,mybracket,sep='')
a<-table.element(a,dum,header=TRUE)
a<-table.element(a,myhist$mids[i])
a<-table.element(a,myhist$counts[i])
rf <- myhist$counts[i]/n
crf <- crf + rf
a<-table.element(a,round(rf,6))
a<-table.element(a,round(crf,6))
a<-table.element(a,round(myhist$density[i],6))
a<-table.row.end(a)
}
a<-table.end(a)
table.save(a,file='mytable.tab')