Free Statistics

of Irreproducible Research!

Author's title

Author*Unverified author*
R Software Modulerwasp_histogram.wasp
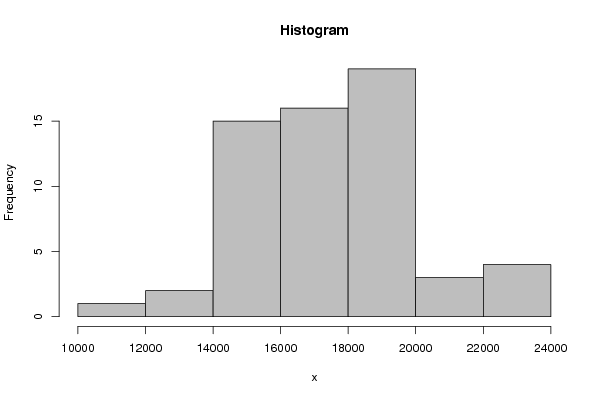
Title produced by softwareHistogram
Date of computationMon, 20 Oct 2008 14:47:31 -0600
Cite this page as followsStatistical Computations at FreeStatistics.org, Office for Research Development and Education, URL https://freestatistics.org/blog/index.php?v=date/2008/Oct/20/t1224535742dmms1vsrj3qa0y6.htm/, Retrieved Wed, 29 May 2024 02:33:10 +0000
Statistical Computations at FreeStatistics.org, Office for Research Development and Education, URL https://freestatistics.org/blog/index.php?pk=18120, Retrieved Wed, 29 May 2024 02:33:10 +0000
QR Codes:

Original text written by user:
IsPrivate?No (this computation is public)
User-defined keywords
Estimated Impact108
Family? (F = Feedback message, R = changed R code, M = changed R Module, P = changed Parameters, D = changed Data)
F       [Histogram] [Histogram tijdree...] [2008-10-20 20:47:31] [14a75ec03b2c0d8ddd8b141a7b1594fd] [Current]
Feedback Forum
2008-10-23 20:18:18 [Kenny Simons] [reply
Zoals je ziet is dit histogram ongeveer symmetrisch verdeeld met een kleine uitschieter aan de rechterkant. Verder heeft het een korte staart, hierdoor gaat het rekenkundig gemiddelde niet zo ver liggen van de mediaan.
2008-10-27 11:02:50 [Joris Deboel] [reply
Hier kan ik enkel op zeggen dat de berekeningen en uitleg correct is maar er zijn echter nog andere descriptieve technieken waarbij je meerdere dingen te weten komt. Je hebt dus maar een beperkte informatie door deze techniek te gebruiken.

Post a new message
Dataseries X:
14433,5
13691,5
14194,1
13519,2
11857,9
14616
15643,4
14077,3
14887,5
14159,9
14643
17192,4
15386,1
14287,1
17526,6
14497
14398,3
16629,6
16670,7
16614,8
16869,2
15663,9
16359,9
18447,7
16889
16505
18320,9
15052,1
15699,8
18135,3
16768,7
18883
19021
18101,9
17776,1
21489,9
17065,3
18690
18953,1
16398,9
16895,6
18553
19270
19422,1
17579,4
18637,3
18076,7
20438,6
18075,2
19563
19899,2
19227,5
17789,6
19220,8
22058,6
21230,8
19504,4
23913,1
23165,7
23574,3


Summary of computational transaction
Raw Inputview raw input (R code)
Raw Outputview raw output of R engine
Computing time2 seconds
R Server'Sir Ronald Aylmer Fisher' @ 193.190.124.24

\begin{tabular}{lllllllll}
\hline
Summary of computational transaction \tabularnewline
Raw Input & view raw input (R code)  \tabularnewline
Raw Output & view raw output of R engine  \tabularnewline
Computing time & 2 seconds \tabularnewline
R Server & 'Sir Ronald Aylmer Fisher' @ 193.190.124.24 \tabularnewline
\hline
\end{tabular}
%Source: https://freestatistics.org/blog/index.php?pk=18120&T=0

[TABLE]
[ROW][C]Summary of computational transaction[/C][/ROW]
[ROW][C]Raw Input[/C][C]view raw input (R code) [/C][/ROW]
[ROW][C]Raw Output[/C][C]view raw output of R engine [/C][/ROW]
[ROW][C]Computing time[/C][C]2 seconds[/C][/ROW]
[ROW][C]R Server[/C][C]'Sir Ronald Aylmer Fisher' @ 193.190.124.24[/C][/ROW]
[/TABLE]
Source: https://freestatistics.org/blog/index.php?pk=18120&T=0

Globally Unique Identifier (entire table): ba.freestatistics.org/blog/index.php?pk=18120&T=0

As an alternative you can also use a QR Code:  

The GUIDs for individual cells are displayed in the table below:

Summary of computational transaction
Raw Inputview raw input (R code)
Raw Outputview raw output of R engine
Computing time2 seconds
R Server'Sir Ronald Aylmer Fisher' @ 193.190.124.24


Frequency Table (Histogram)
BinsMidpointAbs. FrequencyRel. FrequencyCumul. Rel. Freq.Density
[10000,12000[1100010.0166670.0166678e-06
[12000,14000[1300020.0333330.051.7e-05
[14000,16000[15000150.250.30.000125
[16000,18000[17000160.2666670.5666670.000133
[18000,20000[19000190.3166670.8833330.000158
[20000,22000[2100030.050.9333332.5e-05
[22000,24000]2300040.06666713.3e-05

\begin{tabular}{lllllllll}
\hline
Frequency Table (Histogram) \tabularnewline
Bins & Midpoint & Abs. Frequency & Rel. Frequency & Cumul. Rel. Freq. & Density \tabularnewline
[10000,12000[ & 11000 & 1 & 0.016667 & 0.016667 & 8e-06 \tabularnewline
[12000,14000[ & 13000 & 2 & 0.033333 & 0.05 & 1.7e-05 \tabularnewline
[14000,16000[ & 15000 & 15 & 0.25 & 0.3 & 0.000125 \tabularnewline
[16000,18000[ & 17000 & 16 & 0.266667 & 0.566667 & 0.000133 \tabularnewline
[18000,20000[ & 19000 & 19 & 0.316667 & 0.883333 & 0.000158 \tabularnewline
[20000,22000[ & 21000 & 3 & 0.05 & 0.933333 & 2.5e-05 \tabularnewline
[22000,24000] & 23000 & 4 & 0.066667 & 1 & 3.3e-05 \tabularnewline
\hline
\end{tabular}
%Source: https://freestatistics.org/blog/index.php?pk=18120&T=1

[TABLE]
[ROW][C]Frequency Table (Histogram)[/C][/ROW]
[ROW][C]Bins[/C][C]Midpoint[/C][C]Abs. Frequency[/C][C]Rel. Frequency[/C][C]Cumul. Rel. Freq.[/C][C]Density[/C][/ROW]
[ROW][C][10000,12000[[/C][C]11000[/C][C]1[/C][C]0.016667[/C][C]0.016667[/C][C]8e-06[/C][/ROW]
[ROW][C][12000,14000[[/C][C]13000[/C][C]2[/C][C]0.033333[/C][C]0.05[/C][C]1.7e-05[/C][/ROW]
[ROW][C][14000,16000[[/C][C]15000[/C][C]15[/C][C]0.25[/C][C]0.3[/C][C]0.000125[/C][/ROW]
[ROW][C][16000,18000[[/C][C]17000[/C][C]16[/C][C]0.266667[/C][C]0.566667[/C][C]0.000133[/C][/ROW]
[ROW][C][18000,20000[[/C][C]19000[/C][C]19[/C][C]0.316667[/C][C]0.883333[/C][C]0.000158[/C][/ROW]
[ROW][C][20000,22000[[/C][C]21000[/C][C]3[/C][C]0.05[/C][C]0.933333[/C][C]2.5e-05[/C][/ROW]
[ROW][C][22000,24000][/C][C]23000[/C][C]4[/C][C]0.066667[/C][C]1[/C][C]3.3e-05[/C][/ROW]
[/TABLE]
Source: https://freestatistics.org/blog/index.php?pk=18120&T=1

Globally Unique Identifier (entire table): ba.freestatistics.org/blog/index.php?pk=18120&T=1

As an alternative you can also use a QR Code:  

The GUIDs for individual cells are displayed in the table below:

Frequency Table (Histogram)
BinsMidpointAbs. FrequencyRel. FrequencyCumul. Rel. Freq.Density
[10000,12000[1100010.0166670.0166678e-06
[12000,14000[1300020.0333330.051.7e-05
[14000,16000[15000150.250.30.000125
[16000,18000[17000160.2666670.5666670.000133
[18000,20000[19000190.3166670.8833330.000158
[20000,22000[2100030.050.9333332.5e-05
[22000,24000]2300040.06666713.3e-05


Parameters (Session):
par2 = grey ; par3 = FALSE ; par4 = Unknown ;
Parameters (R input):
par1 = ; par2 = grey ; par3 = FALSE ; par4 = Unknown ;
R code (references can be found in the software module):
par1 <- as.numeric(par1)
if (par3 == 'TRUE') par3 <- TRUE
if (par3 == 'FALSE') par3 <- FALSE
if (par4 == 'Unknown') par1 <- as.numeric(par1)
if (par4 == 'Interval/Ratio') par1 <- as.numeric(par1)
if (par4 == '3-point Likert') par1 <- c(1:3 - 0.5, 3.5)
if (par4 == '4-point Likert') par1 <- c(1:4 - 0.5, 4.5)
if (par4 == '5-point Likert') par1 <- c(1:5 - 0.5, 5.5)
if (par4 == '6-point Likert') par1 <- c(1:6 - 0.5, 6.5)
if (par4 == '7-point Likert') par1 <- c(1:7 - 0.5, 7.5)
if (par4 == '8-point Likert') par1 <- c(1:8 - 0.5, 8.5)
if (par4 == '9-point Likert') par1 <- c(1:9 - 0.5, 9.5)
if (par4 == '10-point Likert') par1 <- c(1:10 - 0.5, 10.5)
bitmap(file='test1.png')
if (is.na(par1)) {
myhist<-hist(x,col=par2,main=main,xlab=xlab,right=par3)
} else {
if (par1 < 0) par1 <- 3
if (par1 > 50) par1 <- 50
myhist<-hist(x,breaks=par1,col=par2,main=main,xlab=xlab,right=par3)
}
dev.off()
myhist
n <- length(x)
load(file='createtable')
a<-table.start()
a<-table.row.start(a)
a<-table.element(a,hyperlink('histogram.htm','Frequency Table (Histogram)',''),6,TRUE)
a<-table.row.end(a)
a<-table.row.start(a)
a<-table.element(a,'Bins',header=TRUE)
a<-table.element(a,'Midpoint',header=TRUE)
a<-table.element(a,'Abs. Frequency',header=TRUE)
a<-table.element(a,'Rel. Frequency',header=TRUE)
a<-table.element(a,'Cumul. Rel. Freq.',header=TRUE)
a<-table.element(a,'Density',header=TRUE)
a<-table.row.end(a)
crf <- 0
if (par3 == FALSE) mybracket <- '[' else mybracket <- ']'
mynumrows <- (length(myhist$breaks)-1)
for (i in 1:mynumrows) {
a<-table.row.start(a)
if (i == 1)
dum <- paste('[',myhist$breaks[i],sep='')
else
dum <- paste(mybracket,myhist$breaks[i],sep='')
dum <- paste(dum,myhist$breaks[i+1],sep=',')
if (i==mynumrows)
dum <- paste(dum,']',sep='')
else
dum <- paste(dum,mybracket,sep='')
a<-table.element(a,dum,header=TRUE)
a<-table.element(a,myhist$mids[i])
a<-table.element(a,myhist$counts[i])
rf <- myhist$counts[i]/n
crf <- crf + rf
a<-table.element(a,round(rf,6))
a<-table.element(a,round(crf,6))
a<-table.element(a,round(myhist$density[i],6))
a<-table.row.end(a)
}
a<-table.end(a)
table.save(a,file='mytable.tab')