Free Statistics

of Irreproducible Research!

Author's title

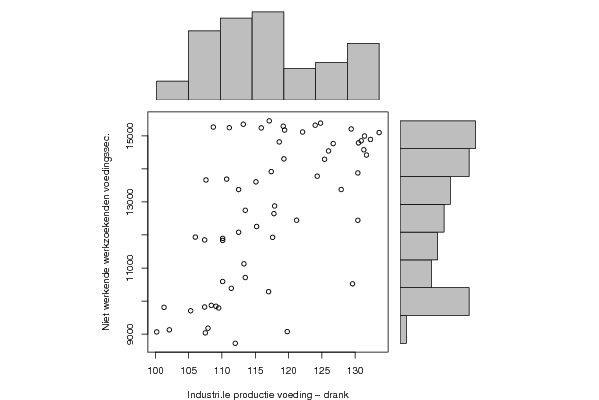
Correlatie industriële productie voeding - drank en niet werkende werkzoeke...

Author*The author of this computation has been verified*
R Software Modulerwasp_correlation.wasp
Title produced by softwarePearson Correlation
Date of computationMon, 20 Oct 2008 14:03:20 -0600
Cite this page as followsStatistical Computations at FreeStatistics.org, Office for Research Development and Education, URL https://freestatistics.org/blog/index.php?v=date/2008/Oct/20/t1224533100dnwwwfy819su891.htm/, Retrieved Sun, 19 May 2024 13:32:31 +0000
Statistical Computations at FreeStatistics.org, Office for Research Development and Education, URL https://freestatistics.org/blog/index.php?pk=18044, Retrieved Sun, 19 May 2024 13:32:31 +0000
QR Codes:

Original text written by user:
IsPrivate?No (this computation is public)
User-defined keywords
Estimated Impact109
Family? (F = Feedback message, R = changed R code, M = changed R Module, P = changed Parameters, D = changed Data)
-     [Pearson Correlation] [Investigating ass...] [2007-10-22 22:08:56] [8cd6641b921d30ebe00b648d1481bba0]
-    D    [Pearson Correlation] [Correlatie indust...] [2008-10-20 20:03:20] [382e90e66f02be5ed86892bdc1574692] [Current]
Feedback Forum

Post a new message
Dataseries X:
100,2
107,9
107,5
119,8
112
102,1
105,3
101,3
108,4
107,4
109,1
109,5
111,4
110,1
117
129,6
113,5
113,3
110,1
107,4
110,1
112,5
106
117,6
117,8
113,5
121,2
130,4
115,2
117,9
110,7
107,6
124,3
115,1
112,5
127,9
117,4
119,3
130,4
126
125,4
130,5
115,9
108,7
124
119,4
118,6
131,3
111,1
124,8
132,3
126,7
131,7
130,9
122,1
113,2
133,6
119,2
129,4
131,4
117,1
Dataseries Y:
9066
9180
9037
9076
8722
9129
9707
9810
9869
9820
9842
9791
10386
10593
10285
10521
10712
11127
11836
11850
11897
12082
11936
11928
12646
12747
12447
12445
12257
12878
13690
13665
13780
13608
13375
13376
13918
14304
13877
14543
14291
14788
15241
15265
15322
15175
14817
14579
15247
15385
14891
14766
14420
14850
15117
15352
15099
15291
15208
14995
15454


Summary of computational transaction
Raw Inputview raw input (R code)
Raw Outputview raw output of R engine
Computing time2 seconds
R Server'Sir Ronald Aylmer Fisher' @ 193.190.124.24

\begin{tabular}{lllllllll}
\hline
Summary of computational transaction \tabularnewline
Raw Input & view raw input (R code)  \tabularnewline
Raw Output & view raw output of R engine  \tabularnewline
Computing time & 2 seconds \tabularnewline
R Server & 'Sir Ronald Aylmer Fisher' @ 193.190.124.24 \tabularnewline
\hline
\end{tabular}
%Source: https://freestatistics.org/blog/index.php?pk=18044&T=0

[TABLE]
[ROW][C]Summary of computational transaction[/C][/ROW]
[ROW][C]Raw Input[/C][C]view raw input (R code) [/C][/ROW]
[ROW][C]Raw Output[/C][C]view raw output of R engine [/C][/ROW]
[ROW][C]Computing time[/C][C]2 seconds[/C][/ROW]
[ROW][C]R Server[/C][C]'Sir Ronald Aylmer Fisher' @ 193.190.124.24[/C][/ROW]
[/TABLE]
Source: https://freestatistics.org/blog/index.php?pk=18044&T=0

Globally Unique Identifier (entire table): ba.freestatistics.org/blog/index.php?pk=18044&T=0

As an alternative you can also use a QR Code:  

The GUIDs for individual cells are displayed in the table below:

Summary of computational transaction
Raw Inputview raw input (R code)
Raw Outputview raw output of R engine
Computing time2 seconds
R Server'Sir Ronald Aylmer Fisher' @ 193.190.124.24


Pearson Product Moment Correlation - Ungrouped Data
StatisticVariable XVariable Y
Mean117.27213114754112742.8032786885
Biased Variance79.84332168771844772525.17441548
Biased Standard Deviation8.935509033497662184.61098926456
Covariance12282.5860928962
Correlation0.61889620568935
Determination0.383032513416675
T-Test6.05219185905654
p-value (2 sided)1.05919948367728e-07
p-value (1 sided)5.29599741838638e-08
Degrees of Freedom59
Number of Observations61

\begin{tabular}{lllllllll}
\hline
Pearson Product Moment Correlation - Ungrouped Data \tabularnewline
Statistic & Variable X & Variable Y \tabularnewline
Mean & 117.272131147541 & 12742.8032786885 \tabularnewline
Biased Variance & 79.8433216877184 & 4772525.17441548 \tabularnewline
Biased Standard Deviation & 8.93550903349766 & 2184.61098926456 \tabularnewline
Covariance & 12282.5860928962 \tabularnewline
Correlation & 0.61889620568935 \tabularnewline
Determination & 0.383032513416675 \tabularnewline
T-Test & 6.05219185905654 \tabularnewline
p-value (2 sided) & 1.05919948367728e-07 \tabularnewline
p-value (1 sided) & 5.29599741838638e-08 \tabularnewline
Degrees of Freedom & 59 \tabularnewline
Number of Observations & 61 \tabularnewline
\hline
\end{tabular}
%Source: https://freestatistics.org/blog/index.php?pk=18044&T=1

[TABLE]
[ROW][C]Pearson Product Moment Correlation - Ungrouped Data[/C][/ROW]
[ROW][C]Statistic[/C][C]Variable X[/C][C]Variable Y[/C][/ROW]
[ROW][C]Mean[/C][C]117.272131147541[/C][C]12742.8032786885[/C][/ROW]
[ROW][C]Biased Variance[/C][C]79.8433216877184[/C][C]4772525.17441548[/C][/ROW]
[ROW][C]Biased Standard Deviation[/C][C]8.93550903349766[/C][C]2184.61098926456[/C][/ROW]
[ROW][C]Covariance[/C][C]12282.5860928962[/C][/ROW]
[ROW][C]Correlation[/C][C]0.61889620568935[/C][/ROW]
[ROW][C]Determination[/C][C]0.383032513416675[/C][/ROW]
[ROW][C]T-Test[/C][C]6.05219185905654[/C][/ROW]
[ROW][C]p-value (2 sided)[/C][C]1.05919948367728e-07[/C][/ROW]
[ROW][C]p-value (1 sided)[/C][C]5.29599741838638e-08[/C][/ROW]
[ROW][C]Degrees of Freedom[/C][C]59[/C][/ROW]
[ROW][C]Number of Observations[/C][C]61[/C][/ROW]
[/TABLE]
Source: https://freestatistics.org/blog/index.php?pk=18044&T=1

Globally Unique Identifier (entire table): ba.freestatistics.org/blog/index.php?pk=18044&T=1

As an alternative you can also use a QR Code:  

The GUIDs for individual cells are displayed in the table below:

Pearson Product Moment Correlation - Ungrouped Data
StatisticVariable XVariable Y
Mean117.27213114754112742.8032786885
Biased Variance79.84332168771844772525.17441548
Biased Standard Deviation8.935509033497662184.61098926456
Covariance12282.5860928962
Correlation0.61889620568935
Determination0.383032513416675
T-Test6.05219185905654
p-value (2 sided)1.05919948367728e-07
p-value (1 sided)5.29599741838638e-08
Degrees of Freedom59
Number of Observations61


Parameters (Session):
Parameters (R input):
R code (references can be found in the software module):
bitmap(file='test1.png')
histx <- hist(x, plot=FALSE)
histy <- hist(y, plot=FALSE)
maxcounts <- max(c(histx$counts, histx$counts))
xrange <- c(min(x),max(x))
yrange <- c(min(y),max(y))
nf <- layout(matrix(c(2,0,1,3),2,2,byrow=TRUE), c(3,1), c(1,3), TRUE)
par(mar=c(4,4,1,1))
plot(x, y, xlim=xrange, ylim=yrange, xlab=xlab, ylab=ylab)
par(mar=c(0,4,1,1))
barplot(histx$counts, axes=FALSE, ylim=c(0, maxcounts), space=0)
par(mar=c(4,0,1,1))
barplot(histy$counts, axes=FALSE, xlim=c(0, maxcounts), space=0, horiz=TRUE)
dev.off()
lx = length(x)
makebiased = (lx-1)/lx
varx = var(x)*makebiased
vary = var(y)*makebiased
corxy <- cor.test(x,y,method='pearson')
cxy <- as.matrix(corxy$estimate)[1,1]
load(file='createtable')
a<-table.start()
a<-table.row.start(a)
a<-table.element(a,'Pearson Product Moment Correlation - Ungrouped Data',3,TRUE)
a<-table.row.end(a)
a<-table.row.start(a)
a<-table.element(a,'Statistic',1,TRUE)
a<-table.element(a,'Variable X',1,TRUE)
a<-table.element(a,'Variable Y',1,TRUE)
a<-table.row.end(a)
a<-table.row.start(a)
a<-table.element(a,hyperlink('arithmetic_mean.htm','Mean',''),header=TRUE)
a<-table.element(a,mean(x))
a<-table.element(a,mean(y))
a<-table.row.end(a)
a<-table.row.start(a)
a<-table.element(a,hyperlink('biased.htm','Biased Variance',''),header=TRUE)
a<-table.element(a,varx)
a<-table.element(a,vary)
a<-table.row.end(a)
a<-table.row.start(a)
a<-table.element(a,hyperlink('biased1.htm','Biased Standard Deviation',''),header=TRUE)
a<-table.element(a,sqrt(varx))
a<-table.element(a,sqrt(vary))
a<-table.row.end(a)
a<-table.row.start(a)
a<-table.element(a,hyperlink('covariance.htm','Covariance',''),header=TRUE)
a<-table.element(a,cov(x,y),2)
a<-table.row.end(a)
a<-table.row.start(a)
a<-table.element(a,hyperlink('pearson_correlation.htm','Correlation',''),header=TRUE)
a<-table.element(a,cxy,2)
a<-table.row.end(a)
a<-table.row.start(a)
a<-table.element(a,hyperlink('coeff_of_determination.htm','Determination',''),header=TRUE)
a<-table.element(a,cxy*cxy,2)
a<-table.row.end(a)
a<-table.row.start(a)
a<-table.element(a,hyperlink('ttest_statistic.htm','T-Test',''),header=TRUE)
a<-table.element(a,as.matrix(corxy$statistic)[1,1],2)
a<-table.row.end(a)
a<-table.row.start(a)
a<-table.element(a,'p-value (2 sided)',header=TRUE)
a<-table.element(a,(p2 <- as.matrix(corxy$p.value)[1,1]),2)
a<-table.row.end(a)
a<-table.row.start(a)
a<-table.element(a,'p-value (1 sided)',header=TRUE)
a<-table.element(a,p2/2,2)
a<-table.row.end(a)
a<-table.row.start(a)
a<-table.element(a,'Degrees of Freedom',header=TRUE)
a<-table.element(a,lx-2,2)
a<-table.row.end(a)
a<-table.row.start(a)
a<-table.element(a,'Number of Observations',header=TRUE)
a<-table.element(a,lx,2)
a<-table.row.end(a)
a<-table.end(a)
table.save(a,file='mytable.tab')