Free Statistics
of Irreproducible Research!
Description of Statistical Computation | |||||||||||||||||||||
|---|---|---|---|---|---|---|---|---|---|---|---|---|---|---|---|---|---|---|---|---|---|
| Author's title | |||||||||||||||||||||
| Author | *The author of this computation has been verified* | ||||||||||||||||||||
| R Software Module | rwasp_backtobackhist.wasp | ||||||||||||||||||||
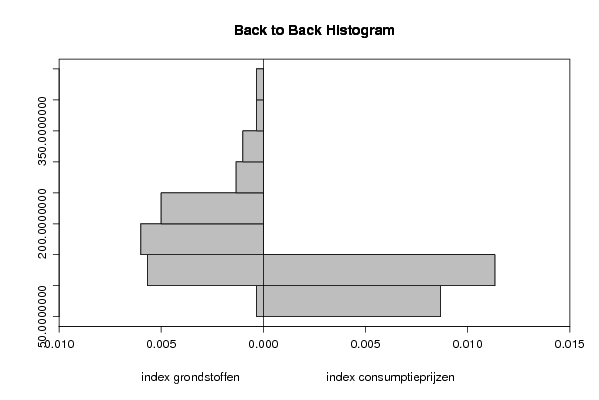
| Title produced by software | Back to Back Histogram | ||||||||||||||||||||
| Date of computation | Mon, 20 Oct 2008 13:54:17 -0600 | ||||||||||||||||||||
| Cite this page as follows | Statistical Computations at FreeStatistics.org, Office for Research Development and Education, URL https://freestatistics.org/blog/index.php?v=date/2008/Oct/20/t12245325889zbm9mvusj8ut7i.htm/, Retrieved Sun, 19 May 2024 16:28:47 +0000 | ||||||||||||||||||||
| Statistical Computations at FreeStatistics.org, Office for Research Development and Education, URL https://freestatistics.org/blog/index.php?pk=18020, Retrieved Sun, 19 May 2024 16:28:47 +0000 | |||||||||||||||||||||
| QR Codes: | |||||||||||||||||||||
|
| |||||||||||||||||||||
| Original text written by user: | |||||||||||||||||||||
| IsPrivate? | No (this computation is public) | ||||||||||||||||||||
| User-defined keywords | |||||||||||||||||||||
| Estimated Impact | 108 | ||||||||||||||||||||
Tree of Dependent Computations | |||||||||||||||||||||
| Family? (F = Feedback message, R = changed R code, M = changed R Module, P = changed Parameters, D = changed Data) | |||||||||||||||||||||
| F [Harrell-Davis Quantiles] [Q7 95% confidence...] [2007-10-20 15:02:46] [b731da8b544846036771bbf9bf2f34ce] - RMPD [Back to Back Histogram] [Vergelijking inde...] [2008-10-20 19:54:17] [63db34dadd44fb018112addcdefe949f] [Current] | |||||||||||||||||||||
| Feedback Forum | |||||||||||||||||||||
Post a new message | |||||||||||||||||||||
Dataset | |||||||||||||||||||||
| Dataseries X: | |||||||||||||||||||||
101 104 99 105 107 111 117 119 127 128 135 132 136 143 142 153 145 138 148 152 169 169 161 174 179 191 190 182 175 181 197 194 197 216 221 218 230 227 204 197 199 208 191 202 211 224 224 231 244 235 250 266 288 283 295 312 334 348 383 407 | |||||||||||||||||||||
| Dataseries Y: | |||||||||||||||||||||
95 96 97 96 96 96 95 97 97 97 98 98 97 98 98 99 99 98 97 99 100 100 100 100 99 101 101 101 101 101 100 102 102 102 103 103 102 103 103 103 103 103 101 104 104 104 104 104 103 105 104 105 106 106 105 107 108 108 109 110 | |||||||||||||||||||||
Tables (Output of Computation) | |||||||||||||||||||||
| |||||||||||||||||||||
Figures (Output of Computation) | |||||||||||||||||||||
Input Parameters & R Code | |||||||||||||||||||||
| Parameters (Session): | |||||||||||||||||||||
| par1 = grey ; par2 = grey ; par3 = TRUE ; par4 = index grondstoffen ; par5 = index consumptieprijzen ; | |||||||||||||||||||||
| Parameters (R input): | |||||||||||||||||||||
| par1 = grey ; par2 = grey ; par3 = TRUE ; par4 = index grondstoffen ; par5 = index consumptieprijzen ; | |||||||||||||||||||||
| R code (references can be found in the software module): | |||||||||||||||||||||
if (par3 == 'TRUE') par3 <- TRUE | |||||||||||||||||||||