Free Statistics

of Irreproducible Research!

Author's title

Author*Unverified author*
R Software Modulerwasp_correlation.wasp
Title produced by softwarePearson Correlation
Date of computationMon, 20 Oct 2008 13:52:20 -0600
Cite this page as followsStatistical Computations at FreeStatistics.org, Office for Research Development and Education, URL https://freestatistics.org/blog/index.php?v=date/2008/Oct/20/t122453242234e76cak286f07j.htm/, Retrieved Sun, 19 May 2024 14:58:00 +0000
Statistical Computations at FreeStatistics.org, Office for Research Development and Education, URL https://freestatistics.org/blog/index.php?pk=18015, Retrieved Sun, 19 May 2024 14:58:00 +0000
QR Codes:

Original text written by user:
IsPrivate?No (this computation is public)
User-defined keywords
Estimated Impact112
Family? (F = Feedback message, R = changed R code, M = changed R Module, P = changed Parameters, D = changed Data)
F       [Pearson Correlation] [Vergelijking kolo...] [2008-10-20 19:52:20] [e81ac192d6ae6d77191d83851a692999] [Current]
Feedback Forum
2008-10-24 12:34:29 [Kim Wester] [reply
Juist.

Post a new message
Dataseries X:
136088
134858
135998
148719
152125
149825
145065
144940
150683
149678
148957
153314
159109
158653
158054
162421
167026
167581
169255
168718
176984
173170
169821
173700
172552
171853
171087
171508
173323
169977
171670
171645
175267
173860
174767
174839
174577
171196
178204
184869
186326
185203
189578
194721
201484
200504
210832
212925
219381
215688
222266
227621
235098
235932
243127
246454
253324
248665
251207
258043
Dataseries Y:
88022
90989
91800
91299
90999
89611
89255
87170
91543
93107
94871
96720
94730
96473
103961
114924
130234
132124
122798
137960
154149
153911
159344
160530
158765
163133
169457
175245
170483
158194
156698
153452
159164
149266
133908
130532
113533
94999
86968
84750
96044
100640
97452
103293
110142
112616
117849
133307
144430
160447
156074
172035
168975
180833
192523
201133
209959
206048
204828
188637


Summary of computational transaction
Raw Inputview raw input (R code)
Raw Outputview raw output of R engine
Computing time2 seconds
R Server'Sir Ronald Aylmer Fisher' @ 193.190.124.24

\begin{tabular}{lllllllll}
\hline
Summary of computational transaction \tabularnewline
Raw Input & view raw input (R code)  \tabularnewline
Raw Output & view raw output of R engine  \tabularnewline
Computing time & 2 seconds \tabularnewline
R Server & 'Sir Ronald Aylmer Fisher' @ 193.190.124.24 \tabularnewline
\hline
\end{tabular}
%Source: https://freestatistics.org/blog/index.php?pk=18015&T=0

[TABLE]
[ROW][C]Summary of computational transaction[/C][/ROW]
[ROW][C]Raw Input[/C][C]view raw input (R code) [/C][/ROW]
[ROW][C]Raw Output[/C][C]view raw output of R engine [/C][/ROW]
[ROW][C]Computing time[/C][C]2 seconds[/C][/ROW]
[ROW][C]R Server[/C][C]'Sir Ronald Aylmer Fisher' @ 193.190.124.24[/C][/ROW]
[/TABLE]
Source: https://freestatistics.org/blog/index.php?pk=18015&T=0

Globally Unique Identifier (entire table): ba.freestatistics.org/blog/index.php?pk=18015&T=0

As an alternative you can also use a QR Code:  

The GUIDs for individual cells are displayed in the table below:

Summary of computational transaction
Raw Inputview raw input (R code)
Raw Outputview raw output of R engine
Computing time2 seconds
R Server'Sir Ronald Aylmer Fisher' @ 193.190.124.24


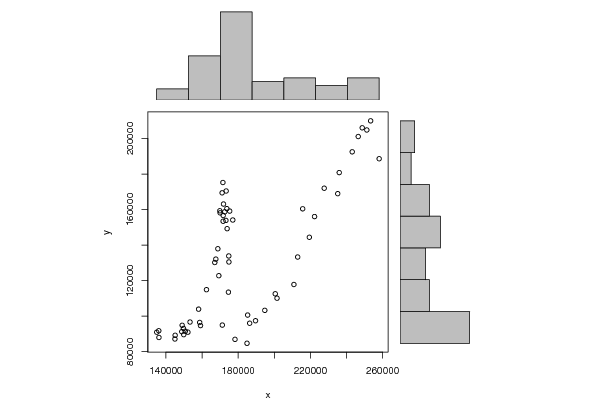
Pearson Product Moment Correlation - Ungrouped Data
StatisticVariable XVariable Y
Mean182905.25132872.266666667
Biased Variance1053459784.954171371425087.96222
Biased Standard Deviation32457.045228334737032.7569587011
Covariance882129017.728814
Correlation0.721668657580492
Determination0.52080565133403
T-Test7.93955199280377
p-value (2 sided)7.73436870105115e-11
p-value (1 sided)3.86718435052558e-11
Degrees of Freedom58
Number of Observations60

\begin{tabular}{lllllllll}
\hline
Pearson Product Moment Correlation - Ungrouped Data \tabularnewline
Statistic & Variable X & Variable Y \tabularnewline
Mean & 182905.25 & 132872.266666667 \tabularnewline
Biased Variance & 1053459784.95417 & 1371425087.96222 \tabularnewline
Biased Standard Deviation & 32457.0452283347 & 37032.7569587011 \tabularnewline
Covariance & 882129017.728814 \tabularnewline
Correlation & 0.721668657580492 \tabularnewline
Determination & 0.52080565133403 \tabularnewline
T-Test & 7.93955199280377 \tabularnewline
p-value (2 sided) & 7.73436870105115e-11 \tabularnewline
p-value (1 sided) & 3.86718435052558e-11 \tabularnewline
Degrees of Freedom & 58 \tabularnewline
Number of Observations & 60 \tabularnewline
\hline
\end{tabular}
%Source: https://freestatistics.org/blog/index.php?pk=18015&T=1

[TABLE]
[ROW][C]Pearson Product Moment Correlation - Ungrouped Data[/C][/ROW]
[ROW][C]Statistic[/C][C]Variable X[/C][C]Variable Y[/C][/ROW]
[ROW][C]Mean[/C][C]182905.25[/C][C]132872.266666667[/C][/ROW]
[ROW][C]Biased Variance[/C][C]1053459784.95417[/C][C]1371425087.96222[/C][/ROW]
[ROW][C]Biased Standard Deviation[/C][C]32457.0452283347[/C][C]37032.7569587011[/C][/ROW]
[ROW][C]Covariance[/C][C]882129017.728814[/C][/ROW]
[ROW][C]Correlation[/C][C]0.721668657580492[/C][/ROW]
[ROW][C]Determination[/C][C]0.52080565133403[/C][/ROW]
[ROW][C]T-Test[/C][C]7.93955199280377[/C][/ROW]
[ROW][C]p-value (2 sided)[/C][C]7.73436870105115e-11[/C][/ROW]
[ROW][C]p-value (1 sided)[/C][C]3.86718435052558e-11[/C][/ROW]
[ROW][C]Degrees of Freedom[/C][C]58[/C][/ROW]
[ROW][C]Number of Observations[/C][C]60[/C][/ROW]
[/TABLE]
Source: https://freestatistics.org/blog/index.php?pk=18015&T=1

Globally Unique Identifier (entire table): ba.freestatistics.org/blog/index.php?pk=18015&T=1

As an alternative you can also use a QR Code:  

The GUIDs for individual cells are displayed in the table below:

Pearson Product Moment Correlation - Ungrouped Data
StatisticVariable XVariable Y
Mean182905.25132872.266666667
Biased Variance1053459784.954171371425087.96222
Biased Standard Deviation32457.045228334737032.7569587011
Covariance882129017.728814
Correlation0.721668657580492
Determination0.52080565133403
T-Test7.93955199280377
p-value (2 sided)7.73436870105115e-11
p-value (1 sided)3.86718435052558e-11
Degrees of Freedom58
Number of Observations60


Parameters (Session):
Parameters (R input):
R code (references can be found in the software module):
bitmap(file='test1.png')
histx <- hist(x, plot=FALSE)
histy <- hist(y, plot=FALSE)
maxcounts <- max(c(histx$counts, histx$counts))
xrange <- c(min(x),max(x))
yrange <- c(min(y),max(y))
nf <- layout(matrix(c(2,0,1,3),2,2,byrow=TRUE), c(3,1), c(1,3), TRUE)
par(mar=c(4,4,1,1))
plot(x, y, xlim=xrange, ylim=yrange, xlab=xlab, ylab=ylab)
par(mar=c(0,4,1,1))
barplot(histx$counts, axes=FALSE, ylim=c(0, maxcounts), space=0)
par(mar=c(4,0,1,1))
barplot(histy$counts, axes=FALSE, xlim=c(0, maxcounts), space=0, horiz=TRUE)
dev.off()
lx = length(x)
makebiased = (lx-1)/lx
varx = var(x)*makebiased
vary = var(y)*makebiased
corxy <- cor.test(x,y,method='pearson')
cxy <- as.matrix(corxy$estimate)[1,1]
load(file='createtable')
a<-table.start()
a<-table.row.start(a)
a<-table.element(a,'Pearson Product Moment Correlation - Ungrouped Data',3,TRUE)
a<-table.row.end(a)
a<-table.row.start(a)
a<-table.element(a,'Statistic',1,TRUE)
a<-table.element(a,'Variable X',1,TRUE)
a<-table.element(a,'Variable Y',1,TRUE)
a<-table.row.end(a)
a<-table.row.start(a)
a<-table.element(a,hyperlink('arithmetic_mean.htm','Mean',''),header=TRUE)
a<-table.element(a,mean(x))
a<-table.element(a,mean(y))
a<-table.row.end(a)
a<-table.row.start(a)
a<-table.element(a,hyperlink('biased.htm','Biased Variance',''),header=TRUE)
a<-table.element(a,varx)
a<-table.element(a,vary)
a<-table.row.end(a)
a<-table.row.start(a)
a<-table.element(a,hyperlink('biased1.htm','Biased Standard Deviation',''),header=TRUE)
a<-table.element(a,sqrt(varx))
a<-table.element(a,sqrt(vary))
a<-table.row.end(a)
a<-table.row.start(a)
a<-table.element(a,hyperlink('covariance.htm','Covariance',''),header=TRUE)
a<-table.element(a,cov(x,y),2)
a<-table.row.end(a)
a<-table.row.start(a)
a<-table.element(a,hyperlink('pearson_correlation.htm','Correlation',''),header=TRUE)
a<-table.element(a,cxy,2)
a<-table.row.end(a)
a<-table.row.start(a)
a<-table.element(a,hyperlink('coeff_of_determination.htm','Determination',''),header=TRUE)
a<-table.element(a,cxy*cxy,2)
a<-table.row.end(a)
a<-table.row.start(a)
a<-table.element(a,hyperlink('ttest_statistic.htm','T-Test',''),header=TRUE)
a<-table.element(a,as.matrix(corxy$statistic)[1,1],2)
a<-table.row.end(a)
a<-table.row.start(a)
a<-table.element(a,'p-value (2 sided)',header=TRUE)
a<-table.element(a,(p2 <- as.matrix(corxy$p.value)[1,1]),2)
a<-table.row.end(a)
a<-table.row.start(a)
a<-table.element(a,'p-value (1 sided)',header=TRUE)
a<-table.element(a,p2/2,2)
a<-table.row.end(a)
a<-table.row.start(a)
a<-table.element(a,'Degrees of Freedom',header=TRUE)
a<-table.element(a,lx-2,2)
a<-table.row.end(a)
a<-table.row.start(a)
a<-table.element(a,'Number of Observations',header=TRUE)
a<-table.element(a,lx,2)
a<-table.row.end(a)
a<-table.end(a)
table.save(a,file='mytable.tab')