Free Statistics

of Irreproducible Research!

Author's title

Author*Unverified author*
R Software Modulerwasp_correlation.wasp
Title produced by softwarePearson Correlation
Date of computationMon, 20 Oct 2008 13:46:39 -0600
Cite this page as followsStatistical Computations at FreeStatistics.org, Office for Research Development and Education, URL https://freestatistics.org/blog/index.php?v=date/2008/Oct/20/t122453203572yp2iybb6yjum9.htm/, Retrieved Sun, 19 May 2024 15:39:59 +0000
Statistical Computations at FreeStatistics.org, Office for Research Development and Education, URL https://freestatistics.org/blog/index.php?pk=18001, Retrieved Sun, 19 May 2024 15:39:59 +0000
QR Codes:

Original text written by user:
IsPrivate?No (this computation is public)
User-defined keywords
Estimated Impact128
Family? (F = Feedback message, R = changed R code, M = changed R Module, P = changed Parameters, D = changed Data)
F     [Central Tendency] [Q1 central tenden...] [2007-10-18 09:35:57] [b731da8b544846036771bbf9bf2f34ce]
F RM D  [Pearson Correlation] [Pearson Correlation] [2008-10-20 11:08:13] [8af599f2ccf50a86f2698320831f9f94]
F    D      [Pearson Correlation] [Verbruik voedings...] [2008-10-20 19:46:39] [6d5cd2fe15d123a10639b4bf141c23b5] [Current]
Feedback Forum
2008-10-27 23:11:01 [Jeroen Michel] [reply
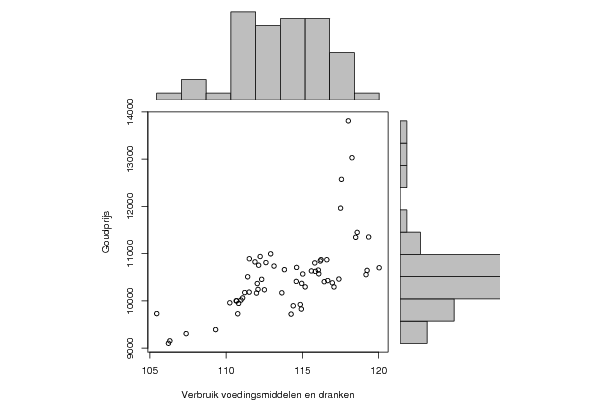
Ook hier maakt de student alleen een grafische voorstelling en worden er geen conclusies getrokken. De grafische voorstellingen daarentegen zijn wel correct.

ook hier verwijs ik weer naar voorgaande links.

zie ook hier:

1)http://www.freestatistics.org/blog/index.php?v=date/2008/Oct/20/t122453111942vvq5w48kufj3c.htm

2)http://www.freestatistics.org/blog/index.php?v=date/2008/Oct/20/t12245313245prfko041cy9ggm.htm

3)http://www.freestatistics.org/blog/index.php?v=date/2008/Oct/20/t12245315975j2g5igzfz3c8ye.htm

Post a new message
Dataseries X:
118.01
118.25
117.56
117.5
118.59
118.49
119.34
120.03
119.24
119.17
117.39
116.43
115.85
116.22
115.81
116.04
116.07
116.66
116.96
117.07
116.6
115.59
115.18
115.02
113.82
114.62
114.6
116.17
114.95
114.86
114.93
114.4
114.26
113.65
113.14
112.61
111.41
112.09
112.04
112.33
111.51
111.99
111.89
112.92
112.23
112.13
111.52
112.51
110.24
110.97
111.08
110.69
110.76
110.66
111.22
110.82
109.31
107.38
106.31
106.22
105.45
Dataseries Y:
13812
13031
12574
11964
11451
11346
11353
10702
10646
10556
10463
10407
10625
10872
10805
10653
10574
10431
10383
10296
10872
10635
10297
10570
10662
10709
10413
10846
10371
9924
9828
9897
9721
10171
10738
10812
10511
10244
10368
10457
10186
10166
10827
10997
10940
10756
10893
10236
9960
10018
10063
10002
9728
10002
10177
9948
9394
9308
9155
9103
9732


Summary of computational transaction
Raw Inputview raw input (R code)
Raw Outputview raw output of R engine
Computing time1 seconds
R Server'Gwilym Jenkins' @ 72.249.127.135

\begin{tabular}{lllllllll}
\hline
Summary of computational transaction \tabularnewline
Raw Input & view raw input (R code)  \tabularnewline
Raw Output & view raw output of R engine  \tabularnewline
Computing time & 1 seconds \tabularnewline
R Server & 'Gwilym Jenkins' @ 72.249.127.135 \tabularnewline
\hline
\end{tabular}
%Source: https://freestatistics.org/blog/index.php?pk=18001&T=0

[TABLE]
[ROW][C]Summary of computational transaction[/C][/ROW]
[ROW][C]Raw Input[/C][C]view raw input (R code) [/C][/ROW]
[ROW][C]Raw Output[/C][C]view raw output of R engine [/C][/ROW]
[ROW][C]Computing time[/C][C]1 seconds[/C][/ROW]
[ROW][C]R Server[/C][C]'Gwilym Jenkins' @ 72.249.127.135[/C][/ROW]
[/TABLE]
Source: https://freestatistics.org/blog/index.php?pk=18001&T=0

Globally Unique Identifier (entire table): ba.freestatistics.org/blog/index.php?pk=18001&T=0

As an alternative you can also use a QR Code:  

The GUIDs for individual cells are displayed in the table below:

Summary of computational transaction
Raw Inputview raw input (R code)
Raw Outputview raw output of R engine
Computing time1 seconds
R Server'Gwilym Jenkins' @ 72.249.127.135


Pearson Product Moment Correlation - Ungrouped Data
StatisticVariable XVariable Y
Mean113.94688524590210534.1147540984
Biased Variance11.3669099704381643991.052405267
Biased Standard Deviation3.37148483170814802.49053103776
Covariance1751.41769672131
Correlation0.636722243860235
Determination0.405415215826412
T-Test6.34262642280264
p-value (2 sided)3.46844486465159e-08
p-value (1 sided)1.73422243232579e-08
Degrees of Freedom59
Number of Observations61

\begin{tabular}{lllllllll}
\hline
Pearson Product Moment Correlation - Ungrouped Data \tabularnewline
Statistic & Variable X & Variable Y \tabularnewline
Mean & 113.946885245902 & 10534.1147540984 \tabularnewline
Biased Variance & 11.3669099704381 & 643991.052405267 \tabularnewline
Biased Standard Deviation & 3.37148483170814 & 802.49053103776 \tabularnewline
Covariance & 1751.41769672131 \tabularnewline
Correlation & 0.636722243860235 \tabularnewline
Determination & 0.405415215826412 \tabularnewline
T-Test & 6.34262642280264 \tabularnewline
p-value (2 sided) & 3.46844486465159e-08 \tabularnewline
p-value (1 sided) & 1.73422243232579e-08 \tabularnewline
Degrees of Freedom & 59 \tabularnewline
Number of Observations & 61 \tabularnewline
\hline
\end{tabular}
%Source: https://freestatistics.org/blog/index.php?pk=18001&T=1

[TABLE]
[ROW][C]Pearson Product Moment Correlation - Ungrouped Data[/C][/ROW]
[ROW][C]Statistic[/C][C]Variable X[/C][C]Variable Y[/C][/ROW]
[ROW][C]Mean[/C][C]113.946885245902[/C][C]10534.1147540984[/C][/ROW]
[ROW][C]Biased Variance[/C][C]11.3669099704381[/C][C]643991.052405267[/C][/ROW]
[ROW][C]Biased Standard Deviation[/C][C]3.37148483170814[/C][C]802.49053103776[/C][/ROW]
[ROW][C]Covariance[/C][C]1751.41769672131[/C][/ROW]
[ROW][C]Correlation[/C][C]0.636722243860235[/C][/ROW]
[ROW][C]Determination[/C][C]0.405415215826412[/C][/ROW]
[ROW][C]T-Test[/C][C]6.34262642280264[/C][/ROW]
[ROW][C]p-value (2 sided)[/C][C]3.46844486465159e-08[/C][/ROW]
[ROW][C]p-value (1 sided)[/C][C]1.73422243232579e-08[/C][/ROW]
[ROW][C]Degrees of Freedom[/C][C]59[/C][/ROW]
[ROW][C]Number of Observations[/C][C]61[/C][/ROW]
[/TABLE]
Source: https://freestatistics.org/blog/index.php?pk=18001&T=1

Globally Unique Identifier (entire table): ba.freestatistics.org/blog/index.php?pk=18001&T=1

As an alternative you can also use a QR Code:  

The GUIDs for individual cells are displayed in the table below:

Pearson Product Moment Correlation - Ungrouped Data
StatisticVariable XVariable Y
Mean113.94688524590210534.1147540984
Biased Variance11.3669099704381643991.052405267
Biased Standard Deviation3.37148483170814802.49053103776
Covariance1751.41769672131
Correlation0.636722243860235
Determination0.405415215826412
T-Test6.34262642280264
p-value (2 sided)3.46844486465159e-08
p-value (1 sided)1.73422243232579e-08
Degrees of Freedom59
Number of Observations61


Parameters (Session):
Parameters (R input):
R code (references can be found in the software module):
bitmap(file='test1.png')
histx <- hist(x, plot=FALSE)
histy <- hist(y, plot=FALSE)
maxcounts <- max(c(histx$counts, histx$counts))
xrange <- c(min(x),max(x))
yrange <- c(min(y),max(y))
nf <- layout(matrix(c(2,0,1,3),2,2,byrow=TRUE), c(3,1), c(1,3), TRUE)
par(mar=c(4,4,1,1))
plot(x, y, xlim=xrange, ylim=yrange, xlab=xlab, ylab=ylab)
par(mar=c(0,4,1,1))
barplot(histx$counts, axes=FALSE, ylim=c(0, maxcounts), space=0)
par(mar=c(4,0,1,1))
barplot(histy$counts, axes=FALSE, xlim=c(0, maxcounts), space=0, horiz=TRUE)
dev.off()
lx = length(x)
makebiased = (lx-1)/lx
varx = var(x)*makebiased
vary = var(y)*makebiased
corxy <- cor.test(x,y,method='pearson')
cxy <- as.matrix(corxy$estimate)[1,1]
load(file='createtable')
a<-table.start()
a<-table.row.start(a)
a<-table.element(a,'Pearson Product Moment Correlation - Ungrouped Data',3,TRUE)
a<-table.row.end(a)
a<-table.row.start(a)
a<-table.element(a,'Statistic',1,TRUE)
a<-table.element(a,'Variable X',1,TRUE)
a<-table.element(a,'Variable Y',1,TRUE)
a<-table.row.end(a)
a<-table.row.start(a)
a<-table.element(a,hyperlink('arithmetic_mean.htm','Mean',''),header=TRUE)
a<-table.element(a,mean(x))
a<-table.element(a,mean(y))
a<-table.row.end(a)
a<-table.row.start(a)
a<-table.element(a,hyperlink('biased.htm','Biased Variance',''),header=TRUE)
a<-table.element(a,varx)
a<-table.element(a,vary)
a<-table.row.end(a)
a<-table.row.start(a)
a<-table.element(a,hyperlink('biased1.htm','Biased Standard Deviation',''),header=TRUE)
a<-table.element(a,sqrt(varx))
a<-table.element(a,sqrt(vary))
a<-table.row.end(a)
a<-table.row.start(a)
a<-table.element(a,hyperlink('covariance.htm','Covariance',''),header=TRUE)
a<-table.element(a,cov(x,y),2)
a<-table.row.end(a)
a<-table.row.start(a)
a<-table.element(a,hyperlink('pearson_correlation.htm','Correlation',''),header=TRUE)
a<-table.element(a,cxy,2)
a<-table.row.end(a)
a<-table.row.start(a)
a<-table.element(a,hyperlink('coeff_of_determination.htm','Determination',''),header=TRUE)
a<-table.element(a,cxy*cxy,2)
a<-table.row.end(a)
a<-table.row.start(a)
a<-table.element(a,hyperlink('ttest_statistic.htm','T-Test',''),header=TRUE)
a<-table.element(a,as.matrix(corxy$statistic)[1,1],2)
a<-table.row.end(a)
a<-table.row.start(a)
a<-table.element(a,'p-value (2 sided)',header=TRUE)
a<-table.element(a,(p2 <- as.matrix(corxy$p.value)[1,1]),2)
a<-table.row.end(a)
a<-table.row.start(a)
a<-table.element(a,'p-value (1 sided)',header=TRUE)
a<-table.element(a,p2/2,2)
a<-table.row.end(a)
a<-table.row.start(a)
a<-table.element(a,'Degrees of Freedom',header=TRUE)
a<-table.element(a,lx-2,2)
a<-table.row.end(a)
a<-table.row.start(a)
a<-table.element(a,'Number of Observations',header=TRUE)
a<-table.element(a,lx,2)
a<-table.row.end(a)
a<-table.end(a)
table.save(a,file='mytable.tab')