Free Statistics

of Irreproducible Research!

Author's title

Tijdreeks 4: Prijscijfers industriële grondstoffen van België - central ten...

Author*The author of this computation has been verified*
R Software Modulerwasp_centraltendency.wasp
Title produced by softwareCentral Tendency
Date of computationMon, 20 Oct 2008 13:40:15 -0600
Cite this page as followsStatistical Computations at FreeStatistics.org, Office for Research Development and Education, URL https://freestatistics.org/blog/index.php?v=date/2008/Oct/20/t1224531673pqjvgu13uhwzfzp.htm/, Retrieved Sun, 19 May 2024 14:09:40 +0000
Statistical Computations at FreeStatistics.org, Office for Research Development and Education, URL https://freestatistics.org/blog/index.php?pk=17988, Retrieved Sun, 19 May 2024 14:09:40 +0000
QR Codes:

Original text written by user:
IsPrivate?No (this computation is public)
User-defined keywords
Estimated Impact130
Family? (F = Feedback message, R = changed R code, M = changed R Module, P = changed Parameters, D = changed Data)
F     [Univariate Data Series] [Tijdsreeks 4] [2008-10-13 19:54:27] [b82ef11dce0545f3fd4676ec3ebed828]
- RMP     [Central Tendency] [Tijdreeks 4: Prij...] [2008-10-20 19:40:15] [4b953869c7238aca4b6e0cfb0c5cddd6] [Current]
Feedback Forum

Post a new message
Dataseries X:
95.4
98.7
99.9
98.6
100.3
100.2
100.4
101.4
103
109.1
111.4
114.1
121.8
127.6
129.9
128
123.5
124
127.4
127.6
128.4
131.4
135.1
134
144.5
147.3
150.9
148.7
141.4
138.9
139.8
145.6
147.9
148.5
151.1
157.5
167.5
172.3
173.5
187.5
205.5
195.1
204.5
204.5
201.7
207
206.6
210.6
211.1
215
223.9
238.2
238.9
229.6
232.2
222.1
221.6
227.3
221
213.6
243.4
253.8
265.3
268.2
268.5
266.9
268.4


Summary of computational transaction
Raw Inputview raw input (R code)
Raw Outputview raw output of R engine
Computing time3 seconds
R Server'George Udny Yule' @ 72.249.76.132

\begin{tabular}{lllllllll}
\hline
Summary of computational transaction \tabularnewline
Raw Input & view raw input (R code)  \tabularnewline
Raw Output & view raw output of R engine  \tabularnewline
Computing time & 3 seconds \tabularnewline
R Server & 'George Udny Yule' @ 72.249.76.132 \tabularnewline
\hline
\end{tabular}
%Source: https://freestatistics.org/blog/index.php?pk=17988&T=0

[TABLE]
[ROW][C]Summary of computational transaction[/C][/ROW]
[ROW][C]Raw Input[/C][C]view raw input (R code) [/C][/ROW]
[ROW][C]Raw Output[/C][C]view raw output of R engine [/C][/ROW]
[ROW][C]Computing time[/C][C]3 seconds[/C][/ROW]
[ROW][C]R Server[/C][C]'George Udny Yule' @ 72.249.76.132[/C][/ROW]
[/TABLE]
Source: https://freestatistics.org/blog/index.php?pk=17988&T=0

Globally Unique Identifier (entire table): ba.freestatistics.org/blog/index.php?pk=17988&T=0

As an alternative you can also use a QR Code:  

The GUIDs for individual cells are displayed in the table below:

Summary of computational transaction
Raw Inputview raw input (R code)
Raw Outputview raw output of R engine
Computing time3 seconds
R Server'George Udny Yule' @ 72.249.76.132


Central Tendency - Ungrouped Data
MeasureValueS.E.Value/S.E.
Arithmetic Mean170.1283582089556.5381501615454726.0208704305349
Geometric Mean161.90060291407
Harmonic Mean154.049776377224
Quadratic Mean178.227346847163
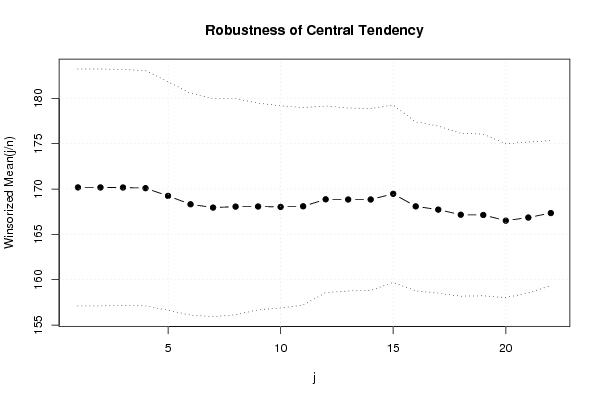
Winsorized Mean ( 1 / 22 )170.1746268656726.5297081744466526.0615975966020
Winsorized Mean ( 2 / 22 )170.1716417910456.5278531389126626.068546299954
Winsorized Mean ( 3 / 22 )170.1671641791046.5058208595691826.1561404551759
Winsorized Mean ( 4 / 22 )170.0895522388066.4815020979072226.2423045876550
Winsorized Mean ( 5 / 22 )169.2388059701496.2973463843514426.8746223632701
Winsorized Mean ( 6 / 22 )168.3164179104486.1143448555245227.5281198374619
Winsorized Mean ( 7 / 22 )167.9507462686576.0109975245266727.9405781791404
Winsorized Mean ( 8 / 22 )168.0582089552245.9642649653882328.1775222815381
Winsorized Mean ( 9 / 22 )168.0716417910455.6914795061264529.5303956748203
Winsorized Mean ( 10 / 22 )168.0268656716425.5724854616423230.1529482361576
Winsorized Mean ( 11 / 22 )168.0925373134335.4422968326121130.8863229043599
Winsorized Mean ( 12 / 22 )168.8626865671645.1432385634874832.831976289403
Winsorized Mean ( 13 / 22 )168.8432835820905.0416287059347833.4898290672089
Winsorized Mean ( 14 / 22 )168.8432835820905.0107321383308133.6963299814975
Winsorized Mean ( 15 / 22 )169.4701492537314.8880252311129934.6704735022703
Winsorized Mean ( 16 / 22 )168.0850746268664.6578803312398236.0861728240505
Winsorized Mean ( 17 / 22 )167.7298507462694.6039616860217536.4316347930347
Winsorized Mean ( 18 / 22 )167.1656716417914.489261297072337.2367880993716
Winsorized Mean ( 19 / 22 )167.1373134328364.4532928759809137.5311748154496
Winsorized Mean ( 20 / 22 )166.5104477611944.2371817681836139.2974521441344
Winsorized Mean ( 21 / 22 )166.8552238805974.1578767258541740.1299112220119
Winsorized Mean ( 22 / 22 )167.3477611940303.9964544203590141.8740572497251
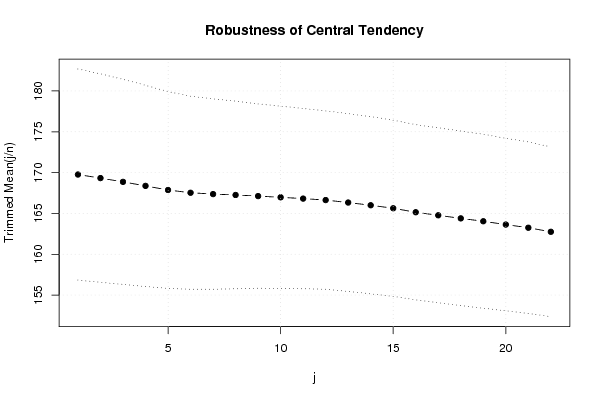
Trimmed Mean ( 1 / 22 )169.7646153846156.4628957365700426.2675776160227
Trimmed Mean ( 2 / 22 )169.3285714285716.3792459946431926.5436654380096
Trimmed Mean ( 3 / 22 )168.8655737704926.2763494337439926.9050624974141
Trimmed Mean ( 4 / 22 )168.3728813559326.1587098310143527.3389859200756
Trimmed Mean ( 5 / 22 )167.8684210526326.0215398439329727.8779889203537
Trimmed Mean ( 6 / 22 )167.5345454545455.9113166696516228.3413247533597
Trimmed Mean ( 7 / 22 )167.3698113207555.8251815502742128.7321193127236
Trimmed Mean ( 8 / 22 )167.2607843137255.7411292722800129.1337777606426
Trimmed Mean ( 9 / 22 )167.1244897959185.6426578706618629.6180441250668
Trimmed Mean ( 10 / 22 )166.9744680851065.57863595946429.9310564981102
Trimmed Mean ( 11 / 22 )166.8177777777785.5173008780268330.2353961594056
Trimmed Mean ( 12 / 22 )166.6372093023265.4596952921192130.5213387169899
Trimmed Mean ( 13 / 22 )166.3341463414635.4403961138022330.5739036022534
Trimmed Mean ( 14 / 22 )166.0025641025645.4234763430338530.6081475428182
Trimmed Mean ( 15 / 22 )165.6351351351355.3923678355725530.716586884609
Trimmed Mean ( 16 / 22 )165.1457142857145.3605959515320930.8073422766576
Trimmed Mean ( 17 / 22 )164.7727272727275.3562574435563630.7626601239921
Trimmed Mean ( 18 / 22 )164.3967741935485.3406344189829330.7822556828101
Trimmed Mean ( 19 / 22 )164.0413793103455.3240127030373430.8116055427065
Trimmed Mean ( 20 / 22 )163.6370370370375.2804270853455530.9893564274695
Trimmed Mean ( 21 / 22 )163.2525.2522316526723531.0824066407918
Trimmed Mean ( 22 / 22 )162.7521739130435.1942917497223731.3328903640698
Median150.9
Midrange181.95
Midmean - Weighted Average at Xnp163.679411764706
Midmean - Weighted Average at X(n+1)p165.145714285714
Midmean - Empirical Distribution Function165.145714285714
Midmean - Empirical Distribution Function - Averaging165.145714285714
Midmean - Empirical Distribution Function - Interpolation163.679411764706
Midmean - Closest Observation163.679411764706
Midmean - True Basic - Statistics Graphics Toolkit165.145714285714
Midmean - MS Excel (old versions)165.145714285714
Number of observations67

\begin{tabular}{lllllllll}
\hline
Central Tendency - Ungrouped Data \tabularnewline
Measure & Value & S.E. & Value/S.E. \tabularnewline
Arithmetic Mean & 170.128358208955 & 6.53815016154547 & 26.0208704305349 \tabularnewline
Geometric Mean & 161.90060291407 &  &  \tabularnewline
Harmonic Mean & 154.049776377224 &  &  \tabularnewline
Quadratic Mean & 178.227346847163 &  &  \tabularnewline
Winsorized Mean ( 1 / 22 ) & 170.174626865672 & 6.52970817444665 & 26.0615975966020 \tabularnewline
Winsorized Mean ( 2 / 22 ) & 170.171641791045 & 6.52785313891266 & 26.068546299954 \tabularnewline
Winsorized Mean ( 3 / 22 ) & 170.167164179104 & 6.50582085956918 & 26.1561404551759 \tabularnewline
Winsorized Mean ( 4 / 22 ) & 170.089552238806 & 6.48150209790722 & 26.2423045876550 \tabularnewline
Winsorized Mean ( 5 / 22 ) & 169.238805970149 & 6.29734638435144 & 26.8746223632701 \tabularnewline
Winsorized Mean ( 6 / 22 ) & 168.316417910448 & 6.11434485552452 & 27.5281198374619 \tabularnewline
Winsorized Mean ( 7 / 22 ) & 167.950746268657 & 6.01099752452667 & 27.9405781791404 \tabularnewline
Winsorized Mean ( 8 / 22 ) & 168.058208955224 & 5.96426496538823 & 28.1775222815381 \tabularnewline
Winsorized Mean ( 9 / 22 ) & 168.071641791045 & 5.69147950612645 & 29.5303956748203 \tabularnewline
Winsorized Mean ( 10 / 22 ) & 168.026865671642 & 5.57248546164232 & 30.1529482361576 \tabularnewline
Winsorized Mean ( 11 / 22 ) & 168.092537313433 & 5.44229683261211 & 30.8863229043599 \tabularnewline
Winsorized Mean ( 12 / 22 ) & 168.862686567164 & 5.14323856348748 & 32.831976289403 \tabularnewline
Winsorized Mean ( 13 / 22 ) & 168.843283582090 & 5.04162870593478 & 33.4898290672089 \tabularnewline
Winsorized Mean ( 14 / 22 ) & 168.843283582090 & 5.01073213833081 & 33.6963299814975 \tabularnewline
Winsorized Mean ( 15 / 22 ) & 169.470149253731 & 4.88802523111299 & 34.6704735022703 \tabularnewline
Winsorized Mean ( 16 / 22 ) & 168.085074626866 & 4.65788033123982 & 36.0861728240505 \tabularnewline
Winsorized Mean ( 17 / 22 ) & 167.729850746269 & 4.60396168602175 & 36.4316347930347 \tabularnewline
Winsorized Mean ( 18 / 22 ) & 167.165671641791 & 4.4892612970723 & 37.2367880993716 \tabularnewline
Winsorized Mean ( 19 / 22 ) & 167.137313432836 & 4.45329287598091 & 37.5311748154496 \tabularnewline
Winsorized Mean ( 20 / 22 ) & 166.510447761194 & 4.23718176818361 & 39.2974521441344 \tabularnewline
Winsorized Mean ( 21 / 22 ) & 166.855223880597 & 4.15787672585417 & 40.1299112220119 \tabularnewline
Winsorized Mean ( 22 / 22 ) & 167.347761194030 & 3.99645442035901 & 41.8740572497251 \tabularnewline
Trimmed Mean ( 1 / 22 ) & 169.764615384615 & 6.46289573657004 & 26.2675776160227 \tabularnewline
Trimmed Mean ( 2 / 22 ) & 169.328571428571 & 6.37924599464319 & 26.5436654380096 \tabularnewline
Trimmed Mean ( 3 / 22 ) & 168.865573770492 & 6.27634943374399 & 26.9050624974141 \tabularnewline
Trimmed Mean ( 4 / 22 ) & 168.372881355932 & 6.15870983101435 & 27.3389859200756 \tabularnewline
Trimmed Mean ( 5 / 22 ) & 167.868421052632 & 6.02153984393297 & 27.8779889203537 \tabularnewline
Trimmed Mean ( 6 / 22 ) & 167.534545454545 & 5.91131666965162 & 28.3413247533597 \tabularnewline
Trimmed Mean ( 7 / 22 ) & 167.369811320755 & 5.82518155027421 & 28.7321193127236 \tabularnewline
Trimmed Mean ( 8 / 22 ) & 167.260784313725 & 5.74112927228001 & 29.1337777606426 \tabularnewline
Trimmed Mean ( 9 / 22 ) & 167.124489795918 & 5.64265787066186 & 29.6180441250668 \tabularnewline
Trimmed Mean ( 10 / 22 ) & 166.974468085106 & 5.578635959464 & 29.9310564981102 \tabularnewline
Trimmed Mean ( 11 / 22 ) & 166.817777777778 & 5.51730087802683 & 30.2353961594056 \tabularnewline
Trimmed Mean ( 12 / 22 ) & 166.637209302326 & 5.45969529211921 & 30.5213387169899 \tabularnewline
Trimmed Mean ( 13 / 22 ) & 166.334146341463 & 5.44039611380223 & 30.5739036022534 \tabularnewline
Trimmed Mean ( 14 / 22 ) & 166.002564102564 & 5.42347634303385 & 30.6081475428182 \tabularnewline
Trimmed Mean ( 15 / 22 ) & 165.635135135135 & 5.39236783557255 & 30.716586884609 \tabularnewline
Trimmed Mean ( 16 / 22 ) & 165.145714285714 & 5.36059595153209 & 30.8073422766576 \tabularnewline
Trimmed Mean ( 17 / 22 ) & 164.772727272727 & 5.35625744355636 & 30.7626601239921 \tabularnewline
Trimmed Mean ( 18 / 22 ) & 164.396774193548 & 5.34063441898293 & 30.7822556828101 \tabularnewline
Trimmed Mean ( 19 / 22 ) & 164.041379310345 & 5.32401270303734 & 30.8116055427065 \tabularnewline
Trimmed Mean ( 20 / 22 ) & 163.637037037037 & 5.28042708534555 & 30.9893564274695 \tabularnewline
Trimmed Mean ( 21 / 22 ) & 163.252 & 5.25223165267235 & 31.0824066407918 \tabularnewline
Trimmed Mean ( 22 / 22 ) & 162.752173913043 & 5.19429174972237 & 31.3328903640698 \tabularnewline
Median & 150.9 &  &  \tabularnewline
Midrange & 181.95 &  &  \tabularnewline
Midmean - Weighted Average at Xnp & 163.679411764706 &  &  \tabularnewline
Midmean - Weighted Average at X(n+1)p & 165.145714285714 &  &  \tabularnewline
Midmean - Empirical Distribution Function & 165.145714285714 &  &  \tabularnewline
Midmean - Empirical Distribution Function - Averaging & 165.145714285714 &  &  \tabularnewline
Midmean - Empirical Distribution Function - Interpolation & 163.679411764706 &  &  \tabularnewline
Midmean - Closest Observation & 163.679411764706 &  &  \tabularnewline
Midmean - True Basic - Statistics Graphics Toolkit & 165.145714285714 &  &  \tabularnewline
Midmean - MS Excel (old versions) & 165.145714285714 &  &  \tabularnewline
Number of observations & 67 &  &  \tabularnewline
\hline
\end{tabular}
%Source: https://freestatistics.org/blog/index.php?pk=17988&T=1

[TABLE]
[ROW][C]Central Tendency - Ungrouped Data[/C][/ROW]
[ROW][C]Measure[/C][C]Value[/C][C]S.E.[/C][C]Value/S.E.[/C][/ROW]
[ROW][C]Arithmetic Mean[/C][C]170.128358208955[/C][C]6.53815016154547[/C][C]26.0208704305349[/C][/ROW]
[ROW][C]Geometric Mean[/C][C]161.90060291407[/C][C][/C][C][/C][/ROW]
[ROW][C]Harmonic Mean[/C][C]154.049776377224[/C][C][/C][C][/C][/ROW]
[ROW][C]Quadratic Mean[/C][C]178.227346847163[/C][C][/C][C][/C][/ROW]
[ROW][C]Winsorized Mean ( 1 / 22 )[/C][C]170.174626865672[/C][C]6.52970817444665[/C][C]26.0615975966020[/C][/ROW]
[ROW][C]Winsorized Mean ( 2 / 22 )[/C][C]170.171641791045[/C][C]6.52785313891266[/C][C]26.068546299954[/C][/ROW]
[ROW][C]Winsorized Mean ( 3 / 22 )[/C][C]170.167164179104[/C][C]6.50582085956918[/C][C]26.1561404551759[/C][/ROW]
[ROW][C]Winsorized Mean ( 4 / 22 )[/C][C]170.089552238806[/C][C]6.48150209790722[/C][C]26.2423045876550[/C][/ROW]
[ROW][C]Winsorized Mean ( 5 / 22 )[/C][C]169.238805970149[/C][C]6.29734638435144[/C][C]26.8746223632701[/C][/ROW]
[ROW][C]Winsorized Mean ( 6 / 22 )[/C][C]168.316417910448[/C][C]6.11434485552452[/C][C]27.5281198374619[/C][/ROW]
[ROW][C]Winsorized Mean ( 7 / 22 )[/C][C]167.950746268657[/C][C]6.01099752452667[/C][C]27.9405781791404[/C][/ROW]
[ROW][C]Winsorized Mean ( 8 / 22 )[/C][C]168.058208955224[/C][C]5.96426496538823[/C][C]28.1775222815381[/C][/ROW]
[ROW][C]Winsorized Mean ( 9 / 22 )[/C][C]168.071641791045[/C][C]5.69147950612645[/C][C]29.5303956748203[/C][/ROW]
[ROW][C]Winsorized Mean ( 10 / 22 )[/C][C]168.026865671642[/C][C]5.57248546164232[/C][C]30.1529482361576[/C][/ROW]
[ROW][C]Winsorized Mean ( 11 / 22 )[/C][C]168.092537313433[/C][C]5.44229683261211[/C][C]30.8863229043599[/C][/ROW]
[ROW][C]Winsorized Mean ( 12 / 22 )[/C][C]168.862686567164[/C][C]5.14323856348748[/C][C]32.831976289403[/C][/ROW]
[ROW][C]Winsorized Mean ( 13 / 22 )[/C][C]168.843283582090[/C][C]5.04162870593478[/C][C]33.4898290672089[/C][/ROW]
[ROW][C]Winsorized Mean ( 14 / 22 )[/C][C]168.843283582090[/C][C]5.01073213833081[/C][C]33.6963299814975[/C][/ROW]
[ROW][C]Winsorized Mean ( 15 / 22 )[/C][C]169.470149253731[/C][C]4.88802523111299[/C][C]34.6704735022703[/C][/ROW]
[ROW][C]Winsorized Mean ( 16 / 22 )[/C][C]168.085074626866[/C][C]4.65788033123982[/C][C]36.0861728240505[/C][/ROW]
[ROW][C]Winsorized Mean ( 17 / 22 )[/C][C]167.729850746269[/C][C]4.60396168602175[/C][C]36.4316347930347[/C][/ROW]
[ROW][C]Winsorized Mean ( 18 / 22 )[/C][C]167.165671641791[/C][C]4.4892612970723[/C][C]37.2367880993716[/C][/ROW]
[ROW][C]Winsorized Mean ( 19 / 22 )[/C][C]167.137313432836[/C][C]4.45329287598091[/C][C]37.5311748154496[/C][/ROW]
[ROW][C]Winsorized Mean ( 20 / 22 )[/C][C]166.510447761194[/C][C]4.23718176818361[/C][C]39.2974521441344[/C][/ROW]
[ROW][C]Winsorized Mean ( 21 / 22 )[/C][C]166.855223880597[/C][C]4.15787672585417[/C][C]40.1299112220119[/C][/ROW]
[ROW][C]Winsorized Mean ( 22 / 22 )[/C][C]167.347761194030[/C][C]3.99645442035901[/C][C]41.8740572497251[/C][/ROW]
[ROW][C]Trimmed Mean ( 1 / 22 )[/C][C]169.764615384615[/C][C]6.46289573657004[/C][C]26.2675776160227[/C][/ROW]
[ROW][C]Trimmed Mean ( 2 / 22 )[/C][C]169.328571428571[/C][C]6.37924599464319[/C][C]26.5436654380096[/C][/ROW]
[ROW][C]Trimmed Mean ( 3 / 22 )[/C][C]168.865573770492[/C][C]6.27634943374399[/C][C]26.9050624974141[/C][/ROW]
[ROW][C]Trimmed Mean ( 4 / 22 )[/C][C]168.372881355932[/C][C]6.15870983101435[/C][C]27.3389859200756[/C][/ROW]
[ROW][C]Trimmed Mean ( 5 / 22 )[/C][C]167.868421052632[/C][C]6.02153984393297[/C][C]27.8779889203537[/C][/ROW]
[ROW][C]Trimmed Mean ( 6 / 22 )[/C][C]167.534545454545[/C][C]5.91131666965162[/C][C]28.3413247533597[/C][/ROW]
[ROW][C]Trimmed Mean ( 7 / 22 )[/C][C]167.369811320755[/C][C]5.82518155027421[/C][C]28.7321193127236[/C][/ROW]
[ROW][C]Trimmed Mean ( 8 / 22 )[/C][C]167.260784313725[/C][C]5.74112927228001[/C][C]29.1337777606426[/C][/ROW]
[ROW][C]Trimmed Mean ( 9 / 22 )[/C][C]167.124489795918[/C][C]5.64265787066186[/C][C]29.6180441250668[/C][/ROW]
[ROW][C]Trimmed Mean ( 10 / 22 )[/C][C]166.974468085106[/C][C]5.578635959464[/C][C]29.9310564981102[/C][/ROW]
[ROW][C]Trimmed Mean ( 11 / 22 )[/C][C]166.817777777778[/C][C]5.51730087802683[/C][C]30.2353961594056[/C][/ROW]
[ROW][C]Trimmed Mean ( 12 / 22 )[/C][C]166.637209302326[/C][C]5.45969529211921[/C][C]30.5213387169899[/C][/ROW]
[ROW][C]Trimmed Mean ( 13 / 22 )[/C][C]166.334146341463[/C][C]5.44039611380223[/C][C]30.5739036022534[/C][/ROW]
[ROW][C]Trimmed Mean ( 14 / 22 )[/C][C]166.002564102564[/C][C]5.42347634303385[/C][C]30.6081475428182[/C][/ROW]
[ROW][C]Trimmed Mean ( 15 / 22 )[/C][C]165.635135135135[/C][C]5.39236783557255[/C][C]30.716586884609[/C][/ROW]
[ROW][C]Trimmed Mean ( 16 / 22 )[/C][C]165.145714285714[/C][C]5.36059595153209[/C][C]30.8073422766576[/C][/ROW]
[ROW][C]Trimmed Mean ( 17 / 22 )[/C][C]164.772727272727[/C][C]5.35625744355636[/C][C]30.7626601239921[/C][/ROW]
[ROW][C]Trimmed Mean ( 18 / 22 )[/C][C]164.396774193548[/C][C]5.34063441898293[/C][C]30.7822556828101[/C][/ROW]
[ROW][C]Trimmed Mean ( 19 / 22 )[/C][C]164.041379310345[/C][C]5.32401270303734[/C][C]30.8116055427065[/C][/ROW]
[ROW][C]Trimmed Mean ( 20 / 22 )[/C][C]163.637037037037[/C][C]5.28042708534555[/C][C]30.9893564274695[/C][/ROW]
[ROW][C]Trimmed Mean ( 21 / 22 )[/C][C]163.252[/C][C]5.25223165267235[/C][C]31.0824066407918[/C][/ROW]
[ROW][C]Trimmed Mean ( 22 / 22 )[/C][C]162.752173913043[/C][C]5.19429174972237[/C][C]31.3328903640698[/C][/ROW]
[ROW][C]Median[/C][C]150.9[/C][C][/C][C][/C][/ROW]
[ROW][C]Midrange[/C][C]181.95[/C][C][/C][C][/C][/ROW]
[ROW][C]Midmean - Weighted Average at Xnp[/C][C]163.679411764706[/C][C][/C][C][/C][/ROW]
[ROW][C]Midmean - Weighted Average at X(n+1)p[/C][C]165.145714285714[/C][C][/C][C][/C][/ROW]
[ROW][C]Midmean - Empirical Distribution Function[/C][C]165.145714285714[/C][C][/C][C][/C][/ROW]
[ROW][C]Midmean - Empirical Distribution Function - Averaging[/C][C]165.145714285714[/C][C][/C][C][/C][/ROW]
[ROW][C]Midmean - Empirical Distribution Function - Interpolation[/C][C]163.679411764706[/C][C][/C][C][/C][/ROW]
[ROW][C]Midmean - Closest Observation[/C][C]163.679411764706[/C][C][/C][C][/C][/ROW]
[ROW][C]Midmean - True Basic - Statistics Graphics Toolkit[/C][C]165.145714285714[/C][C][/C][C][/C][/ROW]
[ROW][C]Midmean - MS Excel (old versions)[/C][C]165.145714285714[/C][C][/C][C][/C][/ROW]
[ROW][C]Number of observations[/C][C]67[/C][C][/C][C][/C][/ROW]
[/TABLE]
Source: https://freestatistics.org/blog/index.php?pk=17988&T=1

Globally Unique Identifier (entire table): ba.freestatistics.org/blog/index.php?pk=17988&T=1

As an alternative you can also use a QR Code:  

The GUIDs for individual cells are displayed in the table below:

Central Tendency - Ungrouped Data
MeasureValueS.E.Value/S.E.
Arithmetic Mean170.1283582089556.5381501615454726.0208704305349
Geometric Mean161.90060291407
Harmonic Mean154.049776377224
Quadratic Mean178.227346847163
Winsorized Mean ( 1 / 22 )170.1746268656726.5297081744466526.0615975966020
Winsorized Mean ( 2 / 22 )170.1716417910456.5278531389126626.068546299954
Winsorized Mean ( 3 / 22 )170.1671641791046.5058208595691826.1561404551759
Winsorized Mean ( 4 / 22 )170.0895522388066.4815020979072226.2423045876550
Winsorized Mean ( 5 / 22 )169.2388059701496.2973463843514426.8746223632701
Winsorized Mean ( 6 / 22 )168.3164179104486.1143448555245227.5281198374619
Winsorized Mean ( 7 / 22 )167.9507462686576.0109975245266727.9405781791404
Winsorized Mean ( 8 / 22 )168.0582089552245.9642649653882328.1775222815381
Winsorized Mean ( 9 / 22 )168.0716417910455.6914795061264529.5303956748203
Winsorized Mean ( 10 / 22 )168.0268656716425.5724854616423230.1529482361576
Winsorized Mean ( 11 / 22 )168.0925373134335.4422968326121130.8863229043599
Winsorized Mean ( 12 / 22 )168.8626865671645.1432385634874832.831976289403
Winsorized Mean ( 13 / 22 )168.8432835820905.0416287059347833.4898290672089
Winsorized Mean ( 14 / 22 )168.8432835820905.0107321383308133.6963299814975
Winsorized Mean ( 15 / 22 )169.4701492537314.8880252311129934.6704735022703
Winsorized Mean ( 16 / 22 )168.0850746268664.6578803312398236.0861728240505
Winsorized Mean ( 17 / 22 )167.7298507462694.6039616860217536.4316347930347
Winsorized Mean ( 18 / 22 )167.1656716417914.489261297072337.2367880993716
Winsorized Mean ( 19 / 22 )167.1373134328364.4532928759809137.5311748154496
Winsorized Mean ( 20 / 22 )166.5104477611944.2371817681836139.2974521441344
Winsorized Mean ( 21 / 22 )166.8552238805974.1578767258541740.1299112220119
Winsorized Mean ( 22 / 22 )167.3477611940303.9964544203590141.8740572497251
Trimmed Mean ( 1 / 22 )169.7646153846156.4628957365700426.2675776160227
Trimmed Mean ( 2 / 22 )169.3285714285716.3792459946431926.5436654380096
Trimmed Mean ( 3 / 22 )168.8655737704926.2763494337439926.9050624974141
Trimmed Mean ( 4 / 22 )168.3728813559326.1587098310143527.3389859200756
Trimmed Mean ( 5 / 22 )167.8684210526326.0215398439329727.8779889203537
Trimmed Mean ( 6 / 22 )167.5345454545455.9113166696516228.3413247533597
Trimmed Mean ( 7 / 22 )167.3698113207555.8251815502742128.7321193127236
Trimmed Mean ( 8 / 22 )167.2607843137255.7411292722800129.1337777606426
Trimmed Mean ( 9 / 22 )167.1244897959185.6426578706618629.6180441250668
Trimmed Mean ( 10 / 22 )166.9744680851065.57863595946429.9310564981102
Trimmed Mean ( 11 / 22 )166.8177777777785.5173008780268330.2353961594056
Trimmed Mean ( 12 / 22 )166.6372093023265.4596952921192130.5213387169899
Trimmed Mean ( 13 / 22 )166.3341463414635.4403961138022330.5739036022534
Trimmed Mean ( 14 / 22 )166.0025641025645.4234763430338530.6081475428182
Trimmed Mean ( 15 / 22 )165.6351351351355.3923678355725530.716586884609
Trimmed Mean ( 16 / 22 )165.1457142857145.3605959515320930.8073422766576
Trimmed Mean ( 17 / 22 )164.7727272727275.3562574435563630.7626601239921
Trimmed Mean ( 18 / 22 )164.3967741935485.3406344189829330.7822556828101
Trimmed Mean ( 19 / 22 )164.0413793103455.3240127030373430.8116055427065
Trimmed Mean ( 20 / 22 )163.6370370370375.2804270853455530.9893564274695
Trimmed Mean ( 21 / 22 )163.2525.2522316526723531.0824066407918
Trimmed Mean ( 22 / 22 )162.7521739130435.1942917497223731.3328903640698
Median150.9
Midrange181.95
Midmean - Weighted Average at Xnp163.679411764706
Midmean - Weighted Average at X(n+1)p165.145714285714
Midmean - Empirical Distribution Function165.145714285714
Midmean - Empirical Distribution Function - Averaging165.145714285714
Midmean - Empirical Distribution Function - Interpolation163.679411764706
Midmean - Closest Observation163.679411764706
Midmean - True Basic - Statistics Graphics Toolkit165.145714285714
Midmean - MS Excel (old versions)165.145714285714
Number of observations67


Parameters (Session):
Parameters (R input):
R code (references can be found in the software module):
geomean <- function(x) {
return(exp(mean(log(x))))
}
harmean <- function(x) {
return(1/mean(1/x))
}
quamean <- function(x) {
return(sqrt(mean(x*x)))
}
winmean <- function(x) {
x <-sort(x[!is.na(x)])
n<-length(x)
denom <- 3
nodenom <- n/denom
if (nodenom>40) denom <- n/40
sqrtn = sqrt(n)
roundnodenom = floor(nodenom)
win <- array(NA,dim=c(roundnodenom,2))
for (j in 1:roundnodenom) {
win[j,1] <- (j*x[j+1]+sum(x[(j+1):(n-j)])+j*x[n-j])/n
win[j,2] <- sd(c(rep(x[j+1],j),x[(j+1):(n-j)],rep(x[n-j],j)))/sqrtn
}
return(win)
}
trimean <- function(x) {
x <-sort(x[!is.na(x)])
n<-length(x)
denom <- 3
nodenom <- n/denom
if (nodenom>40) denom <- n/40
sqrtn = sqrt(n)
roundnodenom = floor(nodenom)
tri <- array(NA,dim=c(roundnodenom,2))
for (j in 1:roundnodenom) {
tri[j,1] <- mean(x,trim=j/n)
tri[j,2] <- sd(x[(j+1):(n-j)]) / sqrt(n-j*2)
}
return(tri)
}
midrange <- function(x) {
return((max(x)+min(x))/2)
}
q1 <- function(data,n,p,i,f) {
np <- n*p;
i <<- floor(np)
f <<- np - i
qvalue <- (1-f)*data[i] + f*data[i+1]
}
q2 <- function(data,n,p,i,f) {
np <- (n+1)*p
i <<- floor(np)
f <<- np - i
qvalue <- (1-f)*data[i] + f*data[i+1]
}
q3 <- function(data,n,p,i,f) {
np <- n*p
i <<- floor(np)
f <<- np - i
if (f==0) {
qvalue <- data[i]
} else {
qvalue <- data[i+1]
}
}
q4 <- function(data,n,p,i,f) {
np <- n*p
i <<- floor(np)
f <<- np - i
if (f==0) {
qvalue <- (data[i]+data[i+1])/2
} else {
qvalue <- data[i+1]
}
}
q5 <- function(data,n,p,i,f) {
np <- (n-1)*p
i <<- floor(np)
f <<- np - i
if (f==0) {
qvalue <- data[i+1]
} else {
qvalue <- data[i+1] + f*(data[i+2]-data[i+1])
}
}
q6 <- function(data,n,p,i,f) {
np <- n*p+0.5
i <<- floor(np)
f <<- np - i
qvalue <- data[i]
}
q7 <- function(data,n,p,i,f) {
np <- (n+1)*p
i <<- floor(np)
f <<- np - i
if (f==0) {
qvalue <- data[i]
} else {
qvalue <- f*data[i] + (1-f)*data[i+1]
}
}
q8 <- function(data,n,p,i,f) {
np <- (n+1)*p
i <<- floor(np)
f <<- np - i
if (f==0) {
qvalue <- data[i]
} else {
if (f == 0.5) {
qvalue <- (data[i]+data[i+1])/2
} else {
if (f < 0.5) {
qvalue <- data[i]
} else {
qvalue <- data[i+1]
}
}
}
}
midmean <- function(x,def) {
x <-sort(x[!is.na(x)])
n<-length(x)
if (def==1) {
qvalue1 <- q1(x,n,0.25,i,f)
qvalue3 <- q1(x,n,0.75,i,f)
}
if (def==2) {
qvalue1 <- q2(x,n,0.25,i,f)
qvalue3 <- q2(x,n,0.75,i,f)
}
if (def==3) {
qvalue1 <- q3(x,n,0.25,i,f)
qvalue3 <- q3(x,n,0.75,i,f)
}
if (def==4) {
qvalue1 <- q4(x,n,0.25,i,f)
qvalue3 <- q4(x,n,0.75,i,f)
}
if (def==5) {
qvalue1 <- q5(x,n,0.25,i,f)
qvalue3 <- q5(x,n,0.75,i,f)
}
if (def==6) {
qvalue1 <- q6(x,n,0.25,i,f)
qvalue3 <- q6(x,n,0.75,i,f)
}
if (def==7) {
qvalue1 <- q7(x,n,0.25,i,f)
qvalue3 <- q7(x,n,0.75,i,f)
}
if (def==8) {
qvalue1 <- q8(x,n,0.25,i,f)
qvalue3 <- q8(x,n,0.75,i,f)
}
midm <- 0
myn <- 0
roundno4 <- round(n/4)
round3no4 <- round(3*n/4)
for (i in 1:n) {
if ((x[i]>=qvalue1) & (x[i]<=qvalue3)){
midm = midm + x[i]
myn = myn + 1
}
}
midm = midm / myn
return(midm)
}
(arm <- mean(x))
sqrtn <- sqrt(length(x))
(armse <- sd(x) / sqrtn)
(armose <- arm / armse)
(geo <- geomean(x))
(har <- harmean(x))
(qua <- quamean(x))
(win <- winmean(x))
(tri <- trimean(x))
(midr <- midrange(x))
midm <- array(NA,dim=8)
for (j in 1:8) midm[j] <- midmean(x,j)
midm
bitmap(file='test1.png')
lb <- win[,1] - 2*win[,2]
ub <- win[,1] + 2*win[,2]
if ((ylimmin == '') | (ylimmax == '')) plot(win[,1],type='b',main=main, xlab='j', pch=19, ylab='Winsorized Mean(j/n)', ylim=c(min(lb),max(ub))) else plot(win[,1],type='l',main=main, xlab='j', pch=19, ylab='Winsorized Mean(j/n)', ylim=c(ylimmin,ylimmax))
lines(ub,lty=3)
lines(lb,lty=3)
grid()
dev.off()
bitmap(file='test2.png')
lb <- tri[,1] - 2*tri[,2]
ub <- tri[,1] + 2*tri[,2]
if ((ylimmin == '') | (ylimmax == '')) plot(tri[,1],type='b',main=main, xlab='j', pch=19, ylab='Trimmed Mean(j/n)', ylim=c(min(lb),max(ub))) else plot(tri[,1],type='l',main=main, xlab='j', pch=19, ylab='Trimmed Mean(j/n)', ylim=c(ylimmin,ylimmax))
lines(ub,lty=3)
lines(lb,lty=3)
grid()
dev.off()
load(file='createtable')
a<-table.start()
a<-table.row.start(a)
a<-table.element(a,'Central Tendency - Ungrouped Data',4,TRUE)
a<-table.row.end(a)
a<-table.row.start(a)
a<-table.element(a,'Measure',header=TRUE)
a<-table.element(a,'Value',header=TRUE)
a<-table.element(a,'S.E.',header=TRUE)
a<-table.element(a,'Value/S.E.',header=TRUE)
a<-table.row.end(a)
a<-table.row.start(a)
a<-table.element(a,hyperlink('arithmetic_mean.htm', 'Arithmetic Mean', 'click to view the definition of the Arithmetic Mean'),header=TRUE)
a<-table.element(a,arm)
a<-table.element(a,hyperlink('arithmetic_mean_standard_error.htm', armse, 'click to view the definition of the Standard Error of the Arithmetic Mean'))
a<-table.element(a,armose)
a<-table.row.end(a)
a<-table.row.start(a)
a<-table.element(a,hyperlink('geometric_mean.htm', 'Geometric Mean', 'click to view the definition of the Geometric Mean'),header=TRUE)
a<-table.element(a,geo)
a<-table.element(a,'')
a<-table.row.end(a)
a<-table.row.start(a)
a<-table.element(a,hyperlink('harmonic_mean.htm', 'Harmonic Mean', 'click to view the definition of the Harmonic Mean'),header=TRUE)
a<-table.element(a,har)
a<-table.element(a,'')
a<-table.row.end(a)
a<-table.row.start(a)
a<-table.element(a,hyperlink('quadratic_mean.htm', 'Quadratic Mean', 'click to view the definition of the Quadratic Mean'),header=TRUE)
a<-table.element(a,qua)
a<-table.element(a,'')
a<-table.row.end(a)
for (j in 1:length(win[,1])) {
a<-table.row.start(a)
mylabel <- paste('Winsorized Mean (',j)
mylabel <- paste(mylabel,'/')
mylabel <- paste(mylabel,length(win[,1]))
mylabel <- paste(mylabel,')')
a<-table.element(a,hyperlink('winsorized_mean.htm', mylabel, 'click to view the definition of the Winsorized Mean'),header=TRUE)
a<-table.element(a,win[j,1])
a<-table.element(a,win[j,2])
a<-table.element(a,win[j,1]/win[j,2])
a<-table.row.end(a)
}
for (j in 1:length(tri[,1])) {
a<-table.row.start(a)
mylabel <- paste('Trimmed Mean (',j)
mylabel <- paste(mylabel,'/')
mylabel <- paste(mylabel,length(tri[,1]))
mylabel <- paste(mylabel,')')
a<-table.element(a,hyperlink('arithmetic_mean.htm', mylabel, 'click to view the definition of the Trimmed Mean'),header=TRUE)
a<-table.element(a,tri[j,1])
a<-table.element(a,tri[j,2])
a<-table.element(a,tri[j,1]/tri[j,2])
a<-table.row.end(a)
}
a<-table.row.start(a)
a<-table.element(a,hyperlink('median_1.htm', 'Median', 'click to view the definition of the Median'),header=TRUE)
a<-table.element(a,median(x))
a<-table.element(a,'')
a<-table.row.end(a)
a<-table.row.start(a)
a<-table.element(a,hyperlink('midrange.htm', 'Midrange', 'click to view the definition of the Midrange'),header=TRUE)
a<-table.element(a,midr)
a<-table.element(a,'')
a<-table.row.end(a)
a<-table.row.start(a)
mymid <- hyperlink('midmean.htm', 'Midmean', 'click to view the definition of the Midmean')
mylabel <- paste(mymid,hyperlink('method_1.htm','Weighted Average at Xnp',''),sep=' - ')
a<-table.element(a,mylabel,header=TRUE)
a<-table.element(a,midm[1])
a<-table.element(a,'')
a<-table.row.end(a)
a<-table.row.start(a)
mymid <- hyperlink('midmean.htm', 'Midmean', 'click to view the definition of the Midmean')
mylabel <- paste(mymid,hyperlink('method_2.htm','Weighted Average at X(n+1)p',''),sep=' - ')
a<-table.element(a,mylabel,header=TRUE)
a<-table.element(a,midm[2])
a<-table.element(a,'')
a<-table.row.end(a)
a<-table.row.start(a)
mymid <- hyperlink('midmean.htm', 'Midmean', 'click to view the definition of the Midmean')
mylabel <- paste(mymid,hyperlink('method_3.htm','Empirical Distribution Function',''),sep=' - ')
a<-table.element(a,mylabel,header=TRUE)
a<-table.element(a,midm[3])
a<-table.element(a,'')
a<-table.row.end(a)
a<-table.row.start(a)
mymid <- hyperlink('midmean.htm', 'Midmean', 'click to view the definition of the Midmean')
mylabel <- paste(mymid,hyperlink('method_4.htm','Empirical Distribution Function - Averaging',''),sep=' - ')
a<-table.element(a,mylabel,header=TRUE)
a<-table.element(a,midm[4])
a<-table.element(a,'')
a<-table.row.end(a)
a<-table.row.start(a)
mymid <- hyperlink('midmean.htm', 'Midmean', 'click to view the definition of the Midmean')
mylabel <- paste(mymid,hyperlink('method_5.htm','Empirical Distribution Function - Interpolation',''),sep=' - ')
a<-table.element(a,mylabel,header=TRUE)
a<-table.element(a,midm[5])
a<-table.element(a,'')
a<-table.row.end(a)
a<-table.row.start(a)
mymid <- hyperlink('midmean.htm', 'Midmean', 'click to view the definition of the Midmean')
mylabel <- paste(mymid,hyperlink('method_6.htm','Closest Observation',''),sep=' - ')
a<-table.element(a,mylabel,header=TRUE)
a<-table.element(a,midm[6])
a<-table.element(a,'')
a<-table.row.end(a)
a<-table.row.start(a)
mymid <- hyperlink('midmean.htm', 'Midmean', 'click to view the definition of the Midmean')
mylabel <- paste(mymid,hyperlink('method_7.htm','True Basic - Statistics Graphics Toolkit',''),sep=' - ')
a<-table.element(a,mylabel,header=TRUE)
a<-table.element(a,midm[7])
a<-table.element(a,'')
a<-table.row.end(a)
a<-table.row.start(a)
mymid <- hyperlink('midmean.htm', 'Midmean', 'click to view the definition of the Midmean')
mylabel <- paste(mymid,hyperlink('method_8.htm','MS Excel (old versions)',''),sep=' - ')
a<-table.element(a,mylabel,header=TRUE)
a<-table.element(a,midm[8])
a<-table.element(a,'')
a<-table.row.end(a)
a<-table.row.start(a)
a<-table.element(a,'Number of observations',header=TRUE)
a<-table.element(a,length(x))
a<-table.element(a,'')
a<-table.row.end(a)
a<-table.end(a)
table.save(a,file='mytable.tab')