Free Statistics

of Irreproducible Research!

Author's title

Author*The author of this computation has been verified*
R Software Modulerwasp_centraltendency.wasp
Title produced by softwareCentral Tendency
Date of computationMon, 20 Oct 2008 13:34:22 -0600
Cite this page as followsStatistical Computations at FreeStatistics.org, Office for Research Development and Education, URL https://freestatistics.org/blog/index.php?v=date/2008/Oct/20/t1224531350r1oaxyn4ysfco4z.htm/, Retrieved Sun, 19 May 2024 14:58:33 +0000
Statistical Computations at FreeStatistics.org, Office for Research Development and Education, URL https://freestatistics.org/blog/index.php?pk=17974, Retrieved Sun, 19 May 2024 14:58:33 +0000
QR Codes:

Original text written by user:
IsPrivate?No (this computation is public)
User-defined keywords
Estimated Impact122
Family? (F = Feedback message, R = changed R code, M = changed R Module, P = changed Parameters, D = changed Data)
F     [Univariate Data Series] [Tijdreeks 2] [2008-10-13 19:39:33] [b82ef11dce0545f3fd4676ec3ebed828]
- RMP     [Central Tendency] [Tijdreeks 2: Omze...] [2008-10-20 19:34:22] [4b953869c7238aca4b6e0cfb0c5cddd6] [Current]
Feedback Forum

Post a new message
Dataseries X:
104.2
103.2
112.7
106.4
102.6
110.6
95.2
89
112.5
116.8
107.2
113.6
101.8
102.6
122.7
110.3
110.5
121.6
100.3
100.7
123.4
127.1
124.1
131.2
111.6
114.2
130.1
125.9
119
133.8
107.5
113.5
134.4
126.8
135.6
139.9
129.8
131
153.1
134.1
144.1
155.9
123.3
128.1
144.3
153
149.9
150.9
141
138.9
157.4
142.9
151.7
161
138.5
135.9
151.5
164
159.1
157
142.1
144.8
152.1
154.6
148.7
157.7
146.7


Summary of computational transaction
Raw Inputview raw input (R code)
Raw Outputview raw output of R engine
Computing time2 seconds
R Server'George Udny Yule' @ 72.249.76.132

\begin{tabular}{lllllllll}
\hline
Summary of computational transaction \tabularnewline
Raw Input & view raw input (R code)  \tabularnewline
Raw Output & view raw output of R engine  \tabularnewline
Computing time & 2 seconds \tabularnewline
R Server & 'George Udny Yule' @ 72.249.76.132 \tabularnewline
\hline
\end{tabular}
%Source: https://freestatistics.org/blog/index.php?pk=17974&T=0

[TABLE]
[ROW][C]Summary of computational transaction[/C][/ROW]
[ROW][C]Raw Input[/C][C]view raw input (R code) [/C][/ROW]
[ROW][C]Raw Output[/C][C]view raw output of R engine [/C][/ROW]
[ROW][C]Computing time[/C][C]2 seconds[/C][/ROW]
[ROW][C]R Server[/C][C]'George Udny Yule' @ 72.249.76.132[/C][/ROW]
[/TABLE]
Source: https://freestatistics.org/blog/index.php?pk=17974&T=0

Globally Unique Identifier (entire table): ba.freestatistics.org/blog/index.php?pk=17974&T=0

As an alternative you can also use a QR Code:  

The GUIDs for individual cells are displayed in the table below:

Summary of computational transaction
Raw Inputview raw input (R code)
Raw Outputview raw output of R engine
Computing time2 seconds
R Server'George Udny Yule' @ 72.249.76.132


Central Tendency - Ungrouped Data
MeasureValueS.E.Value/S.E.
Arithmetic Mean129.6373134328362.3874889073610454.2986034545088
Geometric Mean128.150302815721
Harmonic Mean126.636432192209
Quadratic Mean131.080280174961
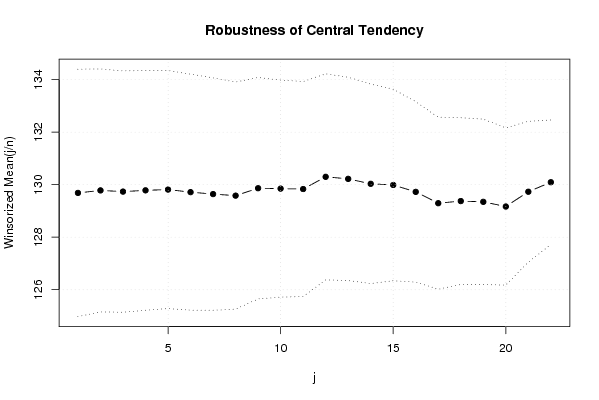
Winsorized Mean ( 1 / 22 )129.6850746268662.3558901171155855.0471661155593
Winsorized Mean ( 2 / 22 )129.7805970149252.3131291436329856.1060749124855
Winsorized Mean ( 3 / 22 )129.7358208955222.2978857817567256.4587769877491
Winsorized Mean ( 4 / 22 )129.7835820895522.2822051642317356.8676226500618
Winsorized Mean ( 5 / 22 )129.8134328358212.2657767849611957.2931251204626
Winsorized Mean ( 6 / 22 )129.7149253731342.2481292828520257.6990506562751
Winsorized Mean ( 7 / 22 )129.6417910447762.2131357662232258.5783271968051
Winsorized Mean ( 8 / 22 )129.5820895522392.1616344777591559.9463465657569
Winsorized Mean ( 9 / 22 )129.8641791044782.1081872895065561.5999250877155
Winsorized Mean ( 10 / 22 )129.8492537313432.0660720900308862.8483654359818
Winsorized Mean ( 11 / 22 )129.8328358208962.0472388085668363.4185104725448
Winsorized Mean ( 12 / 22 )130.2985074626871.9611635159302266.4393898847761
Winsorized Mean ( 13 / 22 )130.2208955223881.9362166820533767.2553318693072
Winsorized Mean ( 14 / 22 )130.0328358208961.8995183612676368.4556877534572
Winsorized Mean ( 15 / 22 )129.9880597014931.8228653772490571.3097419720935
Winsorized Mean ( 16 / 22 )129.7253731343281.7171539137397275.5467358495573
Winsorized Mean ( 17 / 22 )129.2940298507461.6387078899569178.8999861678496
Winsorized Mean ( 18 / 22 )129.3746268656721.5867245835498881.5356541437268
Winsorized Mean ( 19 / 22 )129.3462686567161.5743582589250682.1580907162971
Winsorized Mean ( 20 / 22 )129.1671641791041.4968795947908586.2909512753108
Winsorized Mean ( 21 / 22 )129.7313432835821.3405265187992096.7764094661783
Winsorized Mean ( 22 / 22 )130.0925373134331.18603610939734109.686826802885
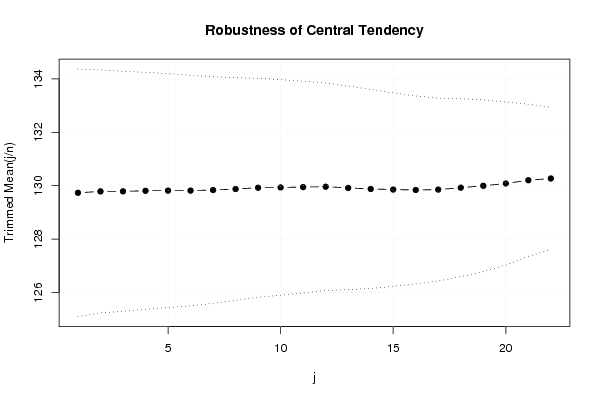
Trimmed Mean ( 1 / 22 )129.7338461538462.3190818774760655.9418998586804
Trimmed Mean ( 2 / 22 )129.7857142857142.2742541044048357.067376083588
Trimmed Mean ( 3 / 22 )129.7885245901642.2466734344573757.7691989407936
Trimmed Mean ( 4 / 22 )129.8084745762712.2189335744201658.5003877865934
Trimmed Mean ( 5 / 22 )129.8157894736842.1895611155909359.2884978406501
Trimmed Mean ( 6 / 22 )129.8163636363642.1573876890000460.1729417008653
Trimmed Mean ( 7 / 22 )129.8377358490572.1213395458777761.2055416123082
Trimmed Mean ( 8 / 22 )129.8745098039222.0844350212801762.3068162250308
Trimmed Mean ( 9 / 22 )129.9244897959182.0496277466320563.3893105757425
Trimmed Mean ( 10 / 22 )129.9340425531912.0169042246000464.4225149456257
Trimmed Mean ( 11 / 22 )129.9466666666671.9830891115233465.5273965812087
Trimmed Mean ( 12 / 22 )129.9627906976741.9417828778738766.9296202879156
Trimmed Mean ( 13 / 22 )129.9170731707321.9061834632578968.1555976509669
Trimmed Mean ( 14 / 22 )129.8769230769231.8626286387423569.727760207003
Trimmed Mean ( 15 / 22 )129.8567567567571.8111041401074771.700325719012
Trimmed Mean ( 16 / 22 )129.841.7587008191925673.8272243823775
Trimmed Mean ( 17 / 22 )129.8545454545451.7121894261015675.8412261371149
Trimmed Mean ( 18 / 22 )129.9258064516131.6649322227280678.0366940335412
Trimmed Mean ( 19 / 22 )129.9965517241381.6087008095190780.808408222907
Trimmed Mean ( 20 / 22 )130.0814814814811.5253978700732085.277083463634
Trimmed Mean ( 21 / 22 )130.2041.4239204097607991.4405040530837
Trimmed Mean ( 22 / 22 )130.2695652173911.3301376608987097.9369046128472
Median130.1
Midrange126.5
Midmean - Weighted Average at Xnp129.344117647059
Midmean - Weighted Average at X(n+1)p129.84
Midmean - Empirical Distribution Function129.84
Midmean - Empirical Distribution Function - Averaging129.84
Midmean - Empirical Distribution Function - Interpolation129.854545454545
Midmean - Closest Observation129.344117647059
Midmean - True Basic - Statistics Graphics Toolkit129.84
Midmean - MS Excel (old versions)129.84
Number of observations67

\begin{tabular}{lllllllll}
\hline
Central Tendency - Ungrouped Data \tabularnewline
Measure & Value & S.E. & Value/S.E. \tabularnewline
Arithmetic Mean & 129.637313432836 & 2.38748890736104 & 54.2986034545088 \tabularnewline
Geometric Mean & 128.150302815721 &  &  \tabularnewline
Harmonic Mean & 126.636432192209 &  &  \tabularnewline
Quadratic Mean & 131.080280174961 &  &  \tabularnewline
Winsorized Mean ( 1 / 22 ) & 129.685074626866 & 2.35589011711558 & 55.0471661155593 \tabularnewline
Winsorized Mean ( 2 / 22 ) & 129.780597014925 & 2.31312914363298 & 56.1060749124855 \tabularnewline
Winsorized Mean ( 3 / 22 ) & 129.735820895522 & 2.29788578175672 & 56.4587769877491 \tabularnewline
Winsorized Mean ( 4 / 22 ) & 129.783582089552 & 2.28220516423173 & 56.8676226500618 \tabularnewline
Winsorized Mean ( 5 / 22 ) & 129.813432835821 & 2.26577678496119 & 57.2931251204626 \tabularnewline
Winsorized Mean ( 6 / 22 ) & 129.714925373134 & 2.24812928285202 & 57.6990506562751 \tabularnewline
Winsorized Mean ( 7 / 22 ) & 129.641791044776 & 2.21313576622322 & 58.5783271968051 \tabularnewline
Winsorized Mean ( 8 / 22 ) & 129.582089552239 & 2.16163447775915 & 59.9463465657569 \tabularnewline
Winsorized Mean ( 9 / 22 ) & 129.864179104478 & 2.10818728950655 & 61.5999250877155 \tabularnewline
Winsorized Mean ( 10 / 22 ) & 129.849253731343 & 2.06607209003088 & 62.8483654359818 \tabularnewline
Winsorized Mean ( 11 / 22 ) & 129.832835820896 & 2.04723880856683 & 63.4185104725448 \tabularnewline
Winsorized Mean ( 12 / 22 ) & 130.298507462687 & 1.96116351593022 & 66.4393898847761 \tabularnewline
Winsorized Mean ( 13 / 22 ) & 130.220895522388 & 1.93621668205337 & 67.2553318693072 \tabularnewline
Winsorized Mean ( 14 / 22 ) & 130.032835820896 & 1.89951836126763 & 68.4556877534572 \tabularnewline
Winsorized Mean ( 15 / 22 ) & 129.988059701493 & 1.82286537724905 & 71.3097419720935 \tabularnewline
Winsorized Mean ( 16 / 22 ) & 129.725373134328 & 1.71715391373972 & 75.5467358495573 \tabularnewline
Winsorized Mean ( 17 / 22 ) & 129.294029850746 & 1.63870788995691 & 78.8999861678496 \tabularnewline
Winsorized Mean ( 18 / 22 ) & 129.374626865672 & 1.58672458354988 & 81.5356541437268 \tabularnewline
Winsorized Mean ( 19 / 22 ) & 129.346268656716 & 1.57435825892506 & 82.1580907162971 \tabularnewline
Winsorized Mean ( 20 / 22 ) & 129.167164179104 & 1.49687959479085 & 86.2909512753108 \tabularnewline
Winsorized Mean ( 21 / 22 ) & 129.731343283582 & 1.34052651879920 & 96.7764094661783 \tabularnewline
Winsorized Mean ( 22 / 22 ) & 130.092537313433 & 1.18603610939734 & 109.686826802885 \tabularnewline
Trimmed Mean ( 1 / 22 ) & 129.733846153846 & 2.31908187747606 & 55.9418998586804 \tabularnewline
Trimmed Mean ( 2 / 22 ) & 129.785714285714 & 2.27425410440483 & 57.067376083588 \tabularnewline
Trimmed Mean ( 3 / 22 ) & 129.788524590164 & 2.24667343445737 & 57.7691989407936 \tabularnewline
Trimmed Mean ( 4 / 22 ) & 129.808474576271 & 2.21893357442016 & 58.5003877865934 \tabularnewline
Trimmed Mean ( 5 / 22 ) & 129.815789473684 & 2.18956111559093 & 59.2884978406501 \tabularnewline
Trimmed Mean ( 6 / 22 ) & 129.816363636364 & 2.15738768900004 & 60.1729417008653 \tabularnewline
Trimmed Mean ( 7 / 22 ) & 129.837735849057 & 2.12133954587777 & 61.2055416123082 \tabularnewline
Trimmed Mean ( 8 / 22 ) & 129.874509803922 & 2.08443502128017 & 62.3068162250308 \tabularnewline
Trimmed Mean ( 9 / 22 ) & 129.924489795918 & 2.04962774663205 & 63.3893105757425 \tabularnewline
Trimmed Mean ( 10 / 22 ) & 129.934042553191 & 2.01690422460004 & 64.4225149456257 \tabularnewline
Trimmed Mean ( 11 / 22 ) & 129.946666666667 & 1.98308911152334 & 65.5273965812087 \tabularnewline
Trimmed Mean ( 12 / 22 ) & 129.962790697674 & 1.94178287787387 & 66.9296202879156 \tabularnewline
Trimmed Mean ( 13 / 22 ) & 129.917073170732 & 1.90618346325789 & 68.1555976509669 \tabularnewline
Trimmed Mean ( 14 / 22 ) & 129.876923076923 & 1.86262863874235 & 69.727760207003 \tabularnewline
Trimmed Mean ( 15 / 22 ) & 129.856756756757 & 1.81110414010747 & 71.700325719012 \tabularnewline
Trimmed Mean ( 16 / 22 ) & 129.84 & 1.75870081919256 & 73.8272243823775 \tabularnewline
Trimmed Mean ( 17 / 22 ) & 129.854545454545 & 1.71218942610156 & 75.8412261371149 \tabularnewline
Trimmed Mean ( 18 / 22 ) & 129.925806451613 & 1.66493222272806 & 78.0366940335412 \tabularnewline
Trimmed Mean ( 19 / 22 ) & 129.996551724138 & 1.60870080951907 & 80.808408222907 \tabularnewline
Trimmed Mean ( 20 / 22 ) & 130.081481481481 & 1.52539787007320 & 85.277083463634 \tabularnewline
Trimmed Mean ( 21 / 22 ) & 130.204 & 1.42392040976079 & 91.4405040530837 \tabularnewline
Trimmed Mean ( 22 / 22 ) & 130.269565217391 & 1.33013766089870 & 97.9369046128472 \tabularnewline
Median & 130.1 &  &  \tabularnewline
Midrange & 126.5 &  &  \tabularnewline
Midmean - Weighted Average at Xnp & 129.344117647059 &  &  \tabularnewline
Midmean - Weighted Average at X(n+1)p & 129.84 &  &  \tabularnewline
Midmean - Empirical Distribution Function & 129.84 &  &  \tabularnewline
Midmean - Empirical Distribution Function - Averaging & 129.84 &  &  \tabularnewline
Midmean - Empirical Distribution Function - Interpolation & 129.854545454545 &  &  \tabularnewline
Midmean - Closest Observation & 129.344117647059 &  &  \tabularnewline
Midmean - True Basic - Statistics Graphics Toolkit & 129.84 &  &  \tabularnewline
Midmean - MS Excel (old versions) & 129.84 &  &  \tabularnewline
Number of observations & 67 &  &  \tabularnewline
\hline
\end{tabular}
%Source: https://freestatistics.org/blog/index.php?pk=17974&T=1

[TABLE]
[ROW][C]Central Tendency - Ungrouped Data[/C][/ROW]
[ROW][C]Measure[/C][C]Value[/C][C]S.E.[/C][C]Value/S.E.[/C][/ROW]
[ROW][C]Arithmetic Mean[/C][C]129.637313432836[/C][C]2.38748890736104[/C][C]54.2986034545088[/C][/ROW]
[ROW][C]Geometric Mean[/C][C]128.150302815721[/C][C][/C][C][/C][/ROW]
[ROW][C]Harmonic Mean[/C][C]126.636432192209[/C][C][/C][C][/C][/ROW]
[ROW][C]Quadratic Mean[/C][C]131.080280174961[/C][C][/C][C][/C][/ROW]
[ROW][C]Winsorized Mean ( 1 / 22 )[/C][C]129.685074626866[/C][C]2.35589011711558[/C][C]55.0471661155593[/C][/ROW]
[ROW][C]Winsorized Mean ( 2 / 22 )[/C][C]129.780597014925[/C][C]2.31312914363298[/C][C]56.1060749124855[/C][/ROW]
[ROW][C]Winsorized Mean ( 3 / 22 )[/C][C]129.735820895522[/C][C]2.29788578175672[/C][C]56.4587769877491[/C][/ROW]
[ROW][C]Winsorized Mean ( 4 / 22 )[/C][C]129.783582089552[/C][C]2.28220516423173[/C][C]56.8676226500618[/C][/ROW]
[ROW][C]Winsorized Mean ( 5 / 22 )[/C][C]129.813432835821[/C][C]2.26577678496119[/C][C]57.2931251204626[/C][/ROW]
[ROW][C]Winsorized Mean ( 6 / 22 )[/C][C]129.714925373134[/C][C]2.24812928285202[/C][C]57.6990506562751[/C][/ROW]
[ROW][C]Winsorized Mean ( 7 / 22 )[/C][C]129.641791044776[/C][C]2.21313576622322[/C][C]58.5783271968051[/C][/ROW]
[ROW][C]Winsorized Mean ( 8 / 22 )[/C][C]129.582089552239[/C][C]2.16163447775915[/C][C]59.9463465657569[/C][/ROW]
[ROW][C]Winsorized Mean ( 9 / 22 )[/C][C]129.864179104478[/C][C]2.10818728950655[/C][C]61.5999250877155[/C][/ROW]
[ROW][C]Winsorized Mean ( 10 / 22 )[/C][C]129.849253731343[/C][C]2.06607209003088[/C][C]62.8483654359818[/C][/ROW]
[ROW][C]Winsorized Mean ( 11 / 22 )[/C][C]129.832835820896[/C][C]2.04723880856683[/C][C]63.4185104725448[/C][/ROW]
[ROW][C]Winsorized Mean ( 12 / 22 )[/C][C]130.298507462687[/C][C]1.96116351593022[/C][C]66.4393898847761[/C][/ROW]
[ROW][C]Winsorized Mean ( 13 / 22 )[/C][C]130.220895522388[/C][C]1.93621668205337[/C][C]67.2553318693072[/C][/ROW]
[ROW][C]Winsorized Mean ( 14 / 22 )[/C][C]130.032835820896[/C][C]1.89951836126763[/C][C]68.4556877534572[/C][/ROW]
[ROW][C]Winsorized Mean ( 15 / 22 )[/C][C]129.988059701493[/C][C]1.82286537724905[/C][C]71.3097419720935[/C][/ROW]
[ROW][C]Winsorized Mean ( 16 / 22 )[/C][C]129.725373134328[/C][C]1.71715391373972[/C][C]75.5467358495573[/C][/ROW]
[ROW][C]Winsorized Mean ( 17 / 22 )[/C][C]129.294029850746[/C][C]1.63870788995691[/C][C]78.8999861678496[/C][/ROW]
[ROW][C]Winsorized Mean ( 18 / 22 )[/C][C]129.374626865672[/C][C]1.58672458354988[/C][C]81.5356541437268[/C][/ROW]
[ROW][C]Winsorized Mean ( 19 / 22 )[/C][C]129.346268656716[/C][C]1.57435825892506[/C][C]82.1580907162971[/C][/ROW]
[ROW][C]Winsorized Mean ( 20 / 22 )[/C][C]129.167164179104[/C][C]1.49687959479085[/C][C]86.2909512753108[/C][/ROW]
[ROW][C]Winsorized Mean ( 21 / 22 )[/C][C]129.731343283582[/C][C]1.34052651879920[/C][C]96.7764094661783[/C][/ROW]
[ROW][C]Winsorized Mean ( 22 / 22 )[/C][C]130.092537313433[/C][C]1.18603610939734[/C][C]109.686826802885[/C][/ROW]
[ROW][C]Trimmed Mean ( 1 / 22 )[/C][C]129.733846153846[/C][C]2.31908187747606[/C][C]55.9418998586804[/C][/ROW]
[ROW][C]Trimmed Mean ( 2 / 22 )[/C][C]129.785714285714[/C][C]2.27425410440483[/C][C]57.067376083588[/C][/ROW]
[ROW][C]Trimmed Mean ( 3 / 22 )[/C][C]129.788524590164[/C][C]2.24667343445737[/C][C]57.7691989407936[/C][/ROW]
[ROW][C]Trimmed Mean ( 4 / 22 )[/C][C]129.808474576271[/C][C]2.21893357442016[/C][C]58.5003877865934[/C][/ROW]
[ROW][C]Trimmed Mean ( 5 / 22 )[/C][C]129.815789473684[/C][C]2.18956111559093[/C][C]59.2884978406501[/C][/ROW]
[ROW][C]Trimmed Mean ( 6 / 22 )[/C][C]129.816363636364[/C][C]2.15738768900004[/C][C]60.1729417008653[/C][/ROW]
[ROW][C]Trimmed Mean ( 7 / 22 )[/C][C]129.837735849057[/C][C]2.12133954587777[/C][C]61.2055416123082[/C][/ROW]
[ROW][C]Trimmed Mean ( 8 / 22 )[/C][C]129.874509803922[/C][C]2.08443502128017[/C][C]62.3068162250308[/C][/ROW]
[ROW][C]Trimmed Mean ( 9 / 22 )[/C][C]129.924489795918[/C][C]2.04962774663205[/C][C]63.3893105757425[/C][/ROW]
[ROW][C]Trimmed Mean ( 10 / 22 )[/C][C]129.934042553191[/C][C]2.01690422460004[/C][C]64.4225149456257[/C][/ROW]
[ROW][C]Trimmed Mean ( 11 / 22 )[/C][C]129.946666666667[/C][C]1.98308911152334[/C][C]65.5273965812087[/C][/ROW]
[ROW][C]Trimmed Mean ( 12 / 22 )[/C][C]129.962790697674[/C][C]1.94178287787387[/C][C]66.9296202879156[/C][/ROW]
[ROW][C]Trimmed Mean ( 13 / 22 )[/C][C]129.917073170732[/C][C]1.90618346325789[/C][C]68.1555976509669[/C][/ROW]
[ROW][C]Trimmed Mean ( 14 / 22 )[/C][C]129.876923076923[/C][C]1.86262863874235[/C][C]69.727760207003[/C][/ROW]
[ROW][C]Trimmed Mean ( 15 / 22 )[/C][C]129.856756756757[/C][C]1.81110414010747[/C][C]71.700325719012[/C][/ROW]
[ROW][C]Trimmed Mean ( 16 / 22 )[/C][C]129.84[/C][C]1.75870081919256[/C][C]73.8272243823775[/C][/ROW]
[ROW][C]Trimmed Mean ( 17 / 22 )[/C][C]129.854545454545[/C][C]1.71218942610156[/C][C]75.8412261371149[/C][/ROW]
[ROW][C]Trimmed Mean ( 18 / 22 )[/C][C]129.925806451613[/C][C]1.66493222272806[/C][C]78.0366940335412[/C][/ROW]
[ROW][C]Trimmed Mean ( 19 / 22 )[/C][C]129.996551724138[/C][C]1.60870080951907[/C][C]80.808408222907[/C][/ROW]
[ROW][C]Trimmed Mean ( 20 / 22 )[/C][C]130.081481481481[/C][C]1.52539787007320[/C][C]85.277083463634[/C][/ROW]
[ROW][C]Trimmed Mean ( 21 / 22 )[/C][C]130.204[/C][C]1.42392040976079[/C][C]91.4405040530837[/C][/ROW]
[ROW][C]Trimmed Mean ( 22 / 22 )[/C][C]130.269565217391[/C][C]1.33013766089870[/C][C]97.9369046128472[/C][/ROW]
[ROW][C]Median[/C][C]130.1[/C][C][/C][C][/C][/ROW]
[ROW][C]Midrange[/C][C]126.5[/C][C][/C][C][/C][/ROW]
[ROW][C]Midmean - Weighted Average at Xnp[/C][C]129.344117647059[/C][C][/C][C][/C][/ROW]
[ROW][C]Midmean - Weighted Average at X(n+1)p[/C][C]129.84[/C][C][/C][C][/C][/ROW]
[ROW][C]Midmean - Empirical Distribution Function[/C][C]129.84[/C][C][/C][C][/C][/ROW]
[ROW][C]Midmean - Empirical Distribution Function - Averaging[/C][C]129.84[/C][C][/C][C][/C][/ROW]
[ROW][C]Midmean - Empirical Distribution Function - Interpolation[/C][C]129.854545454545[/C][C][/C][C][/C][/ROW]
[ROW][C]Midmean - Closest Observation[/C][C]129.344117647059[/C][C][/C][C][/C][/ROW]
[ROW][C]Midmean - True Basic - Statistics Graphics Toolkit[/C][C]129.84[/C][C][/C][C][/C][/ROW]
[ROW][C]Midmean - MS Excel (old versions)[/C][C]129.84[/C][C][/C][C][/C][/ROW]
[ROW][C]Number of observations[/C][C]67[/C][C][/C][C][/C][/ROW]
[/TABLE]
Source: https://freestatistics.org/blog/index.php?pk=17974&T=1

Globally Unique Identifier (entire table): ba.freestatistics.org/blog/index.php?pk=17974&T=1

As an alternative you can also use a QR Code:  

The GUIDs for individual cells are displayed in the table below:

Central Tendency - Ungrouped Data
MeasureValueS.E.Value/S.E.
Arithmetic Mean129.6373134328362.3874889073610454.2986034545088
Geometric Mean128.150302815721
Harmonic Mean126.636432192209
Quadratic Mean131.080280174961
Winsorized Mean ( 1 / 22 )129.6850746268662.3558901171155855.0471661155593
Winsorized Mean ( 2 / 22 )129.7805970149252.3131291436329856.1060749124855
Winsorized Mean ( 3 / 22 )129.7358208955222.2978857817567256.4587769877491
Winsorized Mean ( 4 / 22 )129.7835820895522.2822051642317356.8676226500618
Winsorized Mean ( 5 / 22 )129.8134328358212.2657767849611957.2931251204626
Winsorized Mean ( 6 / 22 )129.7149253731342.2481292828520257.6990506562751
Winsorized Mean ( 7 / 22 )129.6417910447762.2131357662232258.5783271968051
Winsorized Mean ( 8 / 22 )129.5820895522392.1616344777591559.9463465657569
Winsorized Mean ( 9 / 22 )129.8641791044782.1081872895065561.5999250877155
Winsorized Mean ( 10 / 22 )129.8492537313432.0660720900308862.8483654359818
Winsorized Mean ( 11 / 22 )129.8328358208962.0472388085668363.4185104725448
Winsorized Mean ( 12 / 22 )130.2985074626871.9611635159302266.4393898847761
Winsorized Mean ( 13 / 22 )130.2208955223881.9362166820533767.2553318693072
Winsorized Mean ( 14 / 22 )130.0328358208961.8995183612676368.4556877534572
Winsorized Mean ( 15 / 22 )129.9880597014931.8228653772490571.3097419720935
Winsorized Mean ( 16 / 22 )129.7253731343281.7171539137397275.5467358495573
Winsorized Mean ( 17 / 22 )129.2940298507461.6387078899569178.8999861678496
Winsorized Mean ( 18 / 22 )129.3746268656721.5867245835498881.5356541437268
Winsorized Mean ( 19 / 22 )129.3462686567161.5743582589250682.1580907162971
Winsorized Mean ( 20 / 22 )129.1671641791041.4968795947908586.2909512753108
Winsorized Mean ( 21 / 22 )129.7313432835821.3405265187992096.7764094661783
Winsorized Mean ( 22 / 22 )130.0925373134331.18603610939734109.686826802885
Trimmed Mean ( 1 / 22 )129.7338461538462.3190818774760655.9418998586804
Trimmed Mean ( 2 / 22 )129.7857142857142.2742541044048357.067376083588
Trimmed Mean ( 3 / 22 )129.7885245901642.2466734344573757.7691989407936
Trimmed Mean ( 4 / 22 )129.8084745762712.2189335744201658.5003877865934
Trimmed Mean ( 5 / 22 )129.8157894736842.1895611155909359.2884978406501
Trimmed Mean ( 6 / 22 )129.8163636363642.1573876890000460.1729417008653
Trimmed Mean ( 7 / 22 )129.8377358490572.1213395458777761.2055416123082
Trimmed Mean ( 8 / 22 )129.8745098039222.0844350212801762.3068162250308
Trimmed Mean ( 9 / 22 )129.9244897959182.0496277466320563.3893105757425
Trimmed Mean ( 10 / 22 )129.9340425531912.0169042246000464.4225149456257
Trimmed Mean ( 11 / 22 )129.9466666666671.9830891115233465.5273965812087
Trimmed Mean ( 12 / 22 )129.9627906976741.9417828778738766.9296202879156
Trimmed Mean ( 13 / 22 )129.9170731707321.9061834632578968.1555976509669
Trimmed Mean ( 14 / 22 )129.8769230769231.8626286387423569.727760207003
Trimmed Mean ( 15 / 22 )129.8567567567571.8111041401074771.700325719012
Trimmed Mean ( 16 / 22 )129.841.7587008191925673.8272243823775
Trimmed Mean ( 17 / 22 )129.8545454545451.7121894261015675.8412261371149
Trimmed Mean ( 18 / 22 )129.9258064516131.6649322227280678.0366940335412
Trimmed Mean ( 19 / 22 )129.9965517241381.6087008095190780.808408222907
Trimmed Mean ( 20 / 22 )130.0814814814811.5253978700732085.277083463634
Trimmed Mean ( 21 / 22 )130.2041.4239204097607991.4405040530837
Trimmed Mean ( 22 / 22 )130.2695652173911.3301376608987097.9369046128472
Median130.1
Midrange126.5
Midmean - Weighted Average at Xnp129.344117647059
Midmean - Weighted Average at X(n+1)p129.84
Midmean - Empirical Distribution Function129.84
Midmean - Empirical Distribution Function - Averaging129.84
Midmean - Empirical Distribution Function - Interpolation129.854545454545
Midmean - Closest Observation129.344117647059
Midmean - True Basic - Statistics Graphics Toolkit129.84
Midmean - MS Excel (old versions)129.84
Number of observations67


Parameters (Session):
Parameters (R input):
R code (references can be found in the software module):
geomean <- function(x) {
return(exp(mean(log(x))))
}
harmean <- function(x) {
return(1/mean(1/x))
}
quamean <- function(x) {
return(sqrt(mean(x*x)))
}
winmean <- function(x) {
x <-sort(x[!is.na(x)])
n<-length(x)
denom <- 3
nodenom <- n/denom
if (nodenom>40) denom <- n/40
sqrtn = sqrt(n)
roundnodenom = floor(nodenom)
win <- array(NA,dim=c(roundnodenom,2))
for (j in 1:roundnodenom) {
win[j,1] <- (j*x[j+1]+sum(x[(j+1):(n-j)])+j*x[n-j])/n
win[j,2] <- sd(c(rep(x[j+1],j),x[(j+1):(n-j)],rep(x[n-j],j)))/sqrtn
}
return(win)
}
trimean <- function(x) {
x <-sort(x[!is.na(x)])
n<-length(x)
denom <- 3
nodenom <- n/denom
if (nodenom>40) denom <- n/40
sqrtn = sqrt(n)
roundnodenom = floor(nodenom)
tri <- array(NA,dim=c(roundnodenom,2))
for (j in 1:roundnodenom) {
tri[j,1] <- mean(x,trim=j/n)
tri[j,2] <- sd(x[(j+1):(n-j)]) / sqrt(n-j*2)
}
return(tri)
}
midrange <- function(x) {
return((max(x)+min(x))/2)
}
q1 <- function(data,n,p,i,f) {
np <- n*p;
i <<- floor(np)
f <<- np - i
qvalue <- (1-f)*data[i] + f*data[i+1]
}
q2 <- function(data,n,p,i,f) {
np <- (n+1)*p
i <<- floor(np)
f <<- np - i
qvalue <- (1-f)*data[i] + f*data[i+1]
}
q3 <- function(data,n,p,i,f) {
np <- n*p
i <<- floor(np)
f <<- np - i
if (f==0) {
qvalue <- data[i]
} else {
qvalue <- data[i+1]
}
}
q4 <- function(data,n,p,i,f) {
np <- n*p
i <<- floor(np)
f <<- np - i
if (f==0) {
qvalue <- (data[i]+data[i+1])/2
} else {
qvalue <- data[i+1]
}
}
q5 <- function(data,n,p,i,f) {
np <- (n-1)*p
i <<- floor(np)
f <<- np - i
if (f==0) {
qvalue <- data[i+1]
} else {
qvalue <- data[i+1] + f*(data[i+2]-data[i+1])
}
}
q6 <- function(data,n,p,i,f) {
np <- n*p+0.5
i <<- floor(np)
f <<- np - i
qvalue <- data[i]
}
q7 <- function(data,n,p,i,f) {
np <- (n+1)*p
i <<- floor(np)
f <<- np - i
if (f==0) {
qvalue <- data[i]
} else {
qvalue <- f*data[i] + (1-f)*data[i+1]
}
}
q8 <- function(data,n,p,i,f) {
np <- (n+1)*p
i <<- floor(np)
f <<- np - i
if (f==0) {
qvalue <- data[i]
} else {
if (f == 0.5) {
qvalue <- (data[i]+data[i+1])/2
} else {
if (f < 0.5) {
qvalue <- data[i]
} else {
qvalue <- data[i+1]
}
}
}
}
midmean <- function(x,def) {
x <-sort(x[!is.na(x)])
n<-length(x)
if (def==1) {
qvalue1 <- q1(x,n,0.25,i,f)
qvalue3 <- q1(x,n,0.75,i,f)
}
if (def==2) {
qvalue1 <- q2(x,n,0.25,i,f)
qvalue3 <- q2(x,n,0.75,i,f)
}
if (def==3) {
qvalue1 <- q3(x,n,0.25,i,f)
qvalue3 <- q3(x,n,0.75,i,f)
}
if (def==4) {
qvalue1 <- q4(x,n,0.25,i,f)
qvalue3 <- q4(x,n,0.75,i,f)
}
if (def==5) {
qvalue1 <- q5(x,n,0.25,i,f)
qvalue3 <- q5(x,n,0.75,i,f)
}
if (def==6) {
qvalue1 <- q6(x,n,0.25,i,f)
qvalue3 <- q6(x,n,0.75,i,f)
}
if (def==7) {
qvalue1 <- q7(x,n,0.25,i,f)
qvalue3 <- q7(x,n,0.75,i,f)
}
if (def==8) {
qvalue1 <- q8(x,n,0.25,i,f)
qvalue3 <- q8(x,n,0.75,i,f)
}
midm <- 0
myn <- 0
roundno4 <- round(n/4)
round3no4 <- round(3*n/4)
for (i in 1:n) {
if ((x[i]>=qvalue1) & (x[i]<=qvalue3)){
midm = midm + x[i]
myn = myn + 1
}
}
midm = midm / myn
return(midm)
}
(arm <- mean(x))
sqrtn <- sqrt(length(x))
(armse <- sd(x) / sqrtn)
(armose <- arm / armse)
(geo <- geomean(x))
(har <- harmean(x))
(qua <- quamean(x))
(win <- winmean(x))
(tri <- trimean(x))
(midr <- midrange(x))
midm <- array(NA,dim=8)
for (j in 1:8) midm[j] <- midmean(x,j)
midm
bitmap(file='test1.png')
lb <- win[,1] - 2*win[,2]
ub <- win[,1] + 2*win[,2]
if ((ylimmin == '') | (ylimmax == '')) plot(win[,1],type='b',main=main, xlab='j', pch=19, ylab='Winsorized Mean(j/n)', ylim=c(min(lb),max(ub))) else plot(win[,1],type='l',main=main, xlab='j', pch=19, ylab='Winsorized Mean(j/n)', ylim=c(ylimmin,ylimmax))
lines(ub,lty=3)
lines(lb,lty=3)
grid()
dev.off()
bitmap(file='test2.png')
lb <- tri[,1] - 2*tri[,2]
ub <- tri[,1] + 2*tri[,2]
if ((ylimmin == '') | (ylimmax == '')) plot(tri[,1],type='b',main=main, xlab='j', pch=19, ylab='Trimmed Mean(j/n)', ylim=c(min(lb),max(ub))) else plot(tri[,1],type='l',main=main, xlab='j', pch=19, ylab='Trimmed Mean(j/n)', ylim=c(ylimmin,ylimmax))
lines(ub,lty=3)
lines(lb,lty=3)
grid()
dev.off()
load(file='createtable')
a<-table.start()
a<-table.row.start(a)
a<-table.element(a,'Central Tendency - Ungrouped Data',4,TRUE)
a<-table.row.end(a)
a<-table.row.start(a)
a<-table.element(a,'Measure',header=TRUE)
a<-table.element(a,'Value',header=TRUE)
a<-table.element(a,'S.E.',header=TRUE)
a<-table.element(a,'Value/S.E.',header=TRUE)
a<-table.row.end(a)
a<-table.row.start(a)
a<-table.element(a,hyperlink('arithmetic_mean.htm', 'Arithmetic Mean', 'click to view the definition of the Arithmetic Mean'),header=TRUE)
a<-table.element(a,arm)
a<-table.element(a,hyperlink('arithmetic_mean_standard_error.htm', armse, 'click to view the definition of the Standard Error of the Arithmetic Mean'))
a<-table.element(a,armose)
a<-table.row.end(a)
a<-table.row.start(a)
a<-table.element(a,hyperlink('geometric_mean.htm', 'Geometric Mean', 'click to view the definition of the Geometric Mean'),header=TRUE)
a<-table.element(a,geo)
a<-table.element(a,'')
a<-table.row.end(a)
a<-table.row.start(a)
a<-table.element(a,hyperlink('harmonic_mean.htm', 'Harmonic Mean', 'click to view the definition of the Harmonic Mean'),header=TRUE)
a<-table.element(a,har)
a<-table.element(a,'')
a<-table.row.end(a)
a<-table.row.start(a)
a<-table.element(a,hyperlink('quadratic_mean.htm', 'Quadratic Mean', 'click to view the definition of the Quadratic Mean'),header=TRUE)
a<-table.element(a,qua)
a<-table.element(a,'')
a<-table.row.end(a)
for (j in 1:length(win[,1])) {
a<-table.row.start(a)
mylabel <- paste('Winsorized Mean (',j)
mylabel <- paste(mylabel,'/')
mylabel <- paste(mylabel,length(win[,1]))
mylabel <- paste(mylabel,')')
a<-table.element(a,hyperlink('winsorized_mean.htm', mylabel, 'click to view the definition of the Winsorized Mean'),header=TRUE)
a<-table.element(a,win[j,1])
a<-table.element(a,win[j,2])
a<-table.element(a,win[j,1]/win[j,2])
a<-table.row.end(a)
}
for (j in 1:length(tri[,1])) {
a<-table.row.start(a)
mylabel <- paste('Trimmed Mean (',j)
mylabel <- paste(mylabel,'/')
mylabel <- paste(mylabel,length(tri[,1]))
mylabel <- paste(mylabel,')')
a<-table.element(a,hyperlink('arithmetic_mean.htm', mylabel, 'click to view the definition of the Trimmed Mean'),header=TRUE)
a<-table.element(a,tri[j,1])
a<-table.element(a,tri[j,2])
a<-table.element(a,tri[j,1]/tri[j,2])
a<-table.row.end(a)
}
a<-table.row.start(a)
a<-table.element(a,hyperlink('median_1.htm', 'Median', 'click to view the definition of the Median'),header=TRUE)
a<-table.element(a,median(x))
a<-table.element(a,'')
a<-table.row.end(a)
a<-table.row.start(a)
a<-table.element(a,hyperlink('midrange.htm', 'Midrange', 'click to view the definition of the Midrange'),header=TRUE)
a<-table.element(a,midr)
a<-table.element(a,'')
a<-table.row.end(a)
a<-table.row.start(a)
mymid <- hyperlink('midmean.htm', 'Midmean', 'click to view the definition of the Midmean')
mylabel <- paste(mymid,hyperlink('method_1.htm','Weighted Average at Xnp',''),sep=' - ')
a<-table.element(a,mylabel,header=TRUE)
a<-table.element(a,midm[1])
a<-table.element(a,'')
a<-table.row.end(a)
a<-table.row.start(a)
mymid <- hyperlink('midmean.htm', 'Midmean', 'click to view the definition of the Midmean')
mylabel <- paste(mymid,hyperlink('method_2.htm','Weighted Average at X(n+1)p',''),sep=' - ')
a<-table.element(a,mylabel,header=TRUE)
a<-table.element(a,midm[2])
a<-table.element(a,'')
a<-table.row.end(a)
a<-table.row.start(a)
mymid <- hyperlink('midmean.htm', 'Midmean', 'click to view the definition of the Midmean')
mylabel <- paste(mymid,hyperlink('method_3.htm','Empirical Distribution Function',''),sep=' - ')
a<-table.element(a,mylabel,header=TRUE)
a<-table.element(a,midm[3])
a<-table.element(a,'')
a<-table.row.end(a)
a<-table.row.start(a)
mymid <- hyperlink('midmean.htm', 'Midmean', 'click to view the definition of the Midmean')
mylabel <- paste(mymid,hyperlink('method_4.htm','Empirical Distribution Function - Averaging',''),sep=' - ')
a<-table.element(a,mylabel,header=TRUE)
a<-table.element(a,midm[4])
a<-table.element(a,'')
a<-table.row.end(a)
a<-table.row.start(a)
mymid <- hyperlink('midmean.htm', 'Midmean', 'click to view the definition of the Midmean')
mylabel <- paste(mymid,hyperlink('method_5.htm','Empirical Distribution Function - Interpolation',''),sep=' - ')
a<-table.element(a,mylabel,header=TRUE)
a<-table.element(a,midm[5])
a<-table.element(a,'')
a<-table.row.end(a)
a<-table.row.start(a)
mymid <- hyperlink('midmean.htm', 'Midmean', 'click to view the definition of the Midmean')
mylabel <- paste(mymid,hyperlink('method_6.htm','Closest Observation',''),sep=' - ')
a<-table.element(a,mylabel,header=TRUE)
a<-table.element(a,midm[6])
a<-table.element(a,'')
a<-table.row.end(a)
a<-table.row.start(a)
mymid <- hyperlink('midmean.htm', 'Midmean', 'click to view the definition of the Midmean')
mylabel <- paste(mymid,hyperlink('method_7.htm','True Basic - Statistics Graphics Toolkit',''),sep=' - ')
a<-table.element(a,mylabel,header=TRUE)
a<-table.element(a,midm[7])
a<-table.element(a,'')
a<-table.row.end(a)
a<-table.row.start(a)
mymid <- hyperlink('midmean.htm', 'Midmean', 'click to view the definition of the Midmean')
mylabel <- paste(mymid,hyperlink('method_8.htm','MS Excel (old versions)',''),sep=' - ')
a<-table.element(a,mylabel,header=TRUE)
a<-table.element(a,midm[8])
a<-table.element(a,'')
a<-table.row.end(a)
a<-table.row.start(a)
a<-table.element(a,'Number of observations',header=TRUE)
a<-table.element(a,length(x))
a<-table.element(a,'')
a<-table.row.end(a)
a<-table.end(a)
table.save(a,file='mytable.tab')