Free Statistics

of Irreproducible Research!

Author's title

Author*Unverified author*
R Software Modulerwasp_correlation.wasp
Title produced by softwarePearson Correlation
Date of computationMon, 20 Oct 2008 13:26:14 -0600
Cite this page as followsStatistical Computations at FreeStatistics.org, Office for Research Development and Education, URL https://freestatistics.org/blog/index.php?v=date/2008/Oct/20/t1224530877qq7oqk5eac62358.htm/, Retrieved Sun, 19 May 2024 13:00:07 +0000
Statistical Computations at FreeStatistics.org, Office for Research Development and Education, URL https://freestatistics.org/blog/index.php?pk=17954, Retrieved Sun, 19 May 2024 13:00:07 +0000
QR Codes:

Original text written by user:
IsPrivate?No (this computation is public)
User-defined keywords
Estimated Impact125
Family? (F = Feedback message, R = changed R code, M = changed R Module, P = changed Parameters, D = changed Data)
F     [Back to Back Histogram] [Omzet industrie v...] [2008-10-20 18:44:01] [e340b5273efb4d885d02142e6a0fc74b]
F RMPD  [Pearson Correlation] [Correlation omzet...] [2008-10-20 19:08:40] [e340b5273efb4d885d02142e6a0fc74b]
F    D    [Pearson Correlation] [correlation inves...] [2008-10-20 19:15:50] [e340b5273efb4d885d02142e6a0fc74b]
F    D      [Pearson Correlation] [correlation omzet...] [2008-10-20 19:20:53] [e340b5273efb4d885d02142e6a0fc74b]
F    D          [Pearson Correlation] [correlaation omze...] [2008-10-20 19:26:14] [0ee5a336ab8a2fb221821eda2df0f830] [Current]
Feedback Forum
2008-10-27 01:40:04 [Kristof Augustyns] [reply
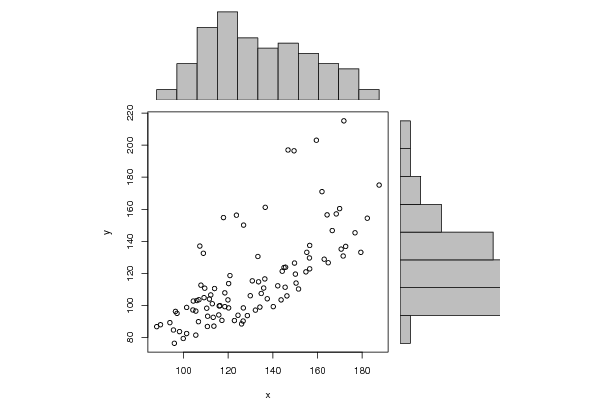
Uiteindelijk is er een vrij grote correlatie van 0.694772202202529 of een 69% tussen de omzet en de investeringen in de niet - industrie.
Je ziet op de grafiek dat je toch wel een vrij mooie lijn kunt trekken naar de rechter bovenhoek.
De student heeft niet altijd veel uitleg gegeven, maar wat hij heeft gezegd is natuurlijk wel allemaal waar.
Hier komt het er dus voor de zoveelste keer op neer dat als de omzet met 100% zal verhogen, de investeringen in de niet - industrie met 69% zal stijgen.
Dus de samenhang tussen beide is toch wel vrij hoog.
2008-10-28 00:15:05 [a7e076854c32462fd499d2de3f6d4e86] [reply
Correct maar kort en bondig.
vrij grote correlatie
Indien: omzet met 100% zal verhogen --> de investeringen in de niet - industrie met 69% zal stijgen.
--> grote samenhang

Post a new message
Dataseries X:
88
89,7
106,7
106
104,4
123,7
97,1
95,5
112,2
101,4
106,9
109,5
96,4
93,9
104,2
109,2
108,9
117,9
98,2
101,4
111,6
113,6
110,8
113,9
105,5
95,9
115,8
119,9
107,3
126,9
107,8
105,5
120,2
116
110,4
120,8
110,7
99,9
126,8
128,6
112,9
136,6
113,3
116,3
137,5
126,7
118,5
136,4
120,2
117,2
133,3
134,8
129,9
149,5
118,5
122,8
145,7
133,6
130,8
146,8
126
124,4
145,5
146,3
145
162
132,2
140,2
164,8
143,7
144,2
156,4
135,9
134,2
156,5
154,8
155,2
159,5
151,5
150,1
170,6
150,4
156,5
168,4
149,7
142,2
163
172,6
164,3
171,8
166,6
171,5
179,4
182,3
169,9
187,6
176,8
Dataseries Y:
86,7
87,9
89,8
103
102,7
156,3
95
84,6
106,5
98,7
103,5
110,7
96,2
89,2
97,1
104,8
132,5
154,8
83,6
82,4
103,9
87
93,2
110,5
96,4
76,3
94
103,4
137
150,1
112,6
81,4
113,6
99,6
98,2
118,6
86,8
79,3
98,4
93,6
101
161,2
92,5
99,8
104,1
90,2
99,2
116,5
98,4
90,6
130,5
107,4
106
196,5
107,8
90,5
123,8
114,7
115,3
197
88,4
93,8
111,3
105,9
123,6
171
97
99,2
126,6
103,4
121,3
129,6
110,8
98,9
122,8
120,9
133,1
203,1
110,2
119,5
135,1
113,9
137,4
157,1
126,4
112,2
128,8
136,8
156,5
215,2
146,7
130,8
133,1
154,4
160,4
175,1
145,3


Summary of computational transaction
Raw Inputview raw input (R code)
Raw Outputview raw output of R engine
Computing time0 seconds
R Server'Gwilym Jenkins' @ 72.249.127.135

\begin{tabular}{lllllllll}
\hline
Summary of computational transaction \tabularnewline
Raw Input & view raw input (R code)  \tabularnewline
Raw Output & view raw output of R engine  \tabularnewline
Computing time & 0 seconds \tabularnewline
R Server & 'Gwilym Jenkins' @ 72.249.127.135 \tabularnewline
\hline
\end{tabular}
%Source: https://freestatistics.org/blog/index.php?pk=17954&T=0

[TABLE]
[ROW][C]Summary of computational transaction[/C][/ROW]
[ROW][C]Raw Input[/C][C]view raw input (R code) [/C][/ROW]
[ROW][C]Raw Output[/C][C]view raw output of R engine [/C][/ROW]
[ROW][C]Computing time[/C][C]0 seconds[/C][/ROW]
[ROW][C]R Server[/C][C]'Gwilym Jenkins' @ 72.249.127.135[/C][/ROW]
[/TABLE]
Source: https://freestatistics.org/blog/index.php?pk=17954&T=0

Globally Unique Identifier (entire table): ba.freestatistics.org/blog/index.php?pk=17954&T=0

As an alternative you can also use a QR Code:  

The GUIDs for individual cells are displayed in the table below:

Summary of computational transaction
Raw Inputview raw input (R code)
Raw Outputview raw output of R engine
Computing time0 seconds
R Server'Gwilym Jenkins' @ 72.249.127.135


Pearson Product Moment Correlation - Ungrouped Data
StatisticVariable XVariable Y
Mean130.849484536082116.479381443299
Biased Variance605.697345095122820.608028483367
Biased Standard Deviation24.610919224911628.6462567970646
Covariance494.924155927835
Correlation0.694772202202529
Determination0.482708412953352
T-Test9.41535130453213
p-value (2 sided)2.88657986402541e-15
p-value (1 sided)1.44328993201270e-15
Degrees of Freedom95
Number of Observations97

\begin{tabular}{lllllllll}
\hline
Pearson Product Moment Correlation - Ungrouped Data \tabularnewline
Statistic & Variable X & Variable Y \tabularnewline
Mean & 130.849484536082 & 116.479381443299 \tabularnewline
Biased Variance & 605.697345095122 & 820.608028483367 \tabularnewline
Biased Standard Deviation & 24.6109192249116 & 28.6462567970646 \tabularnewline
Covariance & 494.924155927835 \tabularnewline
Correlation & 0.694772202202529 \tabularnewline
Determination & 0.482708412953352 \tabularnewline
T-Test & 9.41535130453213 \tabularnewline
p-value (2 sided) & 2.88657986402541e-15 \tabularnewline
p-value (1 sided) & 1.44328993201270e-15 \tabularnewline
Degrees of Freedom & 95 \tabularnewline
Number of Observations & 97 \tabularnewline
\hline
\end{tabular}
%Source: https://freestatistics.org/blog/index.php?pk=17954&T=1

[TABLE]
[ROW][C]Pearson Product Moment Correlation - Ungrouped Data[/C][/ROW]
[ROW][C]Statistic[/C][C]Variable X[/C][C]Variable Y[/C][/ROW]
[ROW][C]Mean[/C][C]130.849484536082[/C][C]116.479381443299[/C][/ROW]
[ROW][C]Biased Variance[/C][C]605.697345095122[/C][C]820.608028483367[/C][/ROW]
[ROW][C]Biased Standard Deviation[/C][C]24.6109192249116[/C][C]28.6462567970646[/C][/ROW]
[ROW][C]Covariance[/C][C]494.924155927835[/C][/ROW]
[ROW][C]Correlation[/C][C]0.694772202202529[/C][/ROW]
[ROW][C]Determination[/C][C]0.482708412953352[/C][/ROW]
[ROW][C]T-Test[/C][C]9.41535130453213[/C][/ROW]
[ROW][C]p-value (2 sided)[/C][C]2.88657986402541e-15[/C][/ROW]
[ROW][C]p-value (1 sided)[/C][C]1.44328993201270e-15[/C][/ROW]
[ROW][C]Degrees of Freedom[/C][C]95[/C][/ROW]
[ROW][C]Number of Observations[/C][C]97[/C][/ROW]
[/TABLE]
Source: https://freestatistics.org/blog/index.php?pk=17954&T=1

Globally Unique Identifier (entire table): ba.freestatistics.org/blog/index.php?pk=17954&T=1

As an alternative you can also use a QR Code:  

The GUIDs for individual cells are displayed in the table below:

Pearson Product Moment Correlation - Ungrouped Data
StatisticVariable XVariable Y
Mean130.849484536082116.479381443299
Biased Variance605.697345095122820.608028483367
Biased Standard Deviation24.610919224911628.6462567970646
Covariance494.924155927835
Correlation0.694772202202529
Determination0.482708412953352
T-Test9.41535130453213
p-value (2 sided)2.88657986402541e-15
p-value (1 sided)1.44328993201270e-15
Degrees of Freedom95
Number of Observations97


Parameters (Session):
Parameters (R input):
R code (references can be found in the software module):
bitmap(file='test1.png')
histx <- hist(x, plot=FALSE)
histy <- hist(y, plot=FALSE)
maxcounts <- max(c(histx$counts, histx$counts))
xrange <- c(min(x),max(x))
yrange <- c(min(y),max(y))
nf <- layout(matrix(c(2,0,1,3),2,2,byrow=TRUE), c(3,1), c(1,3), TRUE)
par(mar=c(4,4,1,1))
plot(x, y, xlim=xrange, ylim=yrange, xlab=xlab, ylab=ylab)
par(mar=c(0,4,1,1))
barplot(histx$counts, axes=FALSE, ylim=c(0, maxcounts), space=0)
par(mar=c(4,0,1,1))
barplot(histy$counts, axes=FALSE, xlim=c(0, maxcounts), space=0, horiz=TRUE)
dev.off()
lx = length(x)
makebiased = (lx-1)/lx
varx = var(x)*makebiased
vary = var(y)*makebiased
corxy <- cor.test(x,y,method='pearson')
cxy <- as.matrix(corxy$estimate)[1,1]
load(file='createtable')
a<-table.start()
a<-table.row.start(a)
a<-table.element(a,'Pearson Product Moment Correlation - Ungrouped Data',3,TRUE)
a<-table.row.end(a)
a<-table.row.start(a)
a<-table.element(a,'Statistic',1,TRUE)
a<-table.element(a,'Variable X',1,TRUE)
a<-table.element(a,'Variable Y',1,TRUE)
a<-table.row.end(a)
a<-table.row.start(a)
a<-table.element(a,hyperlink('arithmetic_mean.htm','Mean',''),header=TRUE)
a<-table.element(a,mean(x))
a<-table.element(a,mean(y))
a<-table.row.end(a)
a<-table.row.start(a)
a<-table.element(a,hyperlink('biased.htm','Biased Variance',''),header=TRUE)
a<-table.element(a,varx)
a<-table.element(a,vary)
a<-table.row.end(a)
a<-table.row.start(a)
a<-table.element(a,hyperlink('biased1.htm','Biased Standard Deviation',''),header=TRUE)
a<-table.element(a,sqrt(varx))
a<-table.element(a,sqrt(vary))
a<-table.row.end(a)
a<-table.row.start(a)
a<-table.element(a,hyperlink('covariance.htm','Covariance',''),header=TRUE)
a<-table.element(a,cov(x,y),2)
a<-table.row.end(a)
a<-table.row.start(a)
a<-table.element(a,hyperlink('pearson_correlation.htm','Correlation',''),header=TRUE)
a<-table.element(a,cxy,2)
a<-table.row.end(a)
a<-table.row.start(a)
a<-table.element(a,hyperlink('coeff_of_determination.htm','Determination',''),header=TRUE)
a<-table.element(a,cxy*cxy,2)
a<-table.row.end(a)
a<-table.row.start(a)
a<-table.element(a,hyperlink('ttest_statistic.htm','T-Test',''),header=TRUE)
a<-table.element(a,as.matrix(corxy$statistic)[1,1],2)
a<-table.row.end(a)
a<-table.row.start(a)
a<-table.element(a,'p-value (2 sided)',header=TRUE)
a<-table.element(a,(p2 <- as.matrix(corxy$p.value)[1,1]),2)
a<-table.row.end(a)
a<-table.row.start(a)
a<-table.element(a,'p-value (1 sided)',header=TRUE)
a<-table.element(a,p2/2,2)
a<-table.row.end(a)
a<-table.row.start(a)
a<-table.element(a,'Degrees of Freedom',header=TRUE)
a<-table.element(a,lx-2,2)
a<-table.row.end(a)
a<-table.row.start(a)
a<-table.element(a,'Number of Observations',header=TRUE)
a<-table.element(a,lx,2)
a<-table.row.end(a)
a<-table.end(a)
table.save(a,file='mytable.tab')