Free Statistics

of Irreproducible Research!

Author's title

Author*The author of this computation has been verified*
R Software Modulerwasp_centraltendency.wasp
Title produced by softwareCentral Tendency
Date of computationMon, 20 Oct 2008 13:21:47 -0600
Cite this page as followsStatistical Computations at FreeStatistics.org, Office for Research Development and Education, URL https://freestatistics.org/blog/index.php?v=date/2008/Oct/20/t12245305808g8ep6ao7mvted1.htm/, Retrieved Sun, 19 May 2024 15:36:18 +0000
Statistical Computations at FreeStatistics.org, Office for Research Development and Education, URL https://freestatistics.org/blog/index.php?pk=17946, Retrieved Sun, 19 May 2024 15:36:18 +0000
QR Codes:

Original text written by user:
IsPrivate?No (this computation is public)
User-defined keywords
Estimated Impact178
Family? (F = Feedback message, R = changed R code, M = changed R Module, P = changed Parameters, D = changed Data)
F     [Univariate Data Series] [Tijdreeks 1] [2008-10-13 19:18:47] [b82ef11dce0545f3fd4676ec3ebed828]
F RMP     [Central Tendency] [Tijdreeks 1: Indu...] [2008-10-20 19:21:47] [4b953869c7238aca4b6e0cfb0c5cddd6] [Current]
Feedback Forum
2008-10-22 17:21:27 [Romina Machiels] [reply
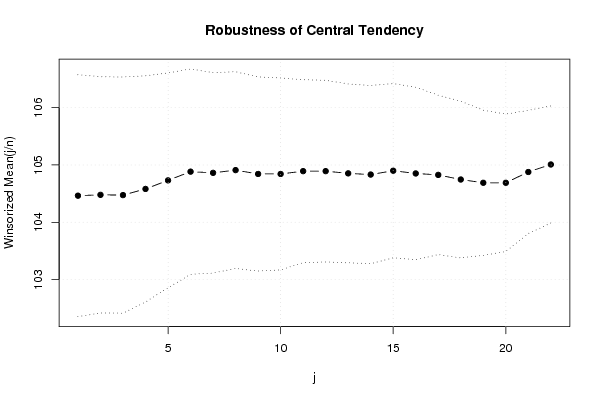
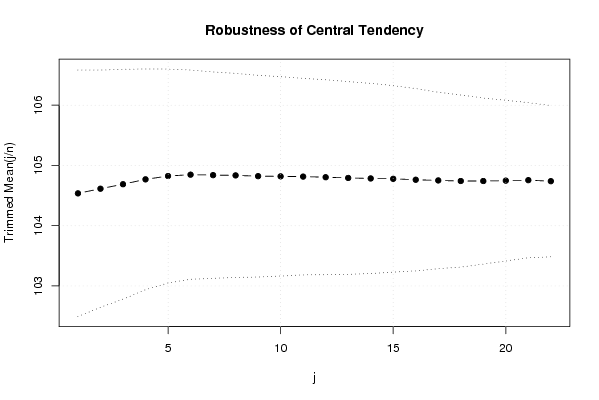
Bij deze vraag moest er maar 1 tijdreeks besproken worden i.p.v. 4. De 1ste tijdreeks werd goed besproken. Het is zeker nuttig om de central tendency te berekenen zo zie je waar outliërs zitten en of de datareeks veel schommelingen vertoont.

Post a new message
Dataseries X:
97.4
97
105.4
102.7
98.1
104.5
87.4
89.9
109.8
111.7
98.6
96.9
95.1
97
112.7
102.9
97.4
111.4
87.4
96.8
114.1
110.3
103.9
101.6
94.6
95.9
104.7
102.8
98.1
113.9
80.9
95.7
113.2
105.9
108.8
102.3
99
100.7
115.5
100.7
109.9
114.6
85.4
100.5
114.8
116.5
112.9
102
106
105.3
118.8
106.1
109.3
117.2
92.5
104.2
112.5
122.4
113.3
100
110.7
112.8
109.8
117.3
109.1
115.9
95.7


Summary of computational transaction
Raw Inputview raw input (R code)
Raw Outputview raw output of R engine
Computing time1 seconds
R Server'Gwilym Jenkins' @ 72.249.127.135

\begin{tabular}{lllllllll}
\hline
Summary of computational transaction \tabularnewline
Raw Input & view raw input (R code)  \tabularnewline
Raw Output & view raw output of R engine  \tabularnewline
Computing time & 1 seconds \tabularnewline
R Server & 'Gwilym Jenkins' @ 72.249.127.135 \tabularnewline
\hline
\end{tabular}
%Source: https://freestatistics.org/blog/index.php?pk=17946&T=0

[TABLE]
[ROW][C]Summary of computational transaction[/C][/ROW]
[ROW][C]Raw Input[/C][C]view raw input (R code) [/C][/ROW]
[ROW][C]Raw Output[/C][C]view raw output of R engine [/C][/ROW]
[ROW][C]Computing time[/C][C]1 seconds[/C][/ROW]
[ROW][C]R Server[/C][C]'Gwilym Jenkins' @ 72.249.127.135[/C][/ROW]
[/TABLE]
Source: https://freestatistics.org/blog/index.php?pk=17946&T=0

Globally Unique Identifier (entire table): ba.freestatistics.org/blog/index.php?pk=17946&T=0

As an alternative you can also use a QR Code:  

The GUIDs for individual cells are displayed in the table below:

Summary of computational transaction
Raw Inputview raw input (R code)
Raw Outputview raw output of R engine
Computing time1 seconds
R Server'Gwilym Jenkins' @ 72.249.127.135


Central Tendency - Ungrouped Data
MeasureValueS.E.Value/S.E.
Arithmetic Mean104.4507462686571.0880677048431395.9965504019029
Geometric Mean104.066757460301
Harmonic Mean103.672315470176
Quadratic Mean104.824115659902
Winsorized Mean ( 1 / 22 )104.4641791044781.0555761811166698.9641306551352
Winsorized Mean ( 2 / 22 )104.4791044776121.03107865365357101.329907381359
Winsorized Mean ( 3 / 22 )104.4746268656721.03023786797145101.408257368158
Winsorized Mean ( 4 / 22 )104.5820895522390.986899547216636105.970349107154
Winsorized Mean ( 5 / 22 )104.7313432835820.93764963275695111.695605293038
Winsorized Mean ( 6 / 22 )104.8835820895520.896219501019086117.028899695097
Winsorized Mean ( 7 / 22 )104.8626865671640.87439540609119.925934922365
Winsorized Mean ( 8 / 22 )104.9104477611940.85841179047579122.214593188481
Winsorized Mean ( 9 / 22 )104.8432835820900.847107040859055123.766275718553
Winsorized Mean ( 10 / 22 )104.8432835820900.83733338630547125.210919923646
Winsorized Mean ( 11 / 22 )104.8925373134330.79807353253481131.432171394379
Winsorized Mean ( 12 / 22 )104.8925373134330.792477389921074132.360290208254
Winsorized Mean ( 13 / 22 )104.8537313432840.780345191329438134.368395561776
Winsorized Mean ( 14 / 22 )104.8328358208960.7770899456472134.904378068597
Winsorized Mean ( 15 / 22 )104.90.760076289346282138.012461999336
Winsorized Mean ( 16 / 22 )104.8522388059700.752686604383665139.303978834362
Winsorized Mean ( 17 / 22 )104.8268656716420.695500113199604150.721565219296
Winsorized Mean ( 18 / 22 )104.7462686567160.683521650673176153.244990196807
Winsorized Mean ( 19 / 22 )104.6895522388060.633838265457951165.167611272518
Winsorized Mean ( 20 / 22 )104.6895522388060.599514104205544174.624002178459
Winsorized Mean ( 21 / 22 )104.8776119402980.537620521321338195.0773971249
Winsorized Mean ( 22 / 22 )105.0089552238810.51068958329865205.621885893199
Trimmed Mean ( 1 / 22 )104.5369230769231.02350634423358102.136077285581
Trimmed Mean ( 2 / 22 )104.6142857142860.984758027368788106.233493718054
Trimmed Mean ( 3 / 22 )104.6885245901640.953887926768226109.749291979037
Trimmed Mean ( 4 / 22 )104.7694915254240.916506384207302114.313978964849
Trimmed Mean ( 5 / 22 )104.8245614035090.887737686417378118.080558037979
Trimmed Mean ( 6 / 22 )104.8472727272730.868637442803439120.703146745423
Trimmed Mean ( 7 / 22 )104.8396226415090.85664541179979122.383918944064
Trimmed Mean ( 8 / 22 )104.8352941176470.846769286027837123.806207720908
Trimmed Mean ( 9 / 22 )104.8224489795920.837468982602203125.165768711678
Trimmed Mean ( 10 / 22 )104.8191489361700.827458008458436126.676094574817
Trimmed Mean ( 11 / 22 )104.8155555555560.815964172537126128.456075748579
Trimmed Mean ( 12 / 22 )104.8046511627910.809015873236856129.545852720379
Trimmed Mean ( 13 / 22 )104.7926829268290.799797156021012131.024075464550
Trimmed Mean ( 14 / 22 )104.7846153846150.78901481525902132.804369903012
Trimmed Mean ( 15 / 22 )104.7783783783780.773899830711315135.390103758097
Trimmed Mean ( 16 / 22 )104.7628571428570.756241099279916138.531028322331
Trimmed Mean ( 17 / 22 )104.7515151515150.732421797616311143.020750464326
Trimmed Mean ( 18 / 22 )104.7419354838710.713883430644967146.721342711709
Trimmed Mean ( 19 / 22 )104.7413793103450.689032970558544152.012144245346
Trimmed Mean ( 20 / 22 )104.7481481481480.666973655181154157.049903447383
Trimmed Mean ( 21 / 22 )104.7560.643456292221935162.802044624141
Trimmed Mean ( 22 / 22 )104.7391304347830.627648196141717166.875538046051
Median104.5
Midrange101.65
Midmean - Weighted Average at Xnp104.331428571429
Midmean - Weighted Average at X(n+1)p104.558333333333
Midmean - Empirical Distribution Function104.558333333333
Midmean - Empirical Distribution Function - Averaging104.558333333333
Midmean - Empirical Distribution Function - Interpolation104.751515151515
Midmean - Closest Observation104.331428571429
Midmean - True Basic - Statistics Graphics Toolkit104.558333333333
Midmean - MS Excel (old versions)104.558333333333
Number of observations67

\begin{tabular}{lllllllll}
\hline
Central Tendency - Ungrouped Data \tabularnewline
Measure & Value & S.E. & Value/S.E. \tabularnewline
Arithmetic Mean & 104.450746268657 & 1.08806770484313 & 95.9965504019029 \tabularnewline
Geometric Mean & 104.066757460301 &  &  \tabularnewline
Harmonic Mean & 103.672315470176 &  &  \tabularnewline
Quadratic Mean & 104.824115659902 &  &  \tabularnewline
Winsorized Mean ( 1 / 22 ) & 104.464179104478 & 1.05557618111666 & 98.9641306551352 \tabularnewline
Winsorized Mean ( 2 / 22 ) & 104.479104477612 & 1.03107865365357 & 101.329907381359 \tabularnewline
Winsorized Mean ( 3 / 22 ) & 104.474626865672 & 1.03023786797145 & 101.408257368158 \tabularnewline
Winsorized Mean ( 4 / 22 ) & 104.582089552239 & 0.986899547216636 & 105.970349107154 \tabularnewline
Winsorized Mean ( 5 / 22 ) & 104.731343283582 & 0.93764963275695 & 111.695605293038 \tabularnewline
Winsorized Mean ( 6 / 22 ) & 104.883582089552 & 0.896219501019086 & 117.028899695097 \tabularnewline
Winsorized Mean ( 7 / 22 ) & 104.862686567164 & 0.87439540609 & 119.925934922365 \tabularnewline
Winsorized Mean ( 8 / 22 ) & 104.910447761194 & 0.85841179047579 & 122.214593188481 \tabularnewline
Winsorized Mean ( 9 / 22 ) & 104.843283582090 & 0.847107040859055 & 123.766275718553 \tabularnewline
Winsorized Mean ( 10 / 22 ) & 104.843283582090 & 0.83733338630547 & 125.210919923646 \tabularnewline
Winsorized Mean ( 11 / 22 ) & 104.892537313433 & 0.79807353253481 & 131.432171394379 \tabularnewline
Winsorized Mean ( 12 / 22 ) & 104.892537313433 & 0.792477389921074 & 132.360290208254 \tabularnewline
Winsorized Mean ( 13 / 22 ) & 104.853731343284 & 0.780345191329438 & 134.368395561776 \tabularnewline
Winsorized Mean ( 14 / 22 ) & 104.832835820896 & 0.7770899456472 & 134.904378068597 \tabularnewline
Winsorized Mean ( 15 / 22 ) & 104.9 & 0.760076289346282 & 138.012461999336 \tabularnewline
Winsorized Mean ( 16 / 22 ) & 104.852238805970 & 0.752686604383665 & 139.303978834362 \tabularnewline
Winsorized Mean ( 17 / 22 ) & 104.826865671642 & 0.695500113199604 & 150.721565219296 \tabularnewline
Winsorized Mean ( 18 / 22 ) & 104.746268656716 & 0.683521650673176 & 153.244990196807 \tabularnewline
Winsorized Mean ( 19 / 22 ) & 104.689552238806 & 0.633838265457951 & 165.167611272518 \tabularnewline
Winsorized Mean ( 20 / 22 ) & 104.689552238806 & 0.599514104205544 & 174.624002178459 \tabularnewline
Winsorized Mean ( 21 / 22 ) & 104.877611940298 & 0.537620521321338 & 195.0773971249 \tabularnewline
Winsorized Mean ( 22 / 22 ) & 105.008955223881 & 0.51068958329865 & 205.621885893199 \tabularnewline
Trimmed Mean ( 1 / 22 ) & 104.536923076923 & 1.02350634423358 & 102.136077285581 \tabularnewline
Trimmed Mean ( 2 / 22 ) & 104.614285714286 & 0.984758027368788 & 106.233493718054 \tabularnewline
Trimmed Mean ( 3 / 22 ) & 104.688524590164 & 0.953887926768226 & 109.749291979037 \tabularnewline
Trimmed Mean ( 4 / 22 ) & 104.769491525424 & 0.916506384207302 & 114.313978964849 \tabularnewline
Trimmed Mean ( 5 / 22 ) & 104.824561403509 & 0.887737686417378 & 118.080558037979 \tabularnewline
Trimmed Mean ( 6 / 22 ) & 104.847272727273 & 0.868637442803439 & 120.703146745423 \tabularnewline
Trimmed Mean ( 7 / 22 ) & 104.839622641509 & 0.85664541179979 & 122.383918944064 \tabularnewline
Trimmed Mean ( 8 / 22 ) & 104.835294117647 & 0.846769286027837 & 123.806207720908 \tabularnewline
Trimmed Mean ( 9 / 22 ) & 104.822448979592 & 0.837468982602203 & 125.165768711678 \tabularnewline
Trimmed Mean ( 10 / 22 ) & 104.819148936170 & 0.827458008458436 & 126.676094574817 \tabularnewline
Trimmed Mean ( 11 / 22 ) & 104.815555555556 & 0.815964172537126 & 128.456075748579 \tabularnewline
Trimmed Mean ( 12 / 22 ) & 104.804651162791 & 0.809015873236856 & 129.545852720379 \tabularnewline
Trimmed Mean ( 13 / 22 ) & 104.792682926829 & 0.799797156021012 & 131.024075464550 \tabularnewline
Trimmed Mean ( 14 / 22 ) & 104.784615384615 & 0.78901481525902 & 132.804369903012 \tabularnewline
Trimmed Mean ( 15 / 22 ) & 104.778378378378 & 0.773899830711315 & 135.390103758097 \tabularnewline
Trimmed Mean ( 16 / 22 ) & 104.762857142857 & 0.756241099279916 & 138.531028322331 \tabularnewline
Trimmed Mean ( 17 / 22 ) & 104.751515151515 & 0.732421797616311 & 143.020750464326 \tabularnewline
Trimmed Mean ( 18 / 22 ) & 104.741935483871 & 0.713883430644967 & 146.721342711709 \tabularnewline
Trimmed Mean ( 19 / 22 ) & 104.741379310345 & 0.689032970558544 & 152.012144245346 \tabularnewline
Trimmed Mean ( 20 / 22 ) & 104.748148148148 & 0.666973655181154 & 157.049903447383 \tabularnewline
Trimmed Mean ( 21 / 22 ) & 104.756 & 0.643456292221935 & 162.802044624141 \tabularnewline
Trimmed Mean ( 22 / 22 ) & 104.739130434783 & 0.627648196141717 & 166.875538046051 \tabularnewline
Median & 104.5 &  &  \tabularnewline
Midrange & 101.65 &  &  \tabularnewline
Midmean - Weighted Average at Xnp & 104.331428571429 &  &  \tabularnewline
Midmean - Weighted Average at X(n+1)p & 104.558333333333 &  &  \tabularnewline
Midmean - Empirical Distribution Function & 104.558333333333 &  &  \tabularnewline
Midmean - Empirical Distribution Function - Averaging & 104.558333333333 &  &  \tabularnewline
Midmean - Empirical Distribution Function - Interpolation & 104.751515151515 &  &  \tabularnewline
Midmean - Closest Observation & 104.331428571429 &  &  \tabularnewline
Midmean - True Basic - Statistics Graphics Toolkit & 104.558333333333 &  &  \tabularnewline
Midmean - MS Excel (old versions) & 104.558333333333 &  &  \tabularnewline
Number of observations & 67 &  &  \tabularnewline
\hline
\end{tabular}
%Source: https://freestatistics.org/blog/index.php?pk=17946&T=1

[TABLE]
[ROW][C]Central Tendency - Ungrouped Data[/C][/ROW]
[ROW][C]Measure[/C][C]Value[/C][C]S.E.[/C][C]Value/S.E.[/C][/ROW]
[ROW][C]Arithmetic Mean[/C][C]104.450746268657[/C][C]1.08806770484313[/C][C]95.9965504019029[/C][/ROW]
[ROW][C]Geometric Mean[/C][C]104.066757460301[/C][C][/C][C][/C][/ROW]
[ROW][C]Harmonic Mean[/C][C]103.672315470176[/C][C][/C][C][/C][/ROW]
[ROW][C]Quadratic Mean[/C][C]104.824115659902[/C][C][/C][C][/C][/ROW]
[ROW][C]Winsorized Mean ( 1 / 22 )[/C][C]104.464179104478[/C][C]1.05557618111666[/C][C]98.9641306551352[/C][/ROW]
[ROW][C]Winsorized Mean ( 2 / 22 )[/C][C]104.479104477612[/C][C]1.03107865365357[/C][C]101.329907381359[/C][/ROW]
[ROW][C]Winsorized Mean ( 3 / 22 )[/C][C]104.474626865672[/C][C]1.03023786797145[/C][C]101.408257368158[/C][/ROW]
[ROW][C]Winsorized Mean ( 4 / 22 )[/C][C]104.582089552239[/C][C]0.986899547216636[/C][C]105.970349107154[/C][/ROW]
[ROW][C]Winsorized Mean ( 5 / 22 )[/C][C]104.731343283582[/C][C]0.93764963275695[/C][C]111.695605293038[/C][/ROW]
[ROW][C]Winsorized Mean ( 6 / 22 )[/C][C]104.883582089552[/C][C]0.896219501019086[/C][C]117.028899695097[/C][/ROW]
[ROW][C]Winsorized Mean ( 7 / 22 )[/C][C]104.862686567164[/C][C]0.87439540609[/C][C]119.925934922365[/C][/ROW]
[ROW][C]Winsorized Mean ( 8 / 22 )[/C][C]104.910447761194[/C][C]0.85841179047579[/C][C]122.214593188481[/C][/ROW]
[ROW][C]Winsorized Mean ( 9 / 22 )[/C][C]104.843283582090[/C][C]0.847107040859055[/C][C]123.766275718553[/C][/ROW]
[ROW][C]Winsorized Mean ( 10 / 22 )[/C][C]104.843283582090[/C][C]0.83733338630547[/C][C]125.210919923646[/C][/ROW]
[ROW][C]Winsorized Mean ( 11 / 22 )[/C][C]104.892537313433[/C][C]0.79807353253481[/C][C]131.432171394379[/C][/ROW]
[ROW][C]Winsorized Mean ( 12 / 22 )[/C][C]104.892537313433[/C][C]0.792477389921074[/C][C]132.360290208254[/C][/ROW]
[ROW][C]Winsorized Mean ( 13 / 22 )[/C][C]104.853731343284[/C][C]0.780345191329438[/C][C]134.368395561776[/C][/ROW]
[ROW][C]Winsorized Mean ( 14 / 22 )[/C][C]104.832835820896[/C][C]0.7770899456472[/C][C]134.904378068597[/C][/ROW]
[ROW][C]Winsorized Mean ( 15 / 22 )[/C][C]104.9[/C][C]0.760076289346282[/C][C]138.012461999336[/C][/ROW]
[ROW][C]Winsorized Mean ( 16 / 22 )[/C][C]104.852238805970[/C][C]0.752686604383665[/C][C]139.303978834362[/C][/ROW]
[ROW][C]Winsorized Mean ( 17 / 22 )[/C][C]104.826865671642[/C][C]0.695500113199604[/C][C]150.721565219296[/C][/ROW]
[ROW][C]Winsorized Mean ( 18 / 22 )[/C][C]104.746268656716[/C][C]0.683521650673176[/C][C]153.244990196807[/C][/ROW]
[ROW][C]Winsorized Mean ( 19 / 22 )[/C][C]104.689552238806[/C][C]0.633838265457951[/C][C]165.167611272518[/C][/ROW]
[ROW][C]Winsorized Mean ( 20 / 22 )[/C][C]104.689552238806[/C][C]0.599514104205544[/C][C]174.624002178459[/C][/ROW]
[ROW][C]Winsorized Mean ( 21 / 22 )[/C][C]104.877611940298[/C][C]0.537620521321338[/C][C]195.0773971249[/C][/ROW]
[ROW][C]Winsorized Mean ( 22 / 22 )[/C][C]105.008955223881[/C][C]0.51068958329865[/C][C]205.621885893199[/C][/ROW]
[ROW][C]Trimmed Mean ( 1 / 22 )[/C][C]104.536923076923[/C][C]1.02350634423358[/C][C]102.136077285581[/C][/ROW]
[ROW][C]Trimmed Mean ( 2 / 22 )[/C][C]104.614285714286[/C][C]0.984758027368788[/C][C]106.233493718054[/C][/ROW]
[ROW][C]Trimmed Mean ( 3 / 22 )[/C][C]104.688524590164[/C][C]0.953887926768226[/C][C]109.749291979037[/C][/ROW]
[ROW][C]Trimmed Mean ( 4 / 22 )[/C][C]104.769491525424[/C][C]0.916506384207302[/C][C]114.313978964849[/C][/ROW]
[ROW][C]Trimmed Mean ( 5 / 22 )[/C][C]104.824561403509[/C][C]0.887737686417378[/C][C]118.080558037979[/C][/ROW]
[ROW][C]Trimmed Mean ( 6 / 22 )[/C][C]104.847272727273[/C][C]0.868637442803439[/C][C]120.703146745423[/C][/ROW]
[ROW][C]Trimmed Mean ( 7 / 22 )[/C][C]104.839622641509[/C][C]0.85664541179979[/C][C]122.383918944064[/C][/ROW]
[ROW][C]Trimmed Mean ( 8 / 22 )[/C][C]104.835294117647[/C][C]0.846769286027837[/C][C]123.806207720908[/C][/ROW]
[ROW][C]Trimmed Mean ( 9 / 22 )[/C][C]104.822448979592[/C][C]0.837468982602203[/C][C]125.165768711678[/C][/ROW]
[ROW][C]Trimmed Mean ( 10 / 22 )[/C][C]104.819148936170[/C][C]0.827458008458436[/C][C]126.676094574817[/C][/ROW]
[ROW][C]Trimmed Mean ( 11 / 22 )[/C][C]104.815555555556[/C][C]0.815964172537126[/C][C]128.456075748579[/C][/ROW]
[ROW][C]Trimmed Mean ( 12 / 22 )[/C][C]104.804651162791[/C][C]0.809015873236856[/C][C]129.545852720379[/C][/ROW]
[ROW][C]Trimmed Mean ( 13 / 22 )[/C][C]104.792682926829[/C][C]0.799797156021012[/C][C]131.024075464550[/C][/ROW]
[ROW][C]Trimmed Mean ( 14 / 22 )[/C][C]104.784615384615[/C][C]0.78901481525902[/C][C]132.804369903012[/C][/ROW]
[ROW][C]Trimmed Mean ( 15 / 22 )[/C][C]104.778378378378[/C][C]0.773899830711315[/C][C]135.390103758097[/C][/ROW]
[ROW][C]Trimmed Mean ( 16 / 22 )[/C][C]104.762857142857[/C][C]0.756241099279916[/C][C]138.531028322331[/C][/ROW]
[ROW][C]Trimmed Mean ( 17 / 22 )[/C][C]104.751515151515[/C][C]0.732421797616311[/C][C]143.020750464326[/C][/ROW]
[ROW][C]Trimmed Mean ( 18 / 22 )[/C][C]104.741935483871[/C][C]0.713883430644967[/C][C]146.721342711709[/C][/ROW]
[ROW][C]Trimmed Mean ( 19 / 22 )[/C][C]104.741379310345[/C][C]0.689032970558544[/C][C]152.012144245346[/C][/ROW]
[ROW][C]Trimmed Mean ( 20 / 22 )[/C][C]104.748148148148[/C][C]0.666973655181154[/C][C]157.049903447383[/C][/ROW]
[ROW][C]Trimmed Mean ( 21 / 22 )[/C][C]104.756[/C][C]0.643456292221935[/C][C]162.802044624141[/C][/ROW]
[ROW][C]Trimmed Mean ( 22 / 22 )[/C][C]104.739130434783[/C][C]0.627648196141717[/C][C]166.875538046051[/C][/ROW]
[ROW][C]Median[/C][C]104.5[/C][C][/C][C][/C][/ROW]
[ROW][C]Midrange[/C][C]101.65[/C][C][/C][C][/C][/ROW]
[ROW][C]Midmean - Weighted Average at Xnp[/C][C]104.331428571429[/C][C][/C][C][/C][/ROW]
[ROW][C]Midmean - Weighted Average at X(n+1)p[/C][C]104.558333333333[/C][C][/C][C][/C][/ROW]
[ROW][C]Midmean - Empirical Distribution Function[/C][C]104.558333333333[/C][C][/C][C][/C][/ROW]
[ROW][C]Midmean - Empirical Distribution Function - Averaging[/C][C]104.558333333333[/C][C][/C][C][/C][/ROW]
[ROW][C]Midmean - Empirical Distribution Function - Interpolation[/C][C]104.751515151515[/C][C][/C][C][/C][/ROW]
[ROW][C]Midmean - Closest Observation[/C][C]104.331428571429[/C][C][/C][C][/C][/ROW]
[ROW][C]Midmean - True Basic - Statistics Graphics Toolkit[/C][C]104.558333333333[/C][C][/C][C][/C][/ROW]
[ROW][C]Midmean - MS Excel (old versions)[/C][C]104.558333333333[/C][C][/C][C][/C][/ROW]
[ROW][C]Number of observations[/C][C]67[/C][C][/C][C][/C][/ROW]
[/TABLE]
Source: https://freestatistics.org/blog/index.php?pk=17946&T=1

Globally Unique Identifier (entire table): ba.freestatistics.org/blog/index.php?pk=17946&T=1

As an alternative you can also use a QR Code:  

The GUIDs for individual cells are displayed in the table below:

Central Tendency - Ungrouped Data
MeasureValueS.E.Value/S.E.
Arithmetic Mean104.4507462686571.0880677048431395.9965504019029
Geometric Mean104.066757460301
Harmonic Mean103.672315470176
Quadratic Mean104.824115659902
Winsorized Mean ( 1 / 22 )104.4641791044781.0555761811166698.9641306551352
Winsorized Mean ( 2 / 22 )104.4791044776121.03107865365357101.329907381359
Winsorized Mean ( 3 / 22 )104.4746268656721.03023786797145101.408257368158
Winsorized Mean ( 4 / 22 )104.5820895522390.986899547216636105.970349107154
Winsorized Mean ( 5 / 22 )104.7313432835820.93764963275695111.695605293038
Winsorized Mean ( 6 / 22 )104.8835820895520.896219501019086117.028899695097
Winsorized Mean ( 7 / 22 )104.8626865671640.87439540609119.925934922365
Winsorized Mean ( 8 / 22 )104.9104477611940.85841179047579122.214593188481
Winsorized Mean ( 9 / 22 )104.8432835820900.847107040859055123.766275718553
Winsorized Mean ( 10 / 22 )104.8432835820900.83733338630547125.210919923646
Winsorized Mean ( 11 / 22 )104.8925373134330.79807353253481131.432171394379
Winsorized Mean ( 12 / 22 )104.8925373134330.792477389921074132.360290208254
Winsorized Mean ( 13 / 22 )104.8537313432840.780345191329438134.368395561776
Winsorized Mean ( 14 / 22 )104.8328358208960.7770899456472134.904378068597
Winsorized Mean ( 15 / 22 )104.90.760076289346282138.012461999336
Winsorized Mean ( 16 / 22 )104.8522388059700.752686604383665139.303978834362
Winsorized Mean ( 17 / 22 )104.8268656716420.695500113199604150.721565219296
Winsorized Mean ( 18 / 22 )104.7462686567160.683521650673176153.244990196807
Winsorized Mean ( 19 / 22 )104.6895522388060.633838265457951165.167611272518
Winsorized Mean ( 20 / 22 )104.6895522388060.599514104205544174.624002178459
Winsorized Mean ( 21 / 22 )104.8776119402980.537620521321338195.0773971249
Winsorized Mean ( 22 / 22 )105.0089552238810.51068958329865205.621885893199
Trimmed Mean ( 1 / 22 )104.5369230769231.02350634423358102.136077285581
Trimmed Mean ( 2 / 22 )104.6142857142860.984758027368788106.233493718054
Trimmed Mean ( 3 / 22 )104.6885245901640.953887926768226109.749291979037
Trimmed Mean ( 4 / 22 )104.7694915254240.916506384207302114.313978964849
Trimmed Mean ( 5 / 22 )104.8245614035090.887737686417378118.080558037979
Trimmed Mean ( 6 / 22 )104.8472727272730.868637442803439120.703146745423
Trimmed Mean ( 7 / 22 )104.8396226415090.85664541179979122.383918944064
Trimmed Mean ( 8 / 22 )104.8352941176470.846769286027837123.806207720908
Trimmed Mean ( 9 / 22 )104.8224489795920.837468982602203125.165768711678
Trimmed Mean ( 10 / 22 )104.8191489361700.827458008458436126.676094574817
Trimmed Mean ( 11 / 22 )104.8155555555560.815964172537126128.456075748579
Trimmed Mean ( 12 / 22 )104.8046511627910.809015873236856129.545852720379
Trimmed Mean ( 13 / 22 )104.7926829268290.799797156021012131.024075464550
Trimmed Mean ( 14 / 22 )104.7846153846150.78901481525902132.804369903012
Trimmed Mean ( 15 / 22 )104.7783783783780.773899830711315135.390103758097
Trimmed Mean ( 16 / 22 )104.7628571428570.756241099279916138.531028322331
Trimmed Mean ( 17 / 22 )104.7515151515150.732421797616311143.020750464326
Trimmed Mean ( 18 / 22 )104.7419354838710.713883430644967146.721342711709
Trimmed Mean ( 19 / 22 )104.7413793103450.689032970558544152.012144245346
Trimmed Mean ( 20 / 22 )104.7481481481480.666973655181154157.049903447383
Trimmed Mean ( 21 / 22 )104.7560.643456292221935162.802044624141
Trimmed Mean ( 22 / 22 )104.7391304347830.627648196141717166.875538046051
Median104.5
Midrange101.65
Midmean - Weighted Average at Xnp104.331428571429
Midmean - Weighted Average at X(n+1)p104.558333333333
Midmean - Empirical Distribution Function104.558333333333
Midmean - Empirical Distribution Function - Averaging104.558333333333
Midmean - Empirical Distribution Function - Interpolation104.751515151515
Midmean - Closest Observation104.331428571429
Midmean - True Basic - Statistics Graphics Toolkit104.558333333333
Midmean - MS Excel (old versions)104.558333333333
Number of observations67


Parameters (Session):
Parameters (R input):
R code (references can be found in the software module):
geomean <- function(x) {
return(exp(mean(log(x))))
}
harmean <- function(x) {
return(1/mean(1/x))
}
quamean <- function(x) {
return(sqrt(mean(x*x)))
}
winmean <- function(x) {
x <-sort(x[!is.na(x)])
n<-length(x)
denom <- 3
nodenom <- n/denom
if (nodenom>40) denom <- n/40
sqrtn = sqrt(n)
roundnodenom = floor(nodenom)
win <- array(NA,dim=c(roundnodenom,2))
for (j in 1:roundnodenom) {
win[j,1] <- (j*x[j+1]+sum(x[(j+1):(n-j)])+j*x[n-j])/n
win[j,2] <- sd(c(rep(x[j+1],j),x[(j+1):(n-j)],rep(x[n-j],j)))/sqrtn
}
return(win)
}
trimean <- function(x) {
x <-sort(x[!is.na(x)])
n<-length(x)
denom <- 3
nodenom <- n/denom
if (nodenom>40) denom <- n/40
sqrtn = sqrt(n)
roundnodenom = floor(nodenom)
tri <- array(NA,dim=c(roundnodenom,2))
for (j in 1:roundnodenom) {
tri[j,1] <- mean(x,trim=j/n)
tri[j,2] <- sd(x[(j+1):(n-j)]) / sqrt(n-j*2)
}
return(tri)
}
midrange <- function(x) {
return((max(x)+min(x))/2)
}
q1 <- function(data,n,p,i,f) {
np <- n*p;
i <<- floor(np)
f <<- np - i
qvalue <- (1-f)*data[i] + f*data[i+1]
}
q2 <- function(data,n,p,i,f) {
np <- (n+1)*p
i <<- floor(np)
f <<- np - i
qvalue <- (1-f)*data[i] + f*data[i+1]
}
q3 <- function(data,n,p,i,f) {
np <- n*p
i <<- floor(np)
f <<- np - i
if (f==0) {
qvalue <- data[i]
} else {
qvalue <- data[i+1]
}
}
q4 <- function(data,n,p,i,f) {
np <- n*p
i <<- floor(np)
f <<- np - i
if (f==0) {
qvalue <- (data[i]+data[i+1])/2
} else {
qvalue <- data[i+1]
}
}
q5 <- function(data,n,p,i,f) {
np <- (n-1)*p
i <<- floor(np)
f <<- np - i
if (f==0) {
qvalue <- data[i+1]
} else {
qvalue <- data[i+1] + f*(data[i+2]-data[i+1])
}
}
q6 <- function(data,n,p,i,f) {
np <- n*p+0.5
i <<- floor(np)
f <<- np - i
qvalue <- data[i]
}
q7 <- function(data,n,p,i,f) {
np <- (n+1)*p
i <<- floor(np)
f <<- np - i
if (f==0) {
qvalue <- data[i]
} else {
qvalue <- f*data[i] + (1-f)*data[i+1]
}
}
q8 <- function(data,n,p,i,f) {
np <- (n+1)*p
i <<- floor(np)
f <<- np - i
if (f==0) {
qvalue <- data[i]
} else {
if (f == 0.5) {
qvalue <- (data[i]+data[i+1])/2
} else {
if (f < 0.5) {
qvalue <- data[i]
} else {
qvalue <- data[i+1]
}
}
}
}
midmean <- function(x,def) {
x <-sort(x[!is.na(x)])
n<-length(x)
if (def==1) {
qvalue1 <- q1(x,n,0.25,i,f)
qvalue3 <- q1(x,n,0.75,i,f)
}
if (def==2) {
qvalue1 <- q2(x,n,0.25,i,f)
qvalue3 <- q2(x,n,0.75,i,f)
}
if (def==3) {
qvalue1 <- q3(x,n,0.25,i,f)
qvalue3 <- q3(x,n,0.75,i,f)
}
if (def==4) {
qvalue1 <- q4(x,n,0.25,i,f)
qvalue3 <- q4(x,n,0.75,i,f)
}
if (def==5) {
qvalue1 <- q5(x,n,0.25,i,f)
qvalue3 <- q5(x,n,0.75,i,f)
}
if (def==6) {
qvalue1 <- q6(x,n,0.25,i,f)
qvalue3 <- q6(x,n,0.75,i,f)
}
if (def==7) {
qvalue1 <- q7(x,n,0.25,i,f)
qvalue3 <- q7(x,n,0.75,i,f)
}
if (def==8) {
qvalue1 <- q8(x,n,0.25,i,f)
qvalue3 <- q8(x,n,0.75,i,f)
}
midm <- 0
myn <- 0
roundno4 <- round(n/4)
round3no4 <- round(3*n/4)
for (i in 1:n) {
if ((x[i]>=qvalue1) & (x[i]<=qvalue3)){
midm = midm + x[i]
myn = myn + 1
}
}
midm = midm / myn
return(midm)
}
(arm <- mean(x))
sqrtn <- sqrt(length(x))
(armse <- sd(x) / sqrtn)
(armose <- arm / armse)
(geo <- geomean(x))
(har <- harmean(x))
(qua <- quamean(x))
(win <- winmean(x))
(tri <- trimean(x))
(midr <- midrange(x))
midm <- array(NA,dim=8)
for (j in 1:8) midm[j] <- midmean(x,j)
midm
bitmap(file='test1.png')
lb <- win[,1] - 2*win[,2]
ub <- win[,1] + 2*win[,2]
if ((ylimmin == '') | (ylimmax == '')) plot(win[,1],type='b',main=main, xlab='j', pch=19, ylab='Winsorized Mean(j/n)', ylim=c(min(lb),max(ub))) else plot(win[,1],type='l',main=main, xlab='j', pch=19, ylab='Winsorized Mean(j/n)', ylim=c(ylimmin,ylimmax))
lines(ub,lty=3)
lines(lb,lty=3)
grid()
dev.off()
bitmap(file='test2.png')
lb <- tri[,1] - 2*tri[,2]
ub <- tri[,1] + 2*tri[,2]
if ((ylimmin == '') | (ylimmax == '')) plot(tri[,1],type='b',main=main, xlab='j', pch=19, ylab='Trimmed Mean(j/n)', ylim=c(min(lb),max(ub))) else plot(tri[,1],type='l',main=main, xlab='j', pch=19, ylab='Trimmed Mean(j/n)', ylim=c(ylimmin,ylimmax))
lines(ub,lty=3)
lines(lb,lty=3)
grid()
dev.off()
load(file='createtable')
a<-table.start()
a<-table.row.start(a)
a<-table.element(a,'Central Tendency - Ungrouped Data',4,TRUE)
a<-table.row.end(a)
a<-table.row.start(a)
a<-table.element(a,'Measure',header=TRUE)
a<-table.element(a,'Value',header=TRUE)
a<-table.element(a,'S.E.',header=TRUE)
a<-table.element(a,'Value/S.E.',header=TRUE)
a<-table.row.end(a)
a<-table.row.start(a)
a<-table.element(a,hyperlink('arithmetic_mean.htm', 'Arithmetic Mean', 'click to view the definition of the Arithmetic Mean'),header=TRUE)
a<-table.element(a,arm)
a<-table.element(a,hyperlink('arithmetic_mean_standard_error.htm', armse, 'click to view the definition of the Standard Error of the Arithmetic Mean'))
a<-table.element(a,armose)
a<-table.row.end(a)
a<-table.row.start(a)
a<-table.element(a,hyperlink('geometric_mean.htm', 'Geometric Mean', 'click to view the definition of the Geometric Mean'),header=TRUE)
a<-table.element(a,geo)
a<-table.element(a,'')
a<-table.row.end(a)
a<-table.row.start(a)
a<-table.element(a,hyperlink('harmonic_mean.htm', 'Harmonic Mean', 'click to view the definition of the Harmonic Mean'),header=TRUE)
a<-table.element(a,har)
a<-table.element(a,'')
a<-table.row.end(a)
a<-table.row.start(a)
a<-table.element(a,hyperlink('quadratic_mean.htm', 'Quadratic Mean', 'click to view the definition of the Quadratic Mean'),header=TRUE)
a<-table.element(a,qua)
a<-table.element(a,'')
a<-table.row.end(a)
for (j in 1:length(win[,1])) {
a<-table.row.start(a)
mylabel <- paste('Winsorized Mean (',j)
mylabel <- paste(mylabel,'/')
mylabel <- paste(mylabel,length(win[,1]))
mylabel <- paste(mylabel,')')
a<-table.element(a,hyperlink('winsorized_mean.htm', mylabel, 'click to view the definition of the Winsorized Mean'),header=TRUE)
a<-table.element(a,win[j,1])
a<-table.element(a,win[j,2])
a<-table.element(a,win[j,1]/win[j,2])
a<-table.row.end(a)
}
for (j in 1:length(tri[,1])) {
a<-table.row.start(a)
mylabel <- paste('Trimmed Mean (',j)
mylabel <- paste(mylabel,'/')
mylabel <- paste(mylabel,length(tri[,1]))
mylabel <- paste(mylabel,')')
a<-table.element(a,hyperlink('arithmetic_mean.htm', mylabel, 'click to view the definition of the Trimmed Mean'),header=TRUE)
a<-table.element(a,tri[j,1])
a<-table.element(a,tri[j,2])
a<-table.element(a,tri[j,1]/tri[j,2])
a<-table.row.end(a)
}
a<-table.row.start(a)
a<-table.element(a,hyperlink('median_1.htm', 'Median', 'click to view the definition of the Median'),header=TRUE)
a<-table.element(a,median(x))
a<-table.element(a,'')
a<-table.row.end(a)
a<-table.row.start(a)
a<-table.element(a,hyperlink('midrange.htm', 'Midrange', 'click to view the definition of the Midrange'),header=TRUE)
a<-table.element(a,midr)
a<-table.element(a,'')
a<-table.row.end(a)
a<-table.row.start(a)
mymid <- hyperlink('midmean.htm', 'Midmean', 'click to view the definition of the Midmean')
mylabel <- paste(mymid,hyperlink('method_1.htm','Weighted Average at Xnp',''),sep=' - ')
a<-table.element(a,mylabel,header=TRUE)
a<-table.element(a,midm[1])
a<-table.element(a,'')
a<-table.row.end(a)
a<-table.row.start(a)
mymid <- hyperlink('midmean.htm', 'Midmean', 'click to view the definition of the Midmean')
mylabel <- paste(mymid,hyperlink('method_2.htm','Weighted Average at X(n+1)p',''),sep=' - ')
a<-table.element(a,mylabel,header=TRUE)
a<-table.element(a,midm[2])
a<-table.element(a,'')
a<-table.row.end(a)
a<-table.row.start(a)
mymid <- hyperlink('midmean.htm', 'Midmean', 'click to view the definition of the Midmean')
mylabel <- paste(mymid,hyperlink('method_3.htm','Empirical Distribution Function',''),sep=' - ')
a<-table.element(a,mylabel,header=TRUE)
a<-table.element(a,midm[3])
a<-table.element(a,'')
a<-table.row.end(a)
a<-table.row.start(a)
mymid <- hyperlink('midmean.htm', 'Midmean', 'click to view the definition of the Midmean')
mylabel <- paste(mymid,hyperlink('method_4.htm','Empirical Distribution Function - Averaging',''),sep=' - ')
a<-table.element(a,mylabel,header=TRUE)
a<-table.element(a,midm[4])
a<-table.element(a,'')
a<-table.row.end(a)
a<-table.row.start(a)
mymid <- hyperlink('midmean.htm', 'Midmean', 'click to view the definition of the Midmean')
mylabel <- paste(mymid,hyperlink('method_5.htm','Empirical Distribution Function - Interpolation',''),sep=' - ')
a<-table.element(a,mylabel,header=TRUE)
a<-table.element(a,midm[5])
a<-table.element(a,'')
a<-table.row.end(a)
a<-table.row.start(a)
mymid <- hyperlink('midmean.htm', 'Midmean', 'click to view the definition of the Midmean')
mylabel <- paste(mymid,hyperlink('method_6.htm','Closest Observation',''),sep=' - ')
a<-table.element(a,mylabel,header=TRUE)
a<-table.element(a,midm[6])
a<-table.element(a,'')
a<-table.row.end(a)
a<-table.row.start(a)
mymid <- hyperlink('midmean.htm', 'Midmean', 'click to view the definition of the Midmean')
mylabel <- paste(mymid,hyperlink('method_7.htm','True Basic - Statistics Graphics Toolkit',''),sep=' - ')
a<-table.element(a,mylabel,header=TRUE)
a<-table.element(a,midm[7])
a<-table.element(a,'')
a<-table.row.end(a)
a<-table.row.start(a)
mymid <- hyperlink('midmean.htm', 'Midmean', 'click to view the definition of the Midmean')
mylabel <- paste(mymid,hyperlink('method_8.htm','MS Excel (old versions)',''),sep=' - ')
a<-table.element(a,mylabel,header=TRUE)
a<-table.element(a,midm[8])
a<-table.element(a,'')
a<-table.row.end(a)
a<-table.row.start(a)
a<-table.element(a,'Number of observations',header=TRUE)
a<-table.element(a,length(x))
a<-table.element(a,'')
a<-table.row.end(a)
a<-table.end(a)
table.save(a,file='mytable.tab')