Free Statistics

of Irreproducible Research!

Author's title

Author*Unverified author*
R Software Modulerwasp_correlation.wasp
Title produced by softwarePearson Correlation
Date of computationMon, 20 Oct 2008 13:08:40 -0600
Cite this page as followsStatistical Computations at FreeStatistics.org, Office for Research Development and Education, URL https://freestatistics.org/blog/index.php?v=date/2008/Oct/20/t1224529806jv4d2iyfosp8u91.htm/, Retrieved Sun, 19 May 2024 14:59:54 +0000
Statistical Computations at FreeStatistics.org, Office for Research Development and Education, URL https://freestatistics.org/blog/index.php?pk=17922, Retrieved Sun, 19 May 2024 14:59:54 +0000
QR Codes:

Original text written by user:
IsPrivate?No (this computation is public)
User-defined keywords
Estimated Impact126
Family? (F = Feedback message, R = changed R code, M = changed R Module, P = changed Parameters, D = changed Data)
F     [Back to Back Histogram] [Omzet industrie v...] [2008-10-20 18:44:01] [e340b5273efb4d885d02142e6a0fc74b]
F RMPD    [Pearson Correlation] [Correlation omzet...] [2008-10-20 19:08:40] [0ee5a336ab8a2fb221821eda2df0f830] [Current]
F    D      [Pearson Correlation] [correlation inves...] [2008-10-20 19:15:50] [e340b5273efb4d885d02142e6a0fc74b]
F    D        [Pearson Correlation] [correlation omzet...] [2008-10-20 19:20:53] [e340b5273efb4d885d02142e6a0fc74b]
F    D          [Pearson Correlation] [correlaation omze...] [2008-10-20 19:26:14] [e340b5273efb4d885d02142e6a0fc74b]
Feedback Forum
2008-10-27 01:27:53 [Kristof Augustyns] [reply
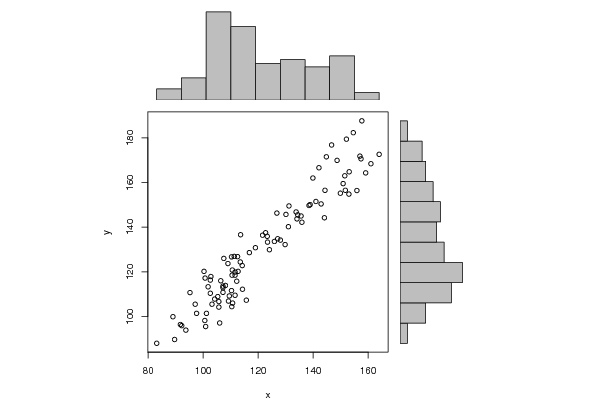
Hier zie je dus duidelijk met het blote oog dat de correlatie zeer hoog ligt: 0.950586261815652 om precies te zijn.
De student heeft volledig gelijk met zijn uitleg, maar het is niet compleet.
Er is inderdaad wel een samenhang tussen industrie en niet - industrie.
Het is toch logisch dat als de industrie stijgt, de niet - industrie mee stijgt.
95% beïnvloed het mekaar.
2008-10-27 01:30:20 [Kristof Augustyns] [reply
Het gaat hier wel om de OMZET industrie - niet-industrie
2008-10-28 00:13:07 [a7e076854c32462fd499d2de3f6d4e86] [reply
Correcte uitleg maar niet volledig.
Samenhang is aanwezig
95% bïnvloedbaar

Post a new message
Dataseries X:
83,1
89,6
105,7
110,7
110,4
109
106
100,9
114,3
101,2
109,2
111,6
91,7
93,7
105,7
109,5
105,3
102,8
100,6
97,6
110,3
107,2
107,2
108,1
97,1
92,2
112,2
111,6
115,7
111,3
104,2
103,2
112,7
106,4
102,6
110,6
95,2
89
112,5
116,8
107,2
113,6
101,8
102,6
122,7
110,3
110,5
121,6
100,3
100,7
123,4
127,1
124,1
131,2
111,6
114,2
130,1
125,9
119
133,8
107,5
113,5
134,4
126,8
135,6
139,9
129,8
131
153,1
134,1
144,1
155,9
123,3
128,1
144,3
153
149,9
150,9
141
138,9
157,4
142,9
151,7
161
138,5
135,9
151,5
164
159,1
157
142,1
144,8
152,1
154,6
148,7
157,7
146,7
Dataseries Y:
88
89,7
106,7
106
104,4
123,7
97,1
95,5
112,2
101,4
106,9
109,5
96,4
93,9
104,2
109,2
108,9
117,9
98,2
101,4
111,6
113,6
110,8
113,9
105,5
95,9
115,8
119,9
107,3
126,9
107,8
105,5
120,2
116
110,4
120,8
110,7
99,9
126,8
128,6
112,9
136,6
113,3
116,3
137,5
126,7
118,5
136,4
120,2
117,2
133,3
134,8
129,9
149,5
118,5
122,8
145,7
133,6
130,8
146,8
126
124,4
145,5
146,3
145
162
132,2
140,2
164,8
143,7
144,2
156,4
135,9
134,2
156,5
154,8
155,2
159,5
151,5
150,1
170,6
150,4
156,5
168,4
149,7
142,2
163
172,6
164,3
171,8
166,6
171,5
179,4
182,3
169,9
187,6
176,8


Summary of computational transaction
Raw Inputview raw input (R code)
Raw Outputview raw output of R engine
Computing time2 seconds
R Server'Sir Ronald Aylmer Fisher' @ 193.190.124.24

\begin{tabular}{lllllllll}
\hline
Summary of computational transaction \tabularnewline
Raw Input & view raw input (R code)  \tabularnewline
Raw Output & view raw output of R engine  \tabularnewline
Computing time & 2 seconds \tabularnewline
R Server & 'Sir Ronald Aylmer Fisher' @ 193.190.124.24 \tabularnewline
\hline
\end{tabular}
%Source: https://freestatistics.org/blog/index.php?pk=17922&T=0

[TABLE]
[ROW][C]Summary of computational transaction[/C][/ROW]
[ROW][C]Raw Input[/C][C]view raw input (R code) [/C][/ROW]
[ROW][C]Raw Output[/C][C]view raw output of R engine [/C][/ROW]
[ROW][C]Computing time[/C][C]2 seconds[/C][/ROW]
[ROW][C]R Server[/C][C]'Sir Ronald Aylmer Fisher' @ 193.190.124.24[/C][/ROW]
[/TABLE]
Source: https://freestatistics.org/blog/index.php?pk=17922&T=0

Globally Unique Identifier (entire table): ba.freestatistics.org/blog/index.php?pk=17922&T=0

As an alternative you can also use a QR Code:  

The GUIDs for individual cells are displayed in the table below:

Summary of computational transaction
Raw Inputview raw input (R code)
Raw Outputview raw output of R engine
Computing time2 seconds
R Server'Sir Ronald Aylmer Fisher' @ 193.190.124.24


Pearson Product Moment Correlation - Ungrouped Data
StatisticVariable XVariable Y
Mean121.826804123711130.849484536082
Biased Variance415.591652672973605.697345095122
Biased Standard Deviation20.386065159146624.6109192249116
Covariance481.895951460481
Correlation0.950586261815652
Determination0.903614241152656
T-Test29.8433038432306
p-value (2 sided)0
p-value (1 sided)0
Degrees of Freedom95
Number of Observations97

\begin{tabular}{lllllllll}
\hline
Pearson Product Moment Correlation - Ungrouped Data \tabularnewline
Statistic & Variable X & Variable Y \tabularnewline
Mean & 121.826804123711 & 130.849484536082 \tabularnewline
Biased Variance & 415.591652672973 & 605.697345095122 \tabularnewline
Biased Standard Deviation & 20.3860651591466 & 24.6109192249116 \tabularnewline
Covariance & 481.895951460481 \tabularnewline
Correlation & 0.950586261815652 \tabularnewline
Determination & 0.903614241152656 \tabularnewline
T-Test & 29.8433038432306 \tabularnewline
p-value (2 sided) & 0 \tabularnewline
p-value (1 sided) & 0 \tabularnewline
Degrees of Freedom & 95 \tabularnewline
Number of Observations & 97 \tabularnewline
\hline
\end{tabular}
%Source: https://freestatistics.org/blog/index.php?pk=17922&T=1

[TABLE]
[ROW][C]Pearson Product Moment Correlation - Ungrouped Data[/C][/ROW]
[ROW][C]Statistic[/C][C]Variable X[/C][C]Variable Y[/C][/ROW]
[ROW][C]Mean[/C][C]121.826804123711[/C][C]130.849484536082[/C][/ROW]
[ROW][C]Biased Variance[/C][C]415.591652672973[/C][C]605.697345095122[/C][/ROW]
[ROW][C]Biased Standard Deviation[/C][C]20.3860651591466[/C][C]24.6109192249116[/C][/ROW]
[ROW][C]Covariance[/C][C]481.895951460481[/C][/ROW]
[ROW][C]Correlation[/C][C]0.950586261815652[/C][/ROW]
[ROW][C]Determination[/C][C]0.903614241152656[/C][/ROW]
[ROW][C]T-Test[/C][C]29.8433038432306[/C][/ROW]
[ROW][C]p-value (2 sided)[/C][C]0[/C][/ROW]
[ROW][C]p-value (1 sided)[/C][C]0[/C][/ROW]
[ROW][C]Degrees of Freedom[/C][C]95[/C][/ROW]
[ROW][C]Number of Observations[/C][C]97[/C][/ROW]
[/TABLE]
Source: https://freestatistics.org/blog/index.php?pk=17922&T=1

Globally Unique Identifier (entire table): ba.freestatistics.org/blog/index.php?pk=17922&T=1

As an alternative you can also use a QR Code:  

The GUIDs for individual cells are displayed in the table below:

Pearson Product Moment Correlation - Ungrouped Data
StatisticVariable XVariable Y
Mean121.826804123711130.849484536082
Biased Variance415.591652672973605.697345095122
Biased Standard Deviation20.386065159146624.6109192249116
Covariance481.895951460481
Correlation0.950586261815652
Determination0.903614241152656
T-Test29.8433038432306
p-value (2 sided)0
p-value (1 sided)0
Degrees of Freedom95
Number of Observations97


Parameters (Session):
Parameters (R input):
R code (references can be found in the software module):
bitmap(file='test1.png')
histx <- hist(x, plot=FALSE)
histy <- hist(y, plot=FALSE)
maxcounts <- max(c(histx$counts, histx$counts))
xrange <- c(min(x),max(x))
yrange <- c(min(y),max(y))
nf <- layout(matrix(c(2,0,1,3),2,2,byrow=TRUE), c(3,1), c(1,3), TRUE)
par(mar=c(4,4,1,1))
plot(x, y, xlim=xrange, ylim=yrange, xlab=xlab, ylab=ylab)
par(mar=c(0,4,1,1))
barplot(histx$counts, axes=FALSE, ylim=c(0, maxcounts), space=0)
par(mar=c(4,0,1,1))
barplot(histy$counts, axes=FALSE, xlim=c(0, maxcounts), space=0, horiz=TRUE)
dev.off()
lx = length(x)
makebiased = (lx-1)/lx
varx = var(x)*makebiased
vary = var(y)*makebiased
corxy <- cor.test(x,y,method='pearson')
cxy <- as.matrix(corxy$estimate)[1,1]
load(file='createtable')
a<-table.start()
a<-table.row.start(a)
a<-table.element(a,'Pearson Product Moment Correlation - Ungrouped Data',3,TRUE)
a<-table.row.end(a)
a<-table.row.start(a)
a<-table.element(a,'Statistic',1,TRUE)
a<-table.element(a,'Variable X',1,TRUE)
a<-table.element(a,'Variable Y',1,TRUE)
a<-table.row.end(a)
a<-table.row.start(a)
a<-table.element(a,hyperlink('arithmetic_mean.htm','Mean',''),header=TRUE)
a<-table.element(a,mean(x))
a<-table.element(a,mean(y))
a<-table.row.end(a)
a<-table.row.start(a)
a<-table.element(a,hyperlink('biased.htm','Biased Variance',''),header=TRUE)
a<-table.element(a,varx)
a<-table.element(a,vary)
a<-table.row.end(a)
a<-table.row.start(a)
a<-table.element(a,hyperlink('biased1.htm','Biased Standard Deviation',''),header=TRUE)
a<-table.element(a,sqrt(varx))
a<-table.element(a,sqrt(vary))
a<-table.row.end(a)
a<-table.row.start(a)
a<-table.element(a,hyperlink('covariance.htm','Covariance',''),header=TRUE)
a<-table.element(a,cov(x,y),2)
a<-table.row.end(a)
a<-table.row.start(a)
a<-table.element(a,hyperlink('pearson_correlation.htm','Correlation',''),header=TRUE)
a<-table.element(a,cxy,2)
a<-table.row.end(a)
a<-table.row.start(a)
a<-table.element(a,hyperlink('coeff_of_determination.htm','Determination',''),header=TRUE)
a<-table.element(a,cxy*cxy,2)
a<-table.row.end(a)
a<-table.row.start(a)
a<-table.element(a,hyperlink('ttest_statistic.htm','T-Test',''),header=TRUE)
a<-table.element(a,as.matrix(corxy$statistic)[1,1],2)
a<-table.row.end(a)
a<-table.row.start(a)
a<-table.element(a,'p-value (2 sided)',header=TRUE)
a<-table.element(a,(p2 <- as.matrix(corxy$p.value)[1,1]),2)
a<-table.row.end(a)
a<-table.row.start(a)
a<-table.element(a,'p-value (1 sided)',header=TRUE)
a<-table.element(a,p2/2,2)
a<-table.row.end(a)
a<-table.row.start(a)
a<-table.element(a,'Degrees of Freedom',header=TRUE)
a<-table.element(a,lx-2,2)
a<-table.row.end(a)
a<-table.row.start(a)
a<-table.element(a,'Number of Observations',header=TRUE)
a<-table.element(a,lx,2)
a<-table.row.end(a)
a<-table.end(a)
table.save(a,file='mytable.tab')