Free Statistics
of Irreproducible Research!
Description of Statistical Computation | |||||||||||||||||||||
|---|---|---|---|---|---|---|---|---|---|---|---|---|---|---|---|---|---|---|---|---|---|
| Author's title | |||||||||||||||||||||
| Author | *Unverified author* | ||||||||||||||||||||
| R Software Module | rwasp_backtobackhist.wasp | ||||||||||||||||||||
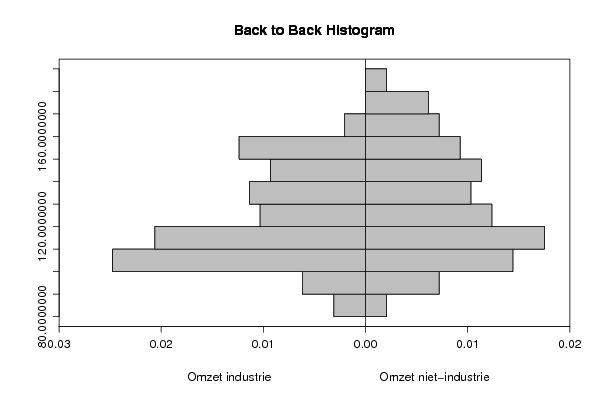
| Title produced by software | Back to Back Histogram | ||||||||||||||||||||
| Date of computation | Mon, 20 Oct 2008 12:44:01 -0600 | ||||||||||||||||||||
| Cite this page as follows | Statistical Computations at FreeStatistics.org, Office for Research Development and Education, URL https://freestatistics.org/blog/index.php?v=date/2008/Oct/20/t1224528357bwqn6ga76m02l35.htm/, Retrieved Sun, 19 May 2024 16:28:27 +0000 | ||||||||||||||||||||
| Statistical Computations at FreeStatistics.org, Office for Research Development and Education, URL https://freestatistics.org/blog/index.php?pk=17884, Retrieved Sun, 19 May 2024 16:28:27 +0000 | |||||||||||||||||||||
| QR Codes: | |||||||||||||||||||||
|
| |||||||||||||||||||||
| Original text written by user: | |||||||||||||||||||||
| IsPrivate? | No (this computation is public) | ||||||||||||||||||||
| User-defined keywords | |||||||||||||||||||||
| Estimated Impact | 136 | ||||||||||||||||||||
Tree of Dependent Computations | |||||||||||||||||||||
| Family? (F = Feedback message, R = changed R code, M = changed R Module, P = changed Parameters, D = changed Data) | |||||||||||||||||||||
| F [Back to Back Histogram] [Omzet industrie v...] [2008-10-20 18:44:01] [0ee5a336ab8a2fb221821eda2df0f830] [Current] F PD [Back to Back Histogram] [investeringen ind...] [2008-10-20 18:52:04] [e340b5273efb4d885d02142e6a0fc74b] F RMPD [Central Tendency] [central tendency ...] [2008-10-20 18:57:04] [e340b5273efb4d885d02142e6a0fc74b] F RMPD [Pearson Correlation] [Correlation omzet...] [2008-10-20 19:08:40] [e340b5273efb4d885d02142e6a0fc74b] F D [Pearson Correlation] [correlation inves...] [2008-10-20 19:15:50] [e340b5273efb4d885d02142e6a0fc74b] F D [Pearson Correlation] [correlation omzet...] [2008-10-20 19:20:53] [e340b5273efb4d885d02142e6a0fc74b] F D [Pearson Correlation] [correlaation omze...] [2008-10-20 19:26:14] [e340b5273efb4d885d02142e6a0fc74b] | |||||||||||||||||||||
| Feedback Forum | |||||||||||||||||||||
Post a new message | |||||||||||||||||||||
Dataset | |||||||||||||||||||||
| Dataseries X: | |||||||||||||||||||||
83.1 89.6 105.7 110.7 110.4 109 106 100.9 114.3 101.2 109.2 111.6 91.7 93.7 105.7 109.5 105.3 102.8 100.6 97.6 110.3 107.2 107.2 108.1 97.1 92.2 112.2 111.6 115.7 111.3 104.2 103.2 112.7 106.4 102.6 110.6 95.2 89 112.5 116.8 107.2 113.6 101.8 102.6 122.7 110.3 110.5 121.6 100.3 100.7 123.4 127.1 124.1 131.2 111.6 114.2 130.1 125.9 119 133.8 107.5 113.5 134.4 126.8 135.6 139.9 129.8 131 153.1 134.1 144.1 155.9 123.3 128.1 144.3 153 149.9 150.9 141 138.9 157.4 142.9 151.7 161 138.5 135.9 151.5 164 159.1 157 142.1 144.8 152.1 154.6 148.7 157.7 146.7 | |||||||||||||||||||||
| Dataseries Y: | |||||||||||||||||||||
88 89,7 106,7 106 104,4 123,7 97,1 95,5 112,2 101,4 106,9 109,5 96,4 93,9 104,2 109,2 108,9 117,9 98,2 101,4 111,6 113,6 110,8 113,9 105,5 95,9 115,8 119,9 107,3 126,9 107,8 105,5 120,2 116 110,4 120,8 110,7 99,9 126,8 128,6 112,9 136,6 113,3 116,3 137,5 126,7 118,5 136,4 120,2 117,2 133,3 134,8 129,9 149,5 118,5 122,8 145,7 133,6 130,8 146,8 126 124,4 145,5 146,3 145 162 132,2 140,2 164,8 143,7 144,2 156,4 135,9 134,2 156,5 154,8 155,2 159,5 151,5 150,1 170,6 150,4 156,5 168,4 149,7 142,2 163 172,6 164,3 171,8 166,6 171,5 179,4 182,3 169,9 187,6 176,8 | |||||||||||||||||||||
Tables (Output of Computation) | |||||||||||||||||||||
| |||||||||||||||||||||
Figures (Output of Computation) | |||||||||||||||||||||
Input Parameters & R Code | |||||||||||||||||||||
| Parameters (Session): | |||||||||||||||||||||
| par1 = grey ; par2 = grey ; par3 = TRUE ; par4 = Omzet industrie ; par5 = Omzet niet-industrie ; | |||||||||||||||||||||
| Parameters (R input): | |||||||||||||||||||||
| par1 = grey ; par2 = grey ; par3 = TRUE ; par4 = Omzet industrie ; par5 = Omzet niet-industrie ; | |||||||||||||||||||||
| R code (references can be found in the software module): | |||||||||||||||||||||
if (par3 == 'TRUE') par3 <- TRUE | |||||||||||||||||||||