Free Statistics

of Irreproducible Research!

Author's title

Author*The author of this computation has been verified*
R Software Modulerwasp_correlation.wasp
Title produced by softwarePearson Correlation
Date of computationMon, 20 Oct 2008 12:35:39 -0600
Cite this page as followsStatistical Computations at FreeStatistics.org, Office for Research Development and Education, URL https://freestatistics.org/blog/index.php?v=date/2008/Oct/20/t1224527775z08tg3csz8i0j4q.htm/, Retrieved Sun, 19 May 2024 13:19:44 +0000
Statistical Computations at FreeStatistics.org, Office for Research Development and Education, URL https://freestatistics.org/blog/index.php?pk=17871, Retrieved Sun, 19 May 2024 13:19:44 +0000
QR Codes:

Original text written by user:
IsPrivate?No (this computation is public)
User-defined keywords
Estimated Impact143
Family? (F = Feedback message, R = changed R code, M = changed R Module, P = changed Parameters, D = changed Data)
F     [Harrell-Davis Quantiles] [Q7 95% confidence...] [2007-10-20 15:02:46] [b731da8b544846036771bbf9bf2f34ce]
-    D  [Harrell-Davis Quantiles] [Harrell - Davis Q...] [2008-10-18 17:45:28] [b943bd7078334192ff8343563ee31113]
F RMPD      [Pearson Correlation] [Pearson Tijdreeks...] [2008-10-20 18:35:39] [620b6ad5c4696049e39cb73ce029682c] [Current]
Feedback Forum
2008-10-23 19:43:02 [Ciska Tanghe] [reply
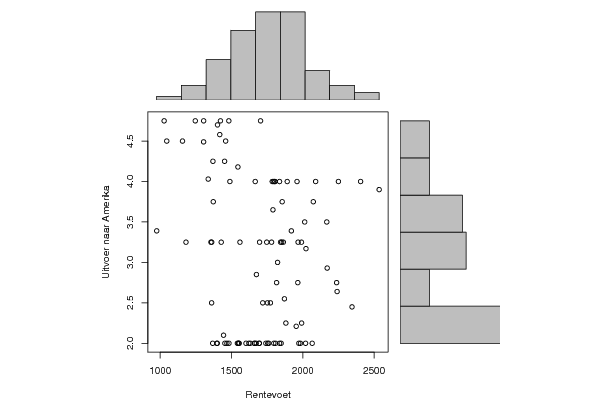
Aangezien we een negatieve correlatie hebben, heel dicht bij nul, kunnen we concluderen dat er weinig of geen samenhang is tussen deze twee reeksen.
2008-10-27 11:59:57 [Michael Van Spaandonck] [reply
Een corelatie van -0,19 duidt inderdaad op een klein omgekeerd verband tussen de uitvoer naar Amerika en de rentevoet, zoals bovenstaande student ook al zei.

In een groetere economische context vind ik in principe ook maar weinig redenen waarom rentevoet en uitvoer naar Amerika een verband zouden kennen.

Post a new message
Dataseries X:
1045.9
1401.9
1027.6
1703.8
1481.3
1422.7
1304.7
1246.1
1417.8
1459.1
1156.4
1304.5
1336.9
1372.3
975.5
1180.8
1361.3
1428.1
1355.9
1781.2
1697
1852
1844.1
1967.2
1747.1
1863.9
1559.3
1675
2237.5
1965.2
1871.5
1752.2
1360.7
1444.3
1621.6
1368
1553.9
1695.3
1397.1
1848.4
1809.2
1551.1
1546.6
1467.9
1662.4
1972.3
1673.5
1762
2019.8
1754.3
1400.4
1453.6
1740.9
1694.6
1541.2
1482.3
1632.1
1837.3
1797
2066.2
1983.8
1601.7
1660.3
1954
1991.9
1881.4
2345.5
1773.1
1719.2
2240.9
1816.4
2171.3
1823.3
2022.5
1991
1920
2168.4
2013.5
1790.8
1855.7
2074
2535.8
1837.2
1805.1
1785.7
2250
1959.7
1890.8
2405.7
2090.3
1666.5
1803.5
1793.8
1488.8
1545
1369.9
1451.6
Dataseries Y:
4,5
4,7
4,75
4,75
4,75
4,75
4,75
4,75
4,58
4,5
4,5
4,49
4,03
3,75
3,39
3,25
3,25
3,25
3,25
3,25
3,25
3,25
3,25
3,25
3,25
3,25
3,25
2,85
2,75
2,75
2,55
2,5
2,5
2,1
2
2
2
2
2
2
2
2
2
2
2
2
2
2
2
2
2
2
2
2
2
2
2
2
2
2
2
2
2
2,21
2,25
2,25
2,45
2,5
2,5
2,64
2,75
2,93
3
3,17
3,25
3,39
3,5
3,5
3,65
3,75
3,75
3,9
4
4
4
4
4
4
4
4
4
4
4
4
4,18
4,25
4,25


Summary of computational transaction
Raw Inputview raw input (R code)
Raw Outputview raw output of R engine
Computing time3 seconds
R Server'Sir Ronald Aylmer Fisher' @ 193.190.124.24

\begin{tabular}{lllllllll}
\hline
Summary of computational transaction \tabularnewline
Raw Input & view raw input (R code)  \tabularnewline
Raw Output & view raw output of R engine  \tabularnewline
Computing time & 3 seconds \tabularnewline
R Server & 'Sir Ronald Aylmer Fisher' @ 193.190.124.24 \tabularnewline
\hline
\end{tabular}
%Source: https://freestatistics.org/blog/index.php?pk=17871&T=0

[TABLE]
[ROW][C]Summary of computational transaction[/C][/ROW]
[ROW][C]Raw Input[/C][C]view raw input (R code) [/C][/ROW]
[ROW][C]Raw Output[/C][C]view raw output of R engine [/C][/ROW]
[ROW][C]Computing time[/C][C]3 seconds[/C][/ROW]
[ROW][C]R Server[/C][C]'Sir Ronald Aylmer Fisher' @ 193.190.124.24[/C][/ROW]
[/TABLE]
Source: https://freestatistics.org/blog/index.php?pk=17871&T=0

Globally Unique Identifier (entire table): ba.freestatistics.org/blog/index.php?pk=17871&T=0

As an alternative you can also use a QR Code:  

The GUIDs for individual cells are displayed in the table below:

Summary of computational transaction
Raw Inputview raw input (R code)
Raw Outputview raw output of R engine
Computing time3 seconds
R Server'Sir Ronald Aylmer Fisher' @ 193.190.124.24


Pearson Product Moment Correlation - Ungrouped Data
StatisticVariable XVariable Y
Mean1705.442268041243.09237113402062
Biased Variance93674.70058454670.901611903496652
Biased Standard Deviation306.0632297165840.949532465741247
Covariance-57.1930387671821
Correlation-0.194769834639652
Determination0.0379352884855573
T-Test-1.93544732311718
p-value (2 sided)0.0559090364653776
p-value (1 sided)0.0279545182326888
Degrees of Freedom95
Number of Observations97

\begin{tabular}{lllllllll}
\hline
Pearson Product Moment Correlation - Ungrouped Data \tabularnewline
Statistic & Variable X & Variable Y \tabularnewline
Mean & 1705.44226804124 & 3.09237113402062 \tabularnewline
Biased Variance & 93674.7005845467 & 0.901611903496652 \tabularnewline
Biased Standard Deviation & 306.063229716584 & 0.949532465741247 \tabularnewline
Covariance & -57.1930387671821 \tabularnewline
Correlation & -0.194769834639652 \tabularnewline
Determination & 0.0379352884855573 \tabularnewline
T-Test & -1.93544732311718 \tabularnewline
p-value (2 sided) & 0.0559090364653776 \tabularnewline
p-value (1 sided) & 0.0279545182326888 \tabularnewline
Degrees of Freedom & 95 \tabularnewline
Number of Observations & 97 \tabularnewline
\hline
\end{tabular}
%Source: https://freestatistics.org/blog/index.php?pk=17871&T=1

[TABLE]
[ROW][C]Pearson Product Moment Correlation - Ungrouped Data[/C][/ROW]
[ROW][C]Statistic[/C][C]Variable X[/C][C]Variable Y[/C][/ROW]
[ROW][C]Mean[/C][C]1705.44226804124[/C][C]3.09237113402062[/C][/ROW]
[ROW][C]Biased Variance[/C][C]93674.7005845467[/C][C]0.901611903496652[/C][/ROW]
[ROW][C]Biased Standard Deviation[/C][C]306.063229716584[/C][C]0.949532465741247[/C][/ROW]
[ROW][C]Covariance[/C][C]-57.1930387671821[/C][/ROW]
[ROW][C]Correlation[/C][C]-0.194769834639652[/C][/ROW]
[ROW][C]Determination[/C][C]0.0379352884855573[/C][/ROW]
[ROW][C]T-Test[/C][C]-1.93544732311718[/C][/ROW]
[ROW][C]p-value (2 sided)[/C][C]0.0559090364653776[/C][/ROW]
[ROW][C]p-value (1 sided)[/C][C]0.0279545182326888[/C][/ROW]
[ROW][C]Degrees of Freedom[/C][C]95[/C][/ROW]
[ROW][C]Number of Observations[/C][C]97[/C][/ROW]
[/TABLE]
Source: https://freestatistics.org/blog/index.php?pk=17871&T=1

Globally Unique Identifier (entire table): ba.freestatistics.org/blog/index.php?pk=17871&T=1

As an alternative you can also use a QR Code:  

The GUIDs for individual cells are displayed in the table below:

Pearson Product Moment Correlation - Ungrouped Data
StatisticVariable XVariable Y
Mean1705.442268041243.09237113402062
Biased Variance93674.70058454670.901611903496652
Biased Standard Deviation306.0632297165840.949532465741247
Covariance-57.1930387671821
Correlation-0.194769834639652
Determination0.0379352884855573
T-Test-1.93544732311718
p-value (2 sided)0.0559090364653776
p-value (1 sided)0.0279545182326888
Degrees of Freedom95
Number of Observations97


Parameters (Session):
par1 = grey ; par2 = grey ; par3 = TRUE ; par4 = Invoer vanuit Amerika ; par5 = Rentevoet ;
Parameters (R input):
R code (references can be found in the software module):
bitmap(file='test1.png')
histx <- hist(x, plot=FALSE)
histy <- hist(y, plot=FALSE)
maxcounts <- max(c(histx$counts, histx$counts))
xrange <- c(min(x),max(x))
yrange <- c(min(y),max(y))
nf <- layout(matrix(c(2,0,1,3),2,2,byrow=TRUE), c(3,1), c(1,3), TRUE)
par(mar=c(4,4,1,1))
plot(x, y, xlim=xrange, ylim=yrange, xlab=xlab, ylab=ylab)
par(mar=c(0,4,1,1))
barplot(histx$counts, axes=FALSE, ylim=c(0, maxcounts), space=0)
par(mar=c(4,0,1,1))
barplot(histy$counts, axes=FALSE, xlim=c(0, maxcounts), space=0, horiz=TRUE)
dev.off()
lx = length(x)
makebiased = (lx-1)/lx
varx = var(x)*makebiased
vary = var(y)*makebiased
corxy <- cor.test(x,y,method='pearson')
cxy <- as.matrix(corxy$estimate)[1,1]
load(file='createtable')
a<-table.start()
a<-table.row.start(a)
a<-table.element(a,'Pearson Product Moment Correlation - Ungrouped Data',3,TRUE)
a<-table.row.end(a)
a<-table.row.start(a)
a<-table.element(a,'Statistic',1,TRUE)
a<-table.element(a,'Variable X',1,TRUE)
a<-table.element(a,'Variable Y',1,TRUE)
a<-table.row.end(a)
a<-table.row.start(a)
a<-table.element(a,hyperlink('arithmetic_mean.htm','Mean',''),header=TRUE)
a<-table.element(a,mean(x))
a<-table.element(a,mean(y))
a<-table.row.end(a)
a<-table.row.start(a)
a<-table.element(a,hyperlink('biased.htm','Biased Variance',''),header=TRUE)
a<-table.element(a,varx)
a<-table.element(a,vary)
a<-table.row.end(a)
a<-table.row.start(a)
a<-table.element(a,hyperlink('biased1.htm','Biased Standard Deviation',''),header=TRUE)
a<-table.element(a,sqrt(varx))
a<-table.element(a,sqrt(vary))
a<-table.row.end(a)
a<-table.row.start(a)
a<-table.element(a,hyperlink('covariance.htm','Covariance',''),header=TRUE)
a<-table.element(a,cov(x,y),2)
a<-table.row.end(a)
a<-table.row.start(a)
a<-table.element(a,hyperlink('pearson_correlation.htm','Correlation',''),header=TRUE)
a<-table.element(a,cxy,2)
a<-table.row.end(a)
a<-table.row.start(a)
a<-table.element(a,hyperlink('coeff_of_determination.htm','Determination',''),header=TRUE)
a<-table.element(a,cxy*cxy,2)
a<-table.row.end(a)
a<-table.row.start(a)
a<-table.element(a,hyperlink('ttest_statistic.htm','T-Test',''),header=TRUE)
a<-table.element(a,as.matrix(corxy$statistic)[1,1],2)
a<-table.row.end(a)
a<-table.row.start(a)
a<-table.element(a,'p-value (2 sided)',header=TRUE)
a<-table.element(a,(p2 <- as.matrix(corxy$p.value)[1,1]),2)
a<-table.row.end(a)
a<-table.row.start(a)
a<-table.element(a,'p-value (1 sided)',header=TRUE)
a<-table.element(a,p2/2,2)
a<-table.row.end(a)
a<-table.row.start(a)
a<-table.element(a,'Degrees of Freedom',header=TRUE)
a<-table.element(a,lx-2,2)
a<-table.row.end(a)
a<-table.row.start(a)
a<-table.element(a,'Number of Observations',header=TRUE)
a<-table.element(a,lx,2)
a<-table.row.end(a)
a<-table.end(a)
table.save(a,file='mytable.tab')