Free Statistics
of Irreproducible Research!
Description of Statistical Computation | |||||||||||||||||||||
|---|---|---|---|---|---|---|---|---|---|---|---|---|---|---|---|---|---|---|---|---|---|
| Author's title | |||||||||||||||||||||
| Author | *The author of this computation has been verified* | ||||||||||||||||||||
| R Software Module | rwasp_backtobackhist.wasp | ||||||||||||||||||||
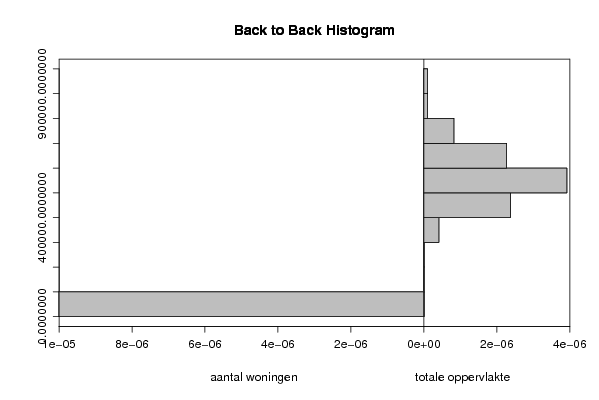
| Title produced by software | Back to Back Histogram | ||||||||||||||||||||
| Date of computation | Mon, 20 Oct 2008 12:28:56 -0600 | ||||||||||||||||||||
| Cite this page as follows | Statistical Computations at FreeStatistics.org, Office for Research Development and Education, URL https://freestatistics.org/blog/index.php?v=date/2008/Oct/20/t1224527376ofq0u8t9g7cuxbh.htm/, Retrieved Sun, 19 May 2024 15:25:36 +0000 | ||||||||||||||||||||
| Statistical Computations at FreeStatistics.org, Office for Research Development and Education, URL https://freestatistics.org/blog/index.php?pk=17860, Retrieved Sun, 19 May 2024 15:25:36 +0000 | |||||||||||||||||||||
| QR Codes: | |||||||||||||||||||||
|
| |||||||||||||||||||||
| Original text written by user: | |||||||||||||||||||||
| IsPrivate? | No (this computation is public) | ||||||||||||||||||||
| User-defined keywords | |||||||||||||||||||||
| Estimated Impact | 119 | ||||||||||||||||||||
Tree of Dependent Computations | |||||||||||||||||||||
| Family? (F = Feedback message, R = changed R code, M = changed R Module, P = changed Parameters, D = changed Data) | |||||||||||||||||||||
| F [Pearson Correlation] [Relatie aantal ge...] [2008-10-20 16:55:30] [c5a66f1c8528a963efc2b82a8519f117] - RMPD [Back to Back Histogram] [aantal woningen -...] [2008-10-20 18:28:56] [b4fc5040f26b33db57f84cfb8d1d2b82] [Current] | |||||||||||||||||||||
| Feedback Forum | |||||||||||||||||||||
Post a new message | |||||||||||||||||||||
Dataset | |||||||||||||||||||||
| Dataseries X: | |||||||||||||||||||||
2319 2383 2513 2553 2341 2540 2371 2122 2301 2512 3145 2741 2548 1987 2281 2016 2434 2637 1831 1851 1839 2609 2417 2394 2372 2717 2998 2538 3007 2475 2175 2465 2279 2323 2746 2601 2486 2718 2646 2551 2712 2606 2365 3533 3509 2912 3599 2719 2869 4085 2686 2545 3071 3388 2652 3190 2884 3295 3818 3226 3953 3810 2877 3515 3708 3450 3360 4110 4384 3729 4263 3505 3674 3911 2951 3317 3417 3498 2768 2899 3171 3004 3481 3016 2595 3509 2833 3125 2556 3628 2876 2575 2903 3438 2926 3068 3015 | |||||||||||||||||||||
| Dataseries Y: | |||||||||||||||||||||
501852 500983 492092 471353 503961 519240 427730 426894 458031 512057 604919 589011 526981 450468 472746 395490 476078 545870 415570 380319 383600 505737 495066 472665 480579 536266 561722 475908 523232 507509 399927 466682 421751 442511 546678 499944 495574 524944 568106 484506 512235 523179 462411 685872 635902 573599 668826 520868 555680 727941 516959 489975 559687 630947 473994 583802 553061 604700 708101 617053 819858 736520 567696 666627 701749 647394 610231 777555 901319 707164 782859 652556 676064 707665 561515 645794 623482 673401 544890 605125 607570 578585 647408 574998 507468 695738 562270 585810 516493 691302 549560 496171 561565 671145 578514 623296 587012 | |||||||||||||||||||||
Tables (Output of Computation) | |||||||||||||||||||||
| |||||||||||||||||||||
Figures (Output of Computation) | |||||||||||||||||||||
Input Parameters & R Code | |||||||||||||||||||||
| Parameters (Session): | |||||||||||||||||||||
| par1 = grey ; par2 = grey ; par3 = TRUE ; par4 = aantal gebouwen ; par5 = totale oppervlakte ; | |||||||||||||||||||||
| Parameters (R input): | |||||||||||||||||||||
| par1 = grey ; par2 = grey ; par3 = TRUE ; par4 = aantal woningen ; par5 = totale oppervlakte ; | |||||||||||||||||||||
| R code (references can be found in the software module): | |||||||||||||||||||||
if (par3 == 'TRUE') par3 <- TRUE | |||||||||||||||||||||