Free Statistics
of Irreproducible Research!
Description of Statistical Computation | |||||||||||||||||||||
|---|---|---|---|---|---|---|---|---|---|---|---|---|---|---|---|---|---|---|---|---|---|
| Author's title | |||||||||||||||||||||
| Author | *The author of this computation has been verified* | ||||||||||||||||||||
| R Software Module | rwasp_backtobackhist.wasp | ||||||||||||||||||||
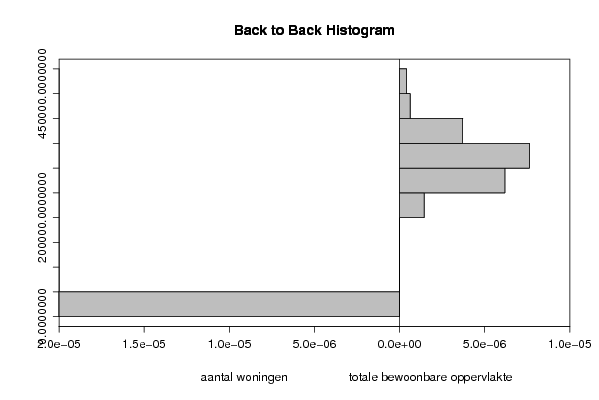
| Title produced by software | Back to Back Histogram | ||||||||||||||||||||
| Date of computation | Mon, 20 Oct 2008 12:26:58 -0600 | ||||||||||||||||||||
| Cite this page as follows | Statistical Computations at FreeStatistics.org, Office for Research Development and Education, URL https://freestatistics.org/blog/index.php?v=date/2008/Oct/20/t1224527259hsbic17qi6vb95t.htm/, Retrieved Sun, 19 May 2024 16:33:01 +0000 | ||||||||||||||||||||
| Statistical Computations at FreeStatistics.org, Office for Research Development and Education, URL https://freestatistics.org/blog/index.php?pk=17856, Retrieved Sun, 19 May 2024 16:33:01 +0000 | |||||||||||||||||||||
| QR Codes: | |||||||||||||||||||||
|
| |||||||||||||||||||||
| Original text written by user: | |||||||||||||||||||||
| IsPrivate? | No (this computation is public) | ||||||||||||||||||||
| User-defined keywords | |||||||||||||||||||||
| Estimated Impact | 111 | ||||||||||||||||||||
Tree of Dependent Computations | |||||||||||||||||||||
| Family? (F = Feedback message, R = changed R code, M = changed R Module, P = changed Parameters, D = changed Data) | |||||||||||||||||||||
| F [Pearson Correlation] [Relatie aantal ge...] [2008-10-20 16:55:30] [c5a66f1c8528a963efc2b82a8519f117] - RMPD [Back to Back Histogram] [aantal woningen -...] [2008-10-20 18:26:58] [b4fc5040f26b33db57f84cfb8d1d2b82] [Current] | |||||||||||||||||||||
| Feedback Forum | |||||||||||||||||||||
Post a new message | |||||||||||||||||||||
Dataset | |||||||||||||||||||||
| Dataseries X: | |||||||||||||||||||||
2319 2383 2513 2553 2341 2540 2371 2122 2301 2512 3145 2741 2548 1987 2281 2016 2434 2637 1831 1851 1839 2609 2417 2394 2372 2717 2998 2538 3007 2475 2175 2465 2279 2323 2746 2601 2486 2718 2646 2551 2712 2606 2365 3533 3509 2912 3599 2719 2869 4085 2686 2545 3071 3388 2652 3190 2884 3295 3818 3226 3953 3810 2877 3515 3708 3450 3360 4110 4384 3729 4263 3505 3674 3911 2951 3317 3417 3498 2768 2899 3171 3004 3481 3016 2595 3509 2833 3125 2556 3628 2876 2575 2903 3438 2926 3068 3015 | |||||||||||||||||||||
| Dataseries Y: | |||||||||||||||||||||
310301 308956 306337 300552 309661 315575 265784 260722 278629 311448 363932 362673 320253 273036 291047 239167 285034 331389 228493 205450 207203 287602 265812 262920 268006 292400 315810 269544 301433 280678 221915 263552 244831 245227 302493 280810 277643 292792 318530 276807 284524 290486 259355 383556 350488 318029 377740 293546 317460 401629 282854 275316 304680 349947 266543 329195 314626 338463 399338 339542 454688 396766 309465 365707 383677 352609 340011 425915 498938 391142 418962 342378 369674 391250 310589 335910 344448 361944 290274 327902 329809 324543 350735 320091 278048 381754 301833 318723 266695 381119 295943 266463 311750 359897 312936 339327 312658 | |||||||||||||||||||||
Tables (Output of Computation) | |||||||||||||||||||||
| |||||||||||||||||||||
Figures (Output of Computation) | |||||||||||||||||||||
Input Parameters & R Code | |||||||||||||||||||||
| Parameters (Session): | |||||||||||||||||||||
| par1 = grey ; par2 = grey ; par3 = TRUE ; par4 = aantal gebouwen ; par5 = totale oppervlakte ; | |||||||||||||||||||||
| Parameters (R input): | |||||||||||||||||||||
| par1 = grey ; par2 = grey ; par3 = TRUE ; par4 = aantal woningen ; par5 = totale bewoonbare oppervlakte ; | |||||||||||||||||||||
| R code (references can be found in the software module): | |||||||||||||||||||||
if (par3 == 'TRUE') par3 <- TRUE | |||||||||||||||||||||