Free Statistics
of Irreproducible Research!
Description of Statistical Computation | |||||||||||||||||||||
|---|---|---|---|---|---|---|---|---|---|---|---|---|---|---|---|---|---|---|---|---|---|
| Author's title | |||||||||||||||||||||
| Author | *The author of this computation has been verified* | ||||||||||||||||||||
| R Software Module | rwasp_backtobackhist.wasp | ||||||||||||||||||||
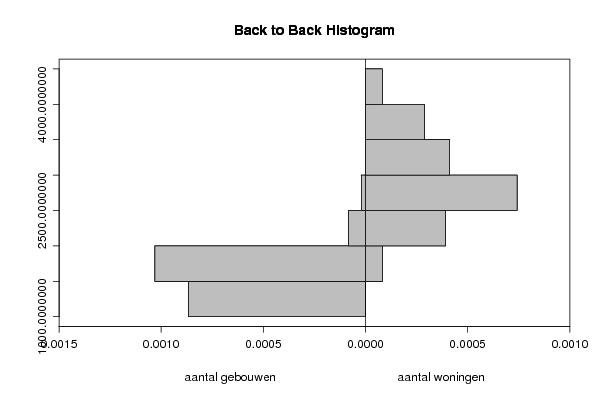
| Title produced by software | Back to Back Histogram | ||||||||||||||||||||
| Date of computation | Mon, 20 Oct 2008 12:21:54 -0600 | ||||||||||||||||||||
| Cite this page as follows | Statistical Computations at FreeStatistics.org, Office for Research Development and Education, URL https://freestatistics.org/blog/index.php?v=date/2008/Oct/20/t12245269527utb9dhre81te6v.htm/, Retrieved Sun, 19 May 2024 14:56:33 +0000 | ||||||||||||||||||||
| Statistical Computations at FreeStatistics.org, Office for Research Development and Education, URL https://freestatistics.org/blog/index.php?pk=17846, Retrieved Sun, 19 May 2024 14:56:33 +0000 | |||||||||||||||||||||
| QR Codes: | |||||||||||||||||||||
|
| |||||||||||||||||||||
| Original text written by user: | |||||||||||||||||||||
| IsPrivate? | No (this computation is public) | ||||||||||||||||||||
| User-defined keywords | |||||||||||||||||||||
| Estimated Impact | 126 | ||||||||||||||||||||
Tree of Dependent Computations | |||||||||||||||||||||
| Family? (F = Feedback message, R = changed R code, M = changed R Module, P = changed Parameters, D = changed Data) | |||||||||||||||||||||
| F [Pearson Correlation] [Relatie aantal ge...] [2008-10-20 16:55:30] [c5a66f1c8528a963efc2b82a8519f117] - RMP [Back to Back Histogram] [aantal gebouwen -...] [2008-10-20 18:21:54] [b4fc5040f26b33db57f84cfb8d1d2b82] [Current] | |||||||||||||||||||||
| Feedback Forum | |||||||||||||||||||||
Post a new message | |||||||||||||||||||||
Dataset | |||||||||||||||||||||
| Dataseries X: | |||||||||||||||||||||
1671 1385 1632 1313 1300 1431 1398 1198 1292 1434 1660 1837 1455 1315 1642 1069 1209 1586 1122 1063 1125 1414 1347 1403 1299 1547 1515 1247 1639 1296 1063 1282 1365 1268 1532 1455 1393 1515 1510 1225 1577 1417 1224 1693 1633 1639 1914 1586 1552 2081 1500 1437 1470 1849 1387 1592 1589 1798 1935 1887 2027 2080 1556 1682 1785 1869 1781 2082 2570 1862 1936 1504 1765 1607 1577 1493 1615 1700 1335 1523 1621 1539 1637 1523 1418 1819 1594 1359 1261 1722 1407 1380 1642 1681 1542 1704 1431 | |||||||||||||||||||||
| Dataseries Y: | |||||||||||||||||||||
2319 2383 2513 2553 2341 2540 2371 2122 2301 2512 3145 2741 2548 1987 2281 2016 2434 2637 1831 1851 1839 2609 2417 2394 2372 2717 2998 2538 3007 2475 2175 2465 2279 2323 2746 2601 2486 2718 2646 2551 2712 2606 2365 3533 3509 2912 3599 2719 2869 4085 2686 2545 3071 3388 2652 3190 2884 3295 3818 3226 3953 3810 2877 3515 3708 3450 3360 4110 4384 3729 4263 3505 3674 3911 2951 3317 3417 3498 2768 2899 3171 3004 3481 3016 2595 3509 2833 3125 2556 3628 2876 2575 2903 3438 2926 3068 3015 | |||||||||||||||||||||
Tables (Output of Computation) | |||||||||||||||||||||
| |||||||||||||||||||||
Figures (Output of Computation) | |||||||||||||||||||||
Input Parameters & R Code | |||||||||||||||||||||
| Parameters (Session): | |||||||||||||||||||||
| par1 = grey ; par2 = grey ; par3 = TRUE ; par4 = aantal gebouwen ; par5 = totale oppervlakte ; | |||||||||||||||||||||
| Parameters (R input): | |||||||||||||||||||||
| par1 = grey ; par2 = grey ; par3 = TRUE ; par4 = aantal gebouwen ; par5 = aantal woningen ; | |||||||||||||||||||||
| R code (references can be found in the software module): | |||||||||||||||||||||
if (par3 == 'TRUE') par3 <- TRUE | |||||||||||||||||||||