Free Statistics
of Irreproducible Research!
Description of Statistical Computation | |||||||||||||||||||||
|---|---|---|---|---|---|---|---|---|---|---|---|---|---|---|---|---|---|---|---|---|---|
| Author's title | |||||||||||||||||||||
| Author | *The author of this computation has been verified* | ||||||||||||||||||||
| R Software Module | rwasp_backtobackhist.wasp | ||||||||||||||||||||
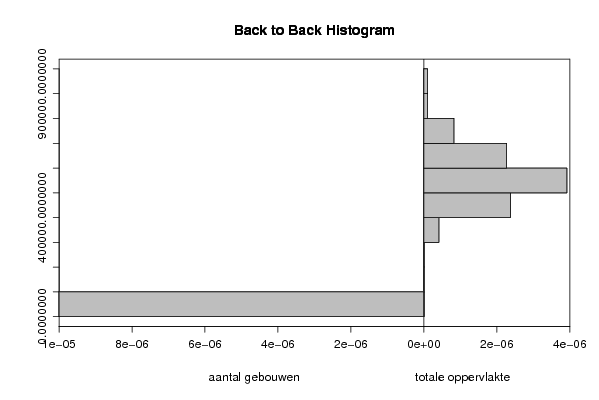
| Title produced by software | Back to Back Histogram | ||||||||||||||||||||
| Date of computation | Mon, 20 Oct 2008 12:18:31 -0600 | ||||||||||||||||||||
| Cite this page as follows | Statistical Computations at FreeStatistics.org, Office for Research Development and Education, URL https://freestatistics.org/blog/index.php?v=date/2008/Oct/20/t1224526825hkrzsprqsrb1iw9.htm/, Retrieved Sun, 19 May 2024 16:09:07 +0000 | ||||||||||||||||||||
| Statistical Computations at FreeStatistics.org, Office for Research Development and Education, URL https://freestatistics.org/blog/index.php?pk=17843, Retrieved Sun, 19 May 2024 16:09:07 +0000 | |||||||||||||||||||||
| QR Codes: | |||||||||||||||||||||
|
| |||||||||||||||||||||
| Original text written by user: | |||||||||||||||||||||
| IsPrivate? | No (this computation is public) | ||||||||||||||||||||
| User-defined keywords | |||||||||||||||||||||
| Estimated Impact | 138 | ||||||||||||||||||||
Tree of Dependent Computations | |||||||||||||||||||||
| Family? (F = Feedback message, R = changed R code, M = changed R Module, P = changed Parameters, D = changed Data) | |||||||||||||||||||||
| F [Pearson Correlation] [Relatie aantal ge...] [2008-10-20 16:55:30] [c5a66f1c8528a963efc2b82a8519f117] - RMPD [Back to Back Histogram] [totale oppervlakt...] [2008-10-20 18:18:31] [b4fc5040f26b33db57f84cfb8d1d2b82] [Current] | |||||||||||||||||||||
| Feedback Forum | |||||||||||||||||||||
Post a new message | |||||||||||||||||||||
Dataset | |||||||||||||||||||||
| Dataseries X: | |||||||||||||||||||||
1671 1385 1632 1313 1300 1431 1398 1198 1292 1434 1660 1837 1455 1315 1642 1069 1209 1586 1122 1063 1125 1414 1347 1403 1299 1547 1515 1247 1639 1296 1063 1282 1365 1268 1532 1455 1393 1515 1510 1225 1577 1417 1224 1693 1633 1639 1914 1586 1552 2081 1500 1437 1470 1849 1387 1592 1589 1798 1935 1887 2027 2080 1556 1682 1785 1869 1781 2082 2570 1862 1936 1504 1765 1607 1577 1493 1615 1700 1335 1523 1621 1539 1637 1523 1418 1819 1594 1359 1261 1722 1407 1380 1642 1681 1542 1704 1431 | |||||||||||||||||||||
| Dataseries Y: | |||||||||||||||||||||
501852 500983 492092 471353 503961 519240 427730 426894 458031 512057 604919 589011 526981 450468 472746 395490 476078 545870 415570 380319 383600 505737 495066 472665 480579 536266 561722 475908 523232 507509 399927 466682 421751 442511 546678 499944 495574 524944 568106 484506 512235 523179 462411 685872 635902 573599 668826 520868 555680 727941 516959 489975 559687 630947 473994 583802 553061 604700 708101 617053 819858 736520 567696 666627 701749 647394 610231 777555 901319 707164 782859 652556 676064 707665 561515 645794 623482 673401 544890 605125 607570 578585 647408 574998 507468 695738 562270 585810 516493 691302 549560 496171 561565 671145 578514 623296 587012 | |||||||||||||||||||||
Tables (Output of Computation) | |||||||||||||||||||||
| |||||||||||||||||||||
Figures (Output of Computation) | |||||||||||||||||||||
Input Parameters & R Code | |||||||||||||||||||||
| Parameters (Session): | |||||||||||||||||||||
| par1 = grey ; par2 = grey ; par3 = TRUE ; par4 = aantal gebouwen ; par5 = totale oppervlakte ; | |||||||||||||||||||||
| Parameters (R input): | |||||||||||||||||||||
| par1 = grey ; par2 = grey ; par3 = TRUE ; par4 = aantal gebouwen ; par5 = totale oppervlakte ; | |||||||||||||||||||||
| R code (references can be found in the software module): | |||||||||||||||||||||
if (par3 == 'TRUE') par3 <- TRUE | |||||||||||||||||||||