Free Statistics
of Irreproducible Research!
Description of Statistical Computation | |||||||||||||||||||||||||||||||||||||||||
|---|---|---|---|---|---|---|---|---|---|---|---|---|---|---|---|---|---|---|---|---|---|---|---|---|---|---|---|---|---|---|---|---|---|---|---|---|---|---|---|---|---|
| Author's title | |||||||||||||||||||||||||||||||||||||||||
| Author | *The author of this computation has been verified* | ||||||||||||||||||||||||||||||||||||||||
| R Software Module | rwasp_univariatedataseries.wasp | ||||||||||||||||||||||||||||||||||||||||
| Title produced by software | Univariate Data Series | ||||||||||||||||||||||||||||||||||||||||
| Date of computation | Mon, 20 Oct 2008 10:37:44 -0600 | ||||||||||||||||||||||||||||||||||||||||
| Cite this page as follows | Statistical Computations at FreeStatistics.org, Office for Research Development and Education, URL https://freestatistics.org/blog/index.php?v=date/2008/Oct/20/t1224520768rcqw8uiejs0o4jz.htm/, Retrieved Sun, 19 May 2024 12:55:31 +0000 | ||||||||||||||||||||||||||||||||||||||||
| Statistical Computations at FreeStatistics.org, Office for Research Development and Education, URL https://freestatistics.org/blog/index.php?pk=17622, Retrieved Sun, 19 May 2024 12:55:31 +0000 | |||||||||||||||||||||||||||||||||||||||||
| QR Codes: | |||||||||||||||||||||||||||||||||||||||||
|
| |||||||||||||||||||||||||||||||||||||||||
| Original text written by user: | |||||||||||||||||||||||||||||||||||||||||
| IsPrivate? | No (this computation is public) | ||||||||||||||||||||||||||||||||||||||||
| User-defined keywords | |||||||||||||||||||||||||||||||||||||||||
| Estimated Impact | 144 | ||||||||||||||||||||||||||||||||||||||||
Tree of Dependent Computations | |||||||||||||||||||||||||||||||||||||||||
| Family? (F = Feedback message, R = changed R code, M = changed R Module, P = changed Parameters, D = changed Data) | |||||||||||||||||||||||||||||||||||||||||
| F [Univariate Data Series] [tijdreeks 1] [2008-10-13 18:18:09] [063e4b67ad7d3a8a83eccec794cd5aa7] - PD [Univariate Data Series] [tijdreeks 3: tota...] [2008-10-19 14:59:51] [063e4b67ad7d3a8a83eccec794cd5aa7] - PD [Univariate Data Series] [Tijdreeks 3 Totaa...] [2008-10-20 16:37:44] [6797a1f4a60918966297e9d9220cabc2] [Current] - PD [Univariate Data Series] [tijdreeks 3: Tota...] [2008-10-22 18:12:46] [631938996a408f8d8cf3d9850ca0cd03] | |||||||||||||||||||||||||||||||||||||||||
| Feedback Forum | |||||||||||||||||||||||||||||||||||||||||
Post a new message | |||||||||||||||||||||||||||||||||||||||||
Dataset | |||||||||||||||||||||||||||||||||||||||||
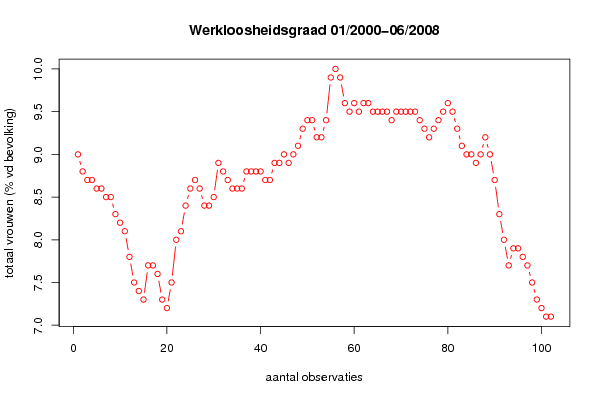
| Dataseries X: | |||||||||||||||||||||||||||||||||||||||||
9 8.8 8.7 8.7 8.6 8.6 8.5 8.5 8.3 8.2 8.1 7.8 7.5 7.4 7.3 7.7 7.7 7.6 7.3 7.2 7.5 8 8.1 8.4 8.6 8.7 8.6 8.4 8.4 8.5 8.9 8.8 8.7 8.6 8.6 8.6 8.8 8.8 8.8 8.8 8.7 8.7 8.9 8.9 9 8.9 9 9.1 9.3 9.4 9.4 9.2 9.2 9.4 9.9 10 9.9 9.6 9.5 9.6 9.5 9.6 9.6 9.5 9.5 9.5 9.5 9.4 9.5 9.5 9.5 9.5 9.5 9.4 9.3 9.2 9.3 9.4 9.5 9.6 9.5 9.3 9.1 9 9 8.9 9 9.2 9 8.7 8.3 8 7.7 7.9 7.9 7.8 7.7 7.5 7.3 7.2 7.1 7.1 | |||||||||||||||||||||||||||||||||||||||||
Tables (Output of Computation) | |||||||||||||||||||||||||||||||||||||||||
| |||||||||||||||||||||||||||||||||||||||||
Figures (Output of Computation) | |||||||||||||||||||||||||||||||||||||||||
Input Parameters & R Code | |||||||||||||||||||||||||||||||||||||||||
| Parameters (Session): | |||||||||||||||||||||||||||||||||||||||||
| par1 = totaal werkzoekenden vrouwen ; par2 = http://www.nbb.be/belgostat/PublicatieSelectieLinker?LinkID=410000092|910000082&Lang=N ; par3 = Aangepaste geharmoniseerde werkloosheidsgraad (Eurostat definitie) ; | |||||||||||||||||||||||||||||||||||||||||
| Parameters (R input): | |||||||||||||||||||||||||||||||||||||||||
| par1 = totaal werkzoekenden vrouwen ; par2 = http://www.nbb.be/belgostat/PublicatieSelectieLinker?LinkID=410000092|910000082&Lang=N ; par3 = Aangepaste geharmoniseerde werkloosheidsgraad (Eurostat definitie) ; | |||||||||||||||||||||||||||||||||||||||||
| R code (references can be found in the software module): | |||||||||||||||||||||||||||||||||||||||||
bitmap(file='test1.png') | |||||||||||||||||||||||||||||||||||||||||