Free Statistics
of Irreproducible Research!
Description of Statistical Computation | |||||||||||||||||||||||||||||||||||||||||||||||||||||||||||||||||||||||||||||||||||||||||||||||||||
|---|---|---|---|---|---|---|---|---|---|---|---|---|---|---|---|---|---|---|---|---|---|---|---|---|---|---|---|---|---|---|---|---|---|---|---|---|---|---|---|---|---|---|---|---|---|---|---|---|---|---|---|---|---|---|---|---|---|---|---|---|---|---|---|---|---|---|---|---|---|---|---|---|---|---|---|---|---|---|---|---|---|---|---|---|---|---|---|---|---|---|---|---|---|---|---|---|---|---|---|
| Author's title | |||||||||||||||||||||||||||||||||||||||||||||||||||||||||||||||||||||||||||||||||||||||||||||||||||
| Author | *The author of this computation has been verified* | ||||||||||||||||||||||||||||||||||||||||||||||||||||||||||||||||||||||||||||||||||||||||||||||||||
| R Software Module | rwasp_correlation.wasp | ||||||||||||||||||||||||||||||||||||||||||||||||||||||||||||||||||||||||||||||||||||||||||||||||||
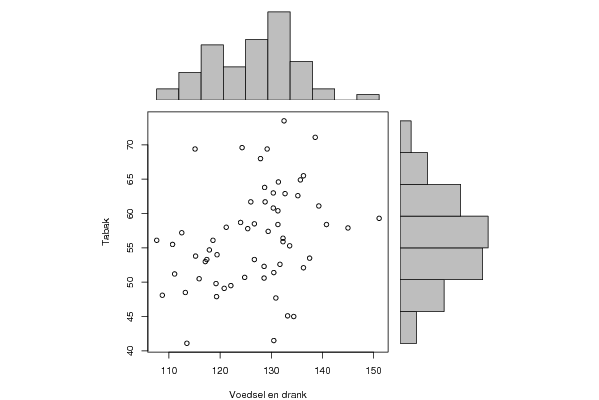
| Title produced by software | Pearson Correlation | ||||||||||||||||||||||||||||||||||||||||||||||||||||||||||||||||||||||||||||||||||||||||||||||||||
| Date of computation | Mon, 20 Oct 2008 10:30:30 -0600 | ||||||||||||||||||||||||||||||||||||||||||||||||||||||||||||||||||||||||||||||||||||||||||||||||||
| Cite this page as follows | Statistical Computations at FreeStatistics.org, Office for Research Development and Education, URL https://freestatistics.org/blog/index.php?v=date/2008/Oct/20/t1224520296mcfy6cdoswg0mj5.htm/, Retrieved Sun, 19 May 2024 14:33:24 +0000 | ||||||||||||||||||||||||||||||||||||||||||||||||||||||||||||||||||||||||||||||||||||||||||||||||||
| Statistical Computations at FreeStatistics.org, Office for Research Development and Education, URL https://freestatistics.org/blog/index.php?pk=17610, Retrieved Sun, 19 May 2024 14:33:24 +0000 | |||||||||||||||||||||||||||||||||||||||||||||||||||||||||||||||||||||||||||||||||||||||||||||||||||
| QR Codes: | |||||||||||||||||||||||||||||||||||||||||||||||||||||||||||||||||||||||||||||||||||||||||||||||||||
|
| |||||||||||||||||||||||||||||||||||||||||||||||||||||||||||||||||||||||||||||||||||||||||||||||||||
| Original text written by user: | |||||||||||||||||||||||||||||||||||||||||||||||||||||||||||||||||||||||||||||||||||||||||||||||||||
| IsPrivate? | No (this computation is public) | ||||||||||||||||||||||||||||||||||||||||||||||||||||||||||||||||||||||||||||||||||||||||||||||||||
| User-defined keywords | |||||||||||||||||||||||||||||||||||||||||||||||||||||||||||||||||||||||||||||||||||||||||||||||||||
| Estimated Impact | 147 | ||||||||||||||||||||||||||||||||||||||||||||||||||||||||||||||||||||||||||||||||||||||||||||||||||
Tree of Dependent Computations | |||||||||||||||||||||||||||||||||||||||||||||||||||||||||||||||||||||||||||||||||||||||||||||||||||
| Family? (F = Feedback message, R = changed R code, M = changed R Module, P = changed Parameters, D = changed Data) | |||||||||||||||||||||||||||||||||||||||||||||||||||||||||||||||||||||||||||||||||||||||||||||||||||
| F [Univariate Data Series] [invoer vanuit vs] [2008-10-13 19:11:39] [57ce5bd741080980f0f51979adb31ad8] - PD [Univariate Data Series] [Productie voedsel...] [2008-10-19 13:35:18] [ed2ba3b6182103c15c0ab511ae4e6284] - PD [Univariate Data Series] [Productie Voedsel...] [2008-10-19 14:08:24] [ed2ba3b6182103c15c0ab511ae4e6284] F RMPD [Pearson Correlation] [Correl voedsel en...] [2008-10-20 16:30:30] [a8228479d4547a92e2d3f176a5299609] [Current] F D [Pearson Correlation] [correl consumpt v...] [2008-10-20 16:37:08] [ed2ba3b6182103c15c0ab511ae4e6284] F D [Pearson Correlation] [correl tot pro en...] [2008-10-20 16:45:16] [ed2ba3b6182103c15c0ab511ae4e6284] F D [Pearson Correlation] [correl tot en tab] [2008-10-20 16:49:04] [ed2ba3b6182103c15c0ab511ae4e6284] F D [Pearson Correlation] [correl consu en t...] [2008-10-20 16:54:01] [ed2ba3b6182103c15c0ab511ae4e6284] F D [Pearson Correlation] [corre consu en tota] [2008-10-20 16:57:40] [ed2ba3b6182103c15c0ab511ae4e6284] - D [Pearson Correlation] [correlatie gezond...] [2008-10-20 17:32:21] [4ad596f10399a71ad29b7d76e6ab90ac] - D [Pearson Correlation] [correlatie tussen...] [2008-10-20 17:38:26] [4ad596f10399a71ad29b7d76e6ab90ac] - D [Pearson Correlation] [correlatie tussen...] [2008-10-20 17:49:20] [4ad596f10399a71ad29b7d76e6ab90ac] - D [Pearson Correlation] [correlatie tussen...] [2008-10-20 17:57:05] [4ad596f10399a71ad29b7d76e6ab90ac] - D [Pearson Correlation] [correlatie index ...] [2008-10-20 18:04:28] [4ad596f10399a71ad29b7d76e6ab90ac] - D [Pearson Correlation] [correlatie tussen...] [2008-10-20 18:09:23] [4ad596f10399a71ad29b7d76e6ab90ac] | |||||||||||||||||||||||||||||||||||||||||||||||||||||||||||||||||||||||||||||||||||||||||||||||||||
| Feedback Forum | |||||||||||||||||||||||||||||||||||||||||||||||||||||||||||||||||||||||||||||||||||||||||||||||||||
Post a new message | |||||||||||||||||||||||||||||||||||||||||||||||||||||||||||||||||||||||||||||||||||||||||||||||||||
Dataset | |||||||||||||||||||||||||||||||||||||||||||||||||||||||||||||||||||||||||||||||||||||||||||||||||||
| Dataseries X: | |||||||||||||||||||||||||||||||||||||||||||||||||||||||||||||||||||||||||||||||||||||||||||||||||||
113,5 121,2 130,4 115,2 117,9 110,7 107,6 124,3 115,1 112,5 127,9 117,4 119,3 130,4 126 125,4 130,5 115,9 108,7 124 119,4 118,6 131,3 111,1 124,8 132,3 126,7 131,7 130,9 122,1 113,2 133,6 119,2 129,4 131,4 117,1 130,5 132,3 140,8 137,5 128,6 126,7 120,8 139,3 128,6 131,3 136,3 128,8 133,2 136,3 151,1 145 134,4 135,7 128,7 129,2 138,6 132,7 132,5 135,2 | |||||||||||||||||||||||||||||||||||||||||||||||||||||||||||||||||||||||||||||||||||||||||||||||||||
| Dataseries Y: | |||||||||||||||||||||||||||||||||||||||||||||||||||||||||||||||||||||||||||||||||||||||||||||||||||
41,1 58 63 53,8 54,7 55,5 56,1 69,6 69,4 57,2 68 53,3 47,9 60,8 61,7 57,8 51,4 50,5 48,1 58,7 54 56,1 60,4 51,2 50,7 56,4 53,3 52,6 47,7 49,5 48,5 55,3 49,8 57,4 64,6 53 41,5 55,9 58,4 53,5 50,6 58,5 49,1 61,1 52,3 58,4 65,5 61,7 45,1 52,1 59,3 57,9 45 64,9 63,8 69,4 71,1 62,9 73,5 62,6 | |||||||||||||||||||||||||||||||||||||||||||||||||||||||||||||||||||||||||||||||||||||||||||||||||||
Tables (Output of Computation) | |||||||||||||||||||||||||||||||||||||||||||||||||||||||||||||||||||||||||||||||||||||||||||||||||||
| |||||||||||||||||||||||||||||||||||||||||||||||||||||||||||||||||||||||||||||||||||||||||||||||||||
Figures (Output of Computation) | |||||||||||||||||||||||||||||||||||||||||||||||||||||||||||||||||||||||||||||||||||||||||||||||||||
Input Parameters & R Code | |||||||||||||||||||||||||||||||||||||||||||||||||||||||||||||||||||||||||||||||||||||||||||||||||||
| Parameters (Session): | |||||||||||||||||||||||||||||||||||||||||||||||||||||||||||||||||||||||||||||||||||||||||||||||||||
| Parameters (R input): | |||||||||||||||||||||||||||||||||||||||||||||||||||||||||||||||||||||||||||||||||||||||||||||||||||
| R code (references can be found in the software module): | |||||||||||||||||||||||||||||||||||||||||||||||||||||||||||||||||||||||||||||||||||||||||||||||||||
bitmap(file='test1.png') | |||||||||||||||||||||||||||||||||||||||||||||||||||||||||||||||||||||||||||||||||||||||||||||||||||