Free Statistics
of Irreproducible Research!
Description of Statistical Computation | |||||||||||||||||||||||||||||||||||||||||
|---|---|---|---|---|---|---|---|---|---|---|---|---|---|---|---|---|---|---|---|---|---|---|---|---|---|---|---|---|---|---|---|---|---|---|---|---|---|---|---|---|---|
| Author's title | Industri�le productie - koninkrijk - indexen per werkdag - volgens de beste... | ||||||||||||||||||||||||||||||||||||||||
| Author | *The author of this computation has been verified* | ||||||||||||||||||||||||||||||||||||||||
| R Software Module | rwasp_univariatedataseries.wasp | ||||||||||||||||||||||||||||||||||||||||
| Title produced by software | Univariate Data Series | ||||||||||||||||||||||||||||||||||||||||
| Date of computation | Mon, 20 Oct 2008 09:43:40 -0600 | ||||||||||||||||||||||||||||||||||||||||
| Cite this page as follows | Statistical Computations at FreeStatistics.org, Office for Research Development and Education, URL https://freestatistics.org/blog/index.php?v=date/2008/Oct/20/t122451748810oqry4iv7b45af.htm/, Retrieved Sun, 19 May 2024 13:32:49 +0000 | ||||||||||||||||||||||||||||||||||||||||
| Statistical Computations at FreeStatistics.org, Office for Research Development and Education, URL https://freestatistics.org/blog/index.php?pk=17516, Retrieved Sun, 19 May 2024 13:32:49 +0000 | |||||||||||||||||||||||||||||||||||||||||
| QR Codes: | |||||||||||||||||||||||||||||||||||||||||
|
| |||||||||||||||||||||||||||||||||||||||||
| Original text written by user: | |||||||||||||||||||||||||||||||||||||||||
| IsPrivate? | No (this computation is public) | ||||||||||||||||||||||||||||||||||||||||
| User-defined keywords | |||||||||||||||||||||||||||||||||||||||||
| Estimated Impact | 120 | ||||||||||||||||||||||||||||||||||||||||
Tree of Dependent Computations | |||||||||||||||||||||||||||||||||||||||||
| Family? (F = Feedback message, R = changed R code, M = changed R Module, P = changed Parameters, D = changed Data) | |||||||||||||||||||||||||||||||||||||||||
| F [Univariate Data Series] [Werkje Niet duurz...] [2008-10-13 21:22:29] [491a70d26f8c977398d8a0c1c87d3dd4] - P [Univariate Data Series] [Industri�le produ...] [2008-10-20 14:35:29] [491a70d26f8c977398d8a0c1c87d3dd4] - P [Univariate Data Series] [Industri�le produ...] [2008-10-20 15:43:40] [2ba2a74112fb2c960057a572bf2825d3] [Current] | |||||||||||||||||||||||||||||||||||||||||
| Feedback Forum | |||||||||||||||||||||||||||||||||||||||||
Post a new message | |||||||||||||||||||||||||||||||||||||||||
Dataset | |||||||||||||||||||||||||||||||||||||||||
| Dataseries X: | |||||||||||||||||||||||||||||||||||||||||
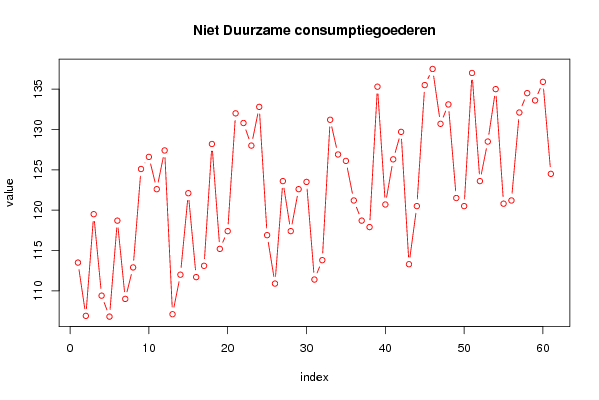
113.5 106.9 119.5 109.4 106.8 118.7 109 112.9 125.1 126.6 122.6 127.4 107.1 112 122.1 111.7 113.1 128.2 115.2 117.4 132 130.8 128 132.8 116.9 110.9 123.6 117.4 122.6 123.5 111.4 113.8 131.2 126.9 126.1 121.2 118.7 117.9 135.3 120.7 126.3 129.7 113.3 120.5 135.5 137.5 130.7 133.1 121.5 120.5 137 123.6 128.5 135 120.8 121.2 132.1 134.5 133.6 135.9 124.5 | |||||||||||||||||||||||||||||||||||||||||
Tables (Output of Computation) | |||||||||||||||||||||||||||||||||||||||||
| |||||||||||||||||||||||||||||||||||||||||
Figures (Output of Computation) | |||||||||||||||||||||||||||||||||||||||||
Input Parameters & R Code | |||||||||||||||||||||||||||||||||||||||||
| Parameters (Session): | |||||||||||||||||||||||||||||||||||||||||
| par1 = Industri�le productie - koninkrijk - indexen per werkdag - volgens de bestemming:Niet Duurzame consumptiegoederen ; par2 = http://www.nbb.be/belgostat/PublicatieSelectieLinker?LinkID=534000029|910000082&Lang=N ; par3 = Niet Duurzame consumptiegoederen ; | |||||||||||||||||||||||||||||||||||||||||
| Parameters (R input): | |||||||||||||||||||||||||||||||||||||||||
| par1 = Industri�le productie - koninkrijk - indexen per werkdag - volgens de bestemming:Niet Duurzame consumptiegoederen ; par2 = http://www.nbb.be/belgostat/PublicatieSelectieLinker?LinkID=534000029|910000082&Lang=N ; par3 = Niet Duurzame consumptiegoederen ; | |||||||||||||||||||||||||||||||||||||||||
| R code (references can be found in the software module): | |||||||||||||||||||||||||||||||||||||||||
bitmap(file='test1.png') | |||||||||||||||||||||||||||||||||||||||||