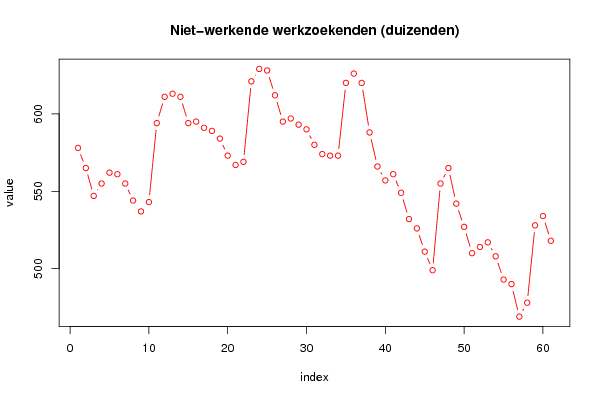
Free Statistics

of Irreproducible Research!

Author's title

België, Werkloosheid (niet werkende werkzoekenden), brutogegevens in duizen...

Author*Unverified author*
R Software Modulerwasp_univariatedataseries.wasp
Title produced by softwareUnivariate Data Series
Date of computationMon, 20 Oct 2008 09:31:36 -0600
Cite this page as followsStatistical Computations at FreeStatistics.org, Office for Research Development and Education, URL https://freestatistics.org/blog/index.php?v=date/2008/Oct/20/t1224516736tdwiozjpzj5cc59.htm/, Retrieved Sun, 19 May 2024 15:26:18 +0000
Statistical Computations at FreeStatistics.org, Office for Research Development and Education, URL https://freestatistics.org/blog/index.php?pk=17486, Retrieved Sun, 19 May 2024 15:26:18 +0000
QR Codes:

Original text written by user:
IsPrivate?No (this computation is public)
User-defined keywordsWerkloosheid
Estimated Impact114
Family? (F = Feedback message, R = changed R code, M = changed R Module, P = changed Parameters, D = changed Data)
-       [Univariate Data Series] [België, Werkloosh...] [2008-10-20 15:31:36] [4f54996111e63ee83b19b6a8540c6bad] [Current]
Feedback Forum

Post a new message
Dataseries X:
578
565
547
555
562
561
555
544
537
543
594
611
613
611
594
595
591
589
584
573
567
569
621
629
628
612
595
597
593
590
580
574
573
573
620
626
620
588
566
557
561
549
532
526
511
499
555
565
542
527
510
514
517
508
493
490
469
478
528
534
518


Summary of computational transaction
Raw Inputview raw input (R code)
Raw Outputview raw output of R engine
Computing time2 seconds
R Server'Sir Ronald Aylmer Fisher' @ 193.190.124.24

\begin{tabular}{lllllllll}
\hline
Summary of computational transaction \tabularnewline
Raw Input & view raw input (R code)  \tabularnewline
Raw Output & view raw output of R engine  \tabularnewline
Computing time & 2 seconds \tabularnewline
R Server & 'Sir Ronald Aylmer Fisher' @ 193.190.124.24 \tabularnewline
\hline
\end{tabular}
%Source: https://freestatistics.org/blog/index.php?pk=17486&T=0

[TABLE]
[ROW][C]Summary of computational transaction[/C][/ROW]
[ROW][C]Raw Input[/C][C]view raw input (R code) [/C][/ROW]
[ROW][C]Raw Output[/C][C]view raw output of R engine [/C][/ROW]
[ROW][C]Computing time[/C][C]2 seconds[/C][/ROW]
[ROW][C]R Server[/C][C]'Sir Ronald Aylmer Fisher' @ 193.190.124.24[/C][/ROW]
[/TABLE]
Source: https://freestatistics.org/blog/index.php?pk=17486&T=0

Globally Unique Identifier (entire table): ba.freestatistics.org/blog/index.php?pk=17486&T=0

As an alternative you can also use a QR Code:  

The GUIDs for individual cells are displayed in the table below:

Summary of computational transaction
Raw Inputview raw input (R code)
Raw Outputview raw output of R engine
Computing time2 seconds
R Server'Sir Ronald Aylmer Fisher' @ 193.190.124.24


Univariate Dataseries
Name of dataseriesBelgië, Werkloosheid (niet werkende werkzoekenden), brutogegevens in duizenden, einde periode
Sourcehttp://www.nbb.be/belgostat/PresentationLinker?TableId=66000076&Lang=N
DescriptionBelgië, Werkloosheid (niet werkende werkzoekenden), brutogegevens in duizenden, einde periode
Number of observations61

\begin{tabular}{lllllllll}
\hline
Univariate Dataseries \tabularnewline
Name of dataseries & België, Werkloosheid (niet werkende werkzoekenden), brutogegevens in duizenden, einde periode \tabularnewline
Source & http://www.nbb.be/belgostat/PresentationLinker?TableId=66000076&Lang=N \tabularnewline
Description & België, Werkloosheid (niet werkende werkzoekenden), brutogegevens in duizenden, einde periode \tabularnewline
Number of observations & 61 \tabularnewline
\hline
\end{tabular}
%Source: https://freestatistics.org/blog/index.php?pk=17486&T=1

[TABLE]
[ROW][C]Univariate Dataseries[/C][/ROW]
[ROW][C]Name of dataseries[/C][C]België, Werkloosheid (niet werkende werkzoekenden), brutogegevens in duizenden, einde periode[/C][/ROW]
[ROW][C]Source[/C][C]http://www.nbb.be/belgostat/PresentationLinker?TableId=66000076&Lang=N[/C][/ROW]
[ROW][C]Description[/C][C]België, Werkloosheid (niet werkende werkzoekenden), brutogegevens in duizenden, einde periode[/C][/ROW]
[ROW][C]Number of observations[/C][C]61[/C][/ROW]
[/TABLE]
Source: https://freestatistics.org/blog/index.php?pk=17486&T=1

Globally Unique Identifier (entire table): ba.freestatistics.org/blog/index.php?pk=17486&T=1

As an alternative you can also use a QR Code:  

The GUIDs for individual cells are displayed in the table below:

Univariate Dataseries
Name of dataseriesBelgië, Werkloosheid (niet werkende werkzoekenden), brutogegevens in duizenden, einde periode
Sourcehttp://www.nbb.be/belgostat/PresentationLinker?TableId=66000076&Lang=N
DescriptionBelgië, Werkloosheid (niet werkende werkzoekenden), brutogegevens in duizenden, einde periode
Number of observations61


Parameters (Session):
par1 = België, Werkloosheid (niet werkende werkzoekenden), brutogegevens in duizenden, einde periode ; par2 = http://www.nbb.be/belgostat/PresentationLinker?TableId=66000076&Lang=N ; par3 = België, Werkloosheid (niet werkende werkzoekenden), brutogegevens in duizenden, einde periode ;
Parameters (R input):
par1 = België, Werkloosheid (niet werkende werkzoekenden), brutogegevens in duizenden, einde periode ; par2 = http://www.nbb.be/belgostat/PresentationLinker?TableId=66000076&Lang=N ; par3 = België, Werkloosheid (niet werkende werkzoekenden), brutogegevens in duizenden, einde periode ;
R code (references can be found in the software module):
bitmap(file='test1.png')
plot(x,col=2,type='b',main=main,xlab=xlab,ylab=ylab)
dev.off()
load(file='createtable')
a<-table.start()
a<-table.row.start(a)
a<-table.element(a,'Univariate Dataseries',2,TRUE)
a<-table.row.end(a)
a<-table.row.start(a)
a<-table.element(a,'Name of dataseries',header=TRUE)
a<-table.element(a,par1)
a<-table.row.end(a)
a<-table.row.start(a)
a<-table.element(a,'Source',header=TRUE)
a<-table.element(a,par2)
a<-table.row.end(a)
a<-table.row.start(a)
a<-table.element(a,'Description',header=TRUE)
a<-table.element(a,par3)
a<-table.row.end(a)
a<-table.row.start(a)
a<-table.element(a,'Number of observations',header=TRUE)
a<-table.element(a,length(x))
a<-table.row.end(a)
a<-table.end(a)
table.save(a,file='mytable.tab')