Free Statistics
of Irreproducible Research!
Description of Statistical Computation | |||||||||||||||||||||||||||||||||||||||||
|---|---|---|---|---|---|---|---|---|---|---|---|---|---|---|---|---|---|---|---|---|---|---|---|---|---|---|---|---|---|---|---|---|---|---|---|---|---|---|---|---|---|
| Author's title | |||||||||||||||||||||||||||||||||||||||||
| Author | *The author of this computation has been verified* | ||||||||||||||||||||||||||||||||||||||||
| R Software Module | rwasp_univariatedataseries.wasp | ||||||||||||||||||||||||||||||||||||||||
| Title produced by software | Univariate Data Series | ||||||||||||||||||||||||||||||||||||||||
| Date of computation | Mon, 20 Oct 2008 09:12:09 -0600 | ||||||||||||||||||||||||||||||||||||||||
| Cite this page as follows | Statistical Computations at FreeStatistics.org, Office for Research Development and Education, URL https://freestatistics.org/blog/index.php?v=date/2008/Oct/20/t1224515648ofls3if8nq3ed7u.htm/, Retrieved Sun, 19 May 2024 16:35:34 +0000 | ||||||||||||||||||||||||||||||||||||||||
| Statistical Computations at FreeStatistics.org, Office for Research Development and Education, URL https://freestatistics.org/blog/index.php?pk=17441, Retrieved Sun, 19 May 2024 16:35:34 +0000 | |||||||||||||||||||||||||||||||||||||||||
| QR Codes: | |||||||||||||||||||||||||||||||||||||||||
|
| |||||||||||||||||||||||||||||||||||||||||
| Original text written by user: | |||||||||||||||||||||||||||||||||||||||||
| IsPrivate? | No (this computation is public) | ||||||||||||||||||||||||||||||||||||||||
| User-defined keywords | |||||||||||||||||||||||||||||||||||||||||
| Estimated Impact | 174 | ||||||||||||||||||||||||||||||||||||||||
Tree of Dependent Computations | |||||||||||||||||||||||||||||||||||||||||
| Family? (F = Feedback message, R = changed R code, M = changed R Module, P = changed Parameters, D = changed Data) | |||||||||||||||||||||||||||||||||||||||||
| F [Univariate Data Series] [Aandelenmarkt BEL20] [2008-10-13 21:32:58] [1932d3c8dcd9b7464ac83a0122118fa4] - PD [Univariate Data Series] [Goudprijs (eur/kg)] [2008-10-20 12:41:41] [38f43994ada0e6172896e12525dcc585] - PD [Univariate Data Series] [Brent-Olie (USD/b...] [2008-10-20 15:12:09] [284c7cdb9fcda2adcbb08e211682c8d6] [Current] | |||||||||||||||||||||||||||||||||||||||||
| Feedback Forum | |||||||||||||||||||||||||||||||||||||||||
Post a new message | |||||||||||||||||||||||||||||||||||||||||
Dataset | |||||||||||||||||||||||||||||||||||||||||
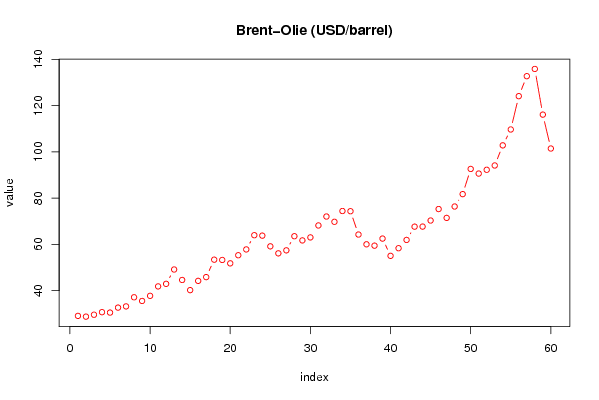
| Dataseries X: | |||||||||||||||||||||||||||||||||||||||||
29,08 28,76 29,59 30,7 30,52 32,67 33,19 37,13 35,54 37,75 41,84 42,94 49,14 44,61 40,22 44,23 45,85 53,38 53,26 51,8 55,3 57,81 63,96 63,77 59,15 56,12 57,42 63,52 61,71 63,01 68,18 72,03 69,75 74,41 74,33 64,24 60,03 59,44 62,5 55,04 58,34 61,92 67,65 67,68 70,3 75,26 71,44 76,36 81,71 92,6 90,6 92,23 94,09 102,79 109,65 124,05 132,69 135,81 116,07 101,42 | |||||||||||||||||||||||||||||||||||||||||
Tables (Output of Computation) | |||||||||||||||||||||||||||||||||||||||||
| |||||||||||||||||||||||||||||||||||||||||
Figures (Output of Computation) | |||||||||||||||||||||||||||||||||||||||||
Input Parameters & R Code | |||||||||||||||||||||||||||||||||||||||||
| Parameters (Session): | |||||||||||||||||||||||||||||||||||||||||
| par1 = Brent-olie (USD/barrel) ; par2 = Belgostat (aandelen en grondstoffenmarkt ; par3 = Dollar/vat ; | |||||||||||||||||||||||||||||||||||||||||
| Parameters (R input): | |||||||||||||||||||||||||||||||||||||||||
| par1 = Brent-olie (USD/barrel) ; par2 = Belgostat (aandelen en grondstoffenmarkt ; par3 = Dollar/vat ; | |||||||||||||||||||||||||||||||||||||||||
| R code (references can be found in the software module): | |||||||||||||||||||||||||||||||||||||||||
bitmap(file='test1.png') | |||||||||||||||||||||||||||||||||||||||||