Free Statistics

of Irreproducible Research!

Author's title

Author*The author of this computation has been verified*
R Software Modulerwasp_correlation.wasp
Title produced by softwarePearson Correlation
Date of computationMon, 20 Oct 2008 07:59:48 -0600
Cite this page as followsStatistical Computations at FreeStatistics.org, Office for Research Development and Education, URL https://freestatistics.org/blog/index.php?v=date/2008/Oct/20/t1224511241kd0ci5lgzgdtszz.htm/, Retrieved Sun, 19 May 2024 14:11:02 +0000
Statistical Computations at FreeStatistics.org, Office for Research Development and Education, URL https://freestatistics.org/blog/index.php?pk=17300, Retrieved Sun, 19 May 2024 14:11:02 +0000
QR Codes:

Original text written by user:
IsPrivate?No (this computation is public)
User-defined keywords
Estimated Impact149
Family? (F = Feedback message, R = changed R code, M = changed R Module, P = changed Parameters, D = changed Data)
F       [Pearson Correlation] [Opdracht 2 Q10 co...] [2008-10-20 13:59:48] [73ec5abea95a9c3c8c3a1ac44cab1f72] [Current]
Feedback Forum
2008-10-23 12:22:34 [Dana Molenberghs] [reply
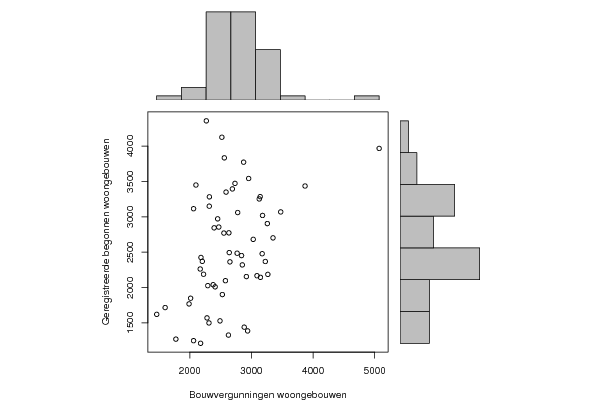
Rechts zie je een outlier, wanneer je deze wegwerkt zal je correlatie waarschijnlijk veel hoger liggen.
2008-10-25 17:37:16 [aebe3874afb22bf00f92b5d5833ef450] [reply
De tijdsreeksen die de student gekozen heeft hebben zeker met elkaar te maken, maar het wordt nogal eng gehouden. Er zijn enkel 'materiële' tijdsreeksen, als ik dit zo kan noemen, gebruikt en geen 'financiële'. Hiermee bedoel ik dat je wel verbanden tussen deze 4 zal vinden, maar dat je geen redenen voor bepaalde conclusies zal vinden. Hiervoor heb je immers de 'financiële' reeksen nodig, zoals prijzen van de bouwmaterialen, rente van leningen, werkloosheid, economische situatie. Dit zijn allemaal tijdreeksen die een groot effect op de vastgoedsector hebben en bepaalde zaken kunnen verklaren.
2008-10-27 10:34:13 [Joris Deboel] [reply
Als we de correlatie grafisch gaan bekijken zie je dat er wel een verband is maar geen overdreven sterk. De ene outliner gaat het coefficient wel een beetje beinvloeden maar niet in overdreven mate. De conclusie van de maker is dus wel correct
2008-10-27 16:01:12 [Bernard Femont] [reply
Het resultaat geeft een correlatiecoëfficiënt van 0,39, wat duidt op een matige samenhang van de reeksen. Er is niet meteen een duidelijk verband zodat een stijging of daling van het aantal toegekende bouwvergunningen niet tot gevolg heeft dat het aantal begonnen woongebouwen evenredig stijgt of daalt. Grafisch ziet men dat er wel een verband is maar in mindere maten. De outlier zorgt voor een verschuiving of foute weergave van de werkelijkheid maar deze outlier heeft geen extreem hoge waarde.
2008-10-28 06:41:21 [An De Koninck] [reply
De student heeft de correlatie tussen 2 tijdseries uitgelegd. Op zich is het gevonden resultaat correct en juist geïnterpreteerd, maar er wordt nogal dicht bij de zaak gebleven. Er zijn geen externe bronnen gebruikt om de stelling van 'weinig verband' te onderzoeken.
Een belangrijke opmerking is dat de 4 tijdsreeksen per 2 opgesplitst worden zodat het precies over 2 verschillende onderwerpen gaat. Het zou goed zijn om de correlatie tussen de 4 tijdsreeksen uit te leggen: dus 1&2, 1&3, 1&4, 2&3, 2&4

Post a new message
Dataseries X:
2490
3266
3475
3127
2955
3870
2852
3142
3029
3180
2560
2733
2452
2553
2777
2520
2318
2873
2311
2395
2099
2268
2316
2181
2175
2627
2578
3090
2634
3225
2938
3174
3350
2588
2061
2691
2061
2918
2223
2651
2379
3146
2883
2768
3258
2839
2470
5072
1463
1600
2203
2013
2169
2640
2411
2528
2292
1988
1774
2279
Dataseries Y:
1529
2186
3069
3252
3541
3435
2320
3285
2681
3019
3833
3472
2971
2770
3060
4124
3282
3772
1500
2844
3449
4356
3150
2425
1212
1328
2097
2167
2773
2368
1387
2478
2702
3349
3114
3394
1249
2155
2188
2363
2040
2144
1440
2485
2904
2452
2855
3966
1621
1717
2370
1849
2262
2494
2010
1901
2027
1769
1271
1571


Summary of computational transaction
Raw Inputview raw input (R code)
Raw Outputview raw output of R engine
Computing time1 seconds
R Server'George Udny Yule' @ 72.249.76.132

\begin{tabular}{lllllllll}
\hline
Summary of computational transaction \tabularnewline
Raw Input & view raw input (R code)  \tabularnewline
Raw Output & view raw output of R engine  \tabularnewline
Computing time & 1 seconds \tabularnewline
R Server & 'George Udny Yule' @ 72.249.76.132 \tabularnewline
\hline
\end{tabular}
%Source: https://freestatistics.org/blog/index.php?pk=17300&T=0

[TABLE]
[ROW][C]Summary of computational transaction[/C][/ROW]
[ROW][C]Raw Input[/C][C]view raw input (R code) [/C][/ROW]
[ROW][C]Raw Output[/C][C]view raw output of R engine [/C][/ROW]
[ROW][C]Computing time[/C][C]1 seconds[/C][/ROW]
[ROW][C]R Server[/C][C]'George Udny Yule' @ 72.249.76.132[/C][/ROW]
[/TABLE]
Source: https://freestatistics.org/blog/index.php?pk=17300&T=0

Globally Unique Identifier (entire table): ba.freestatistics.org/blog/index.php?pk=17300&T=0

As an alternative you can also use a QR Code:  

The GUIDs for individual cells are displayed in the table below:

Summary of computational transaction
Raw Inputview raw input (R code)
Raw Outputview raw output of R engine
Computing time1 seconds
R Server'George Udny Yule' @ 72.249.76.132


Pearson Product Moment Correlation - Ungrouped Data
StatisticVariable XVariable Y
Mean2648.352546.61666666667
Biased Variance315996.494166667611485.303055556
Biased Standard Deviation562.135654594749781.975257316723
Covariance174568.255084746
Correlation0.390509756106876
Determination0.152497869614652
T-Test3.23054270061719
p-value (2 sided)0.00203736865025839
p-value (1 sided)0.00101868432512919
Degrees of Freedom58
Number of Observations60

\begin{tabular}{lllllllll}
\hline
Pearson Product Moment Correlation - Ungrouped Data \tabularnewline
Statistic & Variable X & Variable Y \tabularnewline
Mean & 2648.35 & 2546.61666666667 \tabularnewline
Biased Variance & 315996.494166667 & 611485.303055556 \tabularnewline
Biased Standard Deviation & 562.135654594749 & 781.975257316723 \tabularnewline
Covariance & 174568.255084746 \tabularnewline
Correlation & 0.390509756106876 \tabularnewline
Determination & 0.152497869614652 \tabularnewline
T-Test & 3.23054270061719 \tabularnewline
p-value (2 sided) & 0.00203736865025839 \tabularnewline
p-value (1 sided) & 0.00101868432512919 \tabularnewline
Degrees of Freedom & 58 \tabularnewline
Number of Observations & 60 \tabularnewline
\hline
\end{tabular}
%Source: https://freestatistics.org/blog/index.php?pk=17300&T=1

[TABLE]
[ROW][C]Pearson Product Moment Correlation - Ungrouped Data[/C][/ROW]
[ROW][C]Statistic[/C][C]Variable X[/C][C]Variable Y[/C][/ROW]
[ROW][C]Mean[/C][C]2648.35[/C][C]2546.61666666667[/C][/ROW]
[ROW][C]Biased Variance[/C][C]315996.494166667[/C][C]611485.303055556[/C][/ROW]
[ROW][C]Biased Standard Deviation[/C][C]562.135654594749[/C][C]781.975257316723[/C][/ROW]
[ROW][C]Covariance[/C][C]174568.255084746[/C][/ROW]
[ROW][C]Correlation[/C][C]0.390509756106876[/C][/ROW]
[ROW][C]Determination[/C][C]0.152497869614652[/C][/ROW]
[ROW][C]T-Test[/C][C]3.23054270061719[/C][/ROW]
[ROW][C]p-value (2 sided)[/C][C]0.00203736865025839[/C][/ROW]
[ROW][C]p-value (1 sided)[/C][C]0.00101868432512919[/C][/ROW]
[ROW][C]Degrees of Freedom[/C][C]58[/C][/ROW]
[ROW][C]Number of Observations[/C][C]60[/C][/ROW]
[/TABLE]
Source: https://freestatistics.org/blog/index.php?pk=17300&T=1

Globally Unique Identifier (entire table): ba.freestatistics.org/blog/index.php?pk=17300&T=1

As an alternative you can also use a QR Code:  

The GUIDs for individual cells are displayed in the table below:

Pearson Product Moment Correlation - Ungrouped Data
StatisticVariable XVariable Y
Mean2648.352546.61666666667
Biased Variance315996.494166667611485.303055556
Biased Standard Deviation562.135654594749781.975257316723
Covariance174568.255084746
Correlation0.390509756106876
Determination0.152497869614652
T-Test3.23054270061719
p-value (2 sided)0.00203736865025839
p-value (1 sided)0.00101868432512919
Degrees of Freedom58
Number of Observations60


Parameters (Session):
Parameters (R input):
R code (references can be found in the software module):
bitmap(file='test1.png')
histx <- hist(x, plot=FALSE)
histy <- hist(y, plot=FALSE)
maxcounts <- max(c(histx$counts, histx$counts))
xrange <- c(min(x),max(x))
yrange <- c(min(y),max(y))
nf <- layout(matrix(c(2,0,1,3),2,2,byrow=TRUE), c(3,1), c(1,3), TRUE)
par(mar=c(4,4,1,1))
plot(x, y, xlim=xrange, ylim=yrange, xlab=xlab, ylab=ylab)
par(mar=c(0,4,1,1))
barplot(histx$counts, axes=FALSE, ylim=c(0, maxcounts), space=0)
par(mar=c(4,0,1,1))
barplot(histy$counts, axes=FALSE, xlim=c(0, maxcounts), space=0, horiz=TRUE)
dev.off()
lx = length(x)
makebiased = (lx-1)/lx
varx = var(x)*makebiased
vary = var(y)*makebiased
corxy <- cor.test(x,y,method='pearson')
cxy <- as.matrix(corxy$estimate)[1,1]
load(file='createtable')
a<-table.start()
a<-table.row.start(a)
a<-table.element(a,'Pearson Product Moment Correlation - Ungrouped Data',3,TRUE)
a<-table.row.end(a)
a<-table.row.start(a)
a<-table.element(a,'Statistic',1,TRUE)
a<-table.element(a,'Variable X',1,TRUE)
a<-table.element(a,'Variable Y',1,TRUE)
a<-table.row.end(a)
a<-table.row.start(a)
a<-table.element(a,hyperlink('arithmetic_mean.htm','Mean',''),header=TRUE)
a<-table.element(a,mean(x))
a<-table.element(a,mean(y))
a<-table.row.end(a)
a<-table.row.start(a)
a<-table.element(a,hyperlink('biased.htm','Biased Variance',''),header=TRUE)
a<-table.element(a,varx)
a<-table.element(a,vary)
a<-table.row.end(a)
a<-table.row.start(a)
a<-table.element(a,hyperlink('biased1.htm','Biased Standard Deviation',''),header=TRUE)
a<-table.element(a,sqrt(varx))
a<-table.element(a,sqrt(vary))
a<-table.row.end(a)
a<-table.row.start(a)
a<-table.element(a,hyperlink('covariance.htm','Covariance',''),header=TRUE)
a<-table.element(a,cov(x,y),2)
a<-table.row.end(a)
a<-table.row.start(a)
a<-table.element(a,hyperlink('pearson_correlation.htm','Correlation',''),header=TRUE)
a<-table.element(a,cxy,2)
a<-table.row.end(a)
a<-table.row.start(a)
a<-table.element(a,hyperlink('coeff_of_determination.htm','Determination',''),header=TRUE)
a<-table.element(a,cxy*cxy,2)
a<-table.row.end(a)
a<-table.row.start(a)
a<-table.element(a,hyperlink('ttest_statistic.htm','T-Test',''),header=TRUE)
a<-table.element(a,as.matrix(corxy$statistic)[1,1],2)
a<-table.row.end(a)
a<-table.row.start(a)
a<-table.element(a,'p-value (2 sided)',header=TRUE)
a<-table.element(a,(p2 <- as.matrix(corxy$p.value)[1,1]),2)
a<-table.row.end(a)
a<-table.row.start(a)
a<-table.element(a,'p-value (1 sided)',header=TRUE)
a<-table.element(a,p2/2,2)
a<-table.row.end(a)
a<-table.row.start(a)
a<-table.element(a,'Degrees of Freedom',header=TRUE)
a<-table.element(a,lx-2,2)
a<-table.row.end(a)
a<-table.row.start(a)
a<-table.element(a,'Number of Observations',header=TRUE)
a<-table.element(a,lx,2)
a<-table.row.end(a)
a<-table.end(a)
table.save(a,file='mytable.tab')