Free Statistics

of Irreproducible Research!

Author's title

Author*Unverified author*
R Software Modulerwasp_correlation.wasp
Title produced by softwarePearson Correlation
Date of computationMon, 20 Oct 2008 07:44:46 -0600
Cite this page as followsStatistical Computations at FreeStatistics.org, Office for Research Development and Education, URL https://freestatistics.org/blog/index.php?v=date/2008/Oct/20/t1224510342z2z06857atoeey1.htm/, Retrieved Sun, 19 May 2024 16:12:17 +0000
Statistical Computations at FreeStatistics.org, Office for Research Development and Education, URL https://freestatistics.org/blog/index.php?pk=17269, Retrieved Sun, 19 May 2024 16:12:17 +0000
QR Codes:

Original text written by user:
IsPrivate?No (this computation is public)
User-defined keywords
Estimated Impact133
Family? (F = Feedback message, R = changed R code, M = changed R Module, P = changed Parameters, D = changed Data)
F     [Pearson Correlation] [Q3 Clothing produ...] [2007-10-20 14:22:11] [b731da8b544846036771bbf9bf2f34ce]
F    D    [Pearson Correlation] [Q3 de totale prod...] [2008-10-20 13:44:46] [2fdb1a8e4a6fa49ce74bdce2c154874d] [Current]
Feedback Forum
2008-10-22 15:49:13 [90714a39acc78a7b2ecd294ecc6b2864] [reply
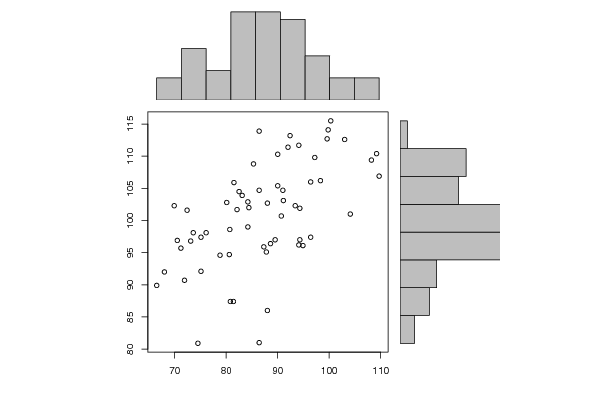
Als er een verandering is in een datareeks, wat brengt dat teweeg bij de andere datareeks? Dat verband wordt uitgedrukt via correlatie en een correlatiecoëfficiënt. Een correlatiecoëfficiënt varieert van 0, geen verband, tot -1 of +1, perfect negatief verband en perfect positief verband. Hier is de coëfficiënt 0,56 dus er is zeker sprake van positieve correlatie. Op de grafiek kan je een denkbeeldige rechte trekken die de trendlijn is van de observaties. Deze rechte kan stijgend, dalend of horizontaal gelegen zijn en dit heeft te maken met de coëfficiënt (-1 <- 0 -> +1). De hoek tussen de denkbeeldige rechte door de observaties en een horizontale rechte (geen verband) is gelijk aan de correlatiecoëfficiënt.
2008-10-27 09:26:58 [Joris Deboel] [reply
Via de pearson correlation kunnen we het verband testen tussen twee reeksen. In dit geval is er een correlatiecoëfficiënt van 0,56 wat wil zeggen dat er een positief verband is tussen beide reeksen. Dus al de ene reeks een verandering toont zal dit een effect geven op de andere reeks.

Post a new message
Dataseries X:
109,20
88,60
94,30
98,30
86,40
80,60
104,10
108,20
93,40
71,90
94,10
94,90
96,40
91,10
84,40
86,40
88,00
75,10
109,70
103,00
82,10
68,00
96,40
94,30
90,00
88,00
76,10
82,50
81,40
66,50
97,20
94,10
80,70
70,50
87,80
89,50
99,60
84,20
75,10
92,00
80,80
73,10
99,80
90,00
83,10
72,40
78,80
87,30
91,00
80,10
73,60
86,40
74,50
71,20
92,40
81,50
85,30
69,90
84,20
90,70
100,30
Dataseries Y:
110,40
96,40
101,90
106,20
81,00
94,70
101,00
109,40
102,30
90,70
96,20
96,10
106,00
103,10
102,00
104,70
86,00
92,10
106,90
112,60
101,70
92,00
97,40
97,00
105,40
102,70
98,10
104,50
87,40
89,90
109,80
111,70
98,60
96,90
95,10
97,00
112,70
102,90
97,40
111,40
87,40
96,80
114,10
110,30
103,90
101,60
94,60
95,90
104,70
102,80
98,10
113,90
80,90
95,70
113,20
105,90
108,80
102,30
99,00
100,70
115,50


Summary of computational transaction
Raw Inputview raw input (R code)
Raw Outputview raw output of R engine
Computing time0 seconds
R Server'Gwilym Jenkins' @ 72.249.127.135

\begin{tabular}{lllllllll}
\hline
Summary of computational transaction \tabularnewline
Raw Input & view raw input (R code)  \tabularnewline
Raw Output & view raw output of R engine  \tabularnewline
Computing time & 0 seconds \tabularnewline
R Server & 'Gwilym Jenkins' @ 72.249.127.135 \tabularnewline
\hline
\end{tabular}
%Source: https://freestatistics.org/blog/index.php?pk=17269&T=0

[TABLE]
[ROW][C]Summary of computational transaction[/C][/ROW]
[ROW][C]Raw Input[/C][C]view raw input (R code) [/C][/ROW]
[ROW][C]Raw Output[/C][C]view raw output of R engine [/C][/ROW]
[ROW][C]Computing time[/C][C]0 seconds[/C][/ROW]
[ROW][C]R Server[/C][C]'Gwilym Jenkins' @ 72.249.127.135[/C][/ROW]
[/TABLE]
Source: https://freestatistics.org/blog/index.php?pk=17269&T=0

Globally Unique Identifier (entire table): ba.freestatistics.org/blog/index.php?pk=17269&T=0

As an alternative you can also use a QR Code:  

The GUIDs for individual cells are displayed in the table below:

Summary of computational transaction
Raw Inputview raw input (R code)
Raw Outputview raw output of R engine
Computing time0 seconds
R Server'Gwilym Jenkins' @ 72.249.127.135


Pearson Product Moment Correlation - Ungrouped Data
StatisticVariable XVariable Y
Mean86.8934426229508100.908196721311
Biased Variance109.89176027949564.2309164203171
Biased Standard Deviation10.48292708548028.01441928153981
Covariance48.2815546448088
Correlation0.565259717157914
Determination0.319518547841445
T-Test5.2633941884171
p-value (2 sided)2.07228182791397e-06
p-value (1 sided)1.03614091395698e-06
Degrees of Freedom59
Number of Observations61

\begin{tabular}{lllllllll}
\hline
Pearson Product Moment Correlation - Ungrouped Data \tabularnewline
Statistic & Variable X & Variable Y \tabularnewline
Mean & 86.8934426229508 & 100.908196721311 \tabularnewline
Biased Variance & 109.891760279495 & 64.2309164203171 \tabularnewline
Biased Standard Deviation & 10.4829270854802 & 8.01441928153981 \tabularnewline
Covariance & 48.2815546448088 \tabularnewline
Correlation & 0.565259717157914 \tabularnewline
Determination & 0.319518547841445 \tabularnewline
T-Test & 5.2633941884171 \tabularnewline
p-value (2 sided) & 2.07228182791397e-06 \tabularnewline
p-value (1 sided) & 1.03614091395698e-06 \tabularnewline
Degrees of Freedom & 59 \tabularnewline
Number of Observations & 61 \tabularnewline
\hline
\end{tabular}
%Source: https://freestatistics.org/blog/index.php?pk=17269&T=1

[TABLE]
[ROW][C]Pearson Product Moment Correlation - Ungrouped Data[/C][/ROW]
[ROW][C]Statistic[/C][C]Variable X[/C][C]Variable Y[/C][/ROW]
[ROW][C]Mean[/C][C]86.8934426229508[/C][C]100.908196721311[/C][/ROW]
[ROW][C]Biased Variance[/C][C]109.891760279495[/C][C]64.2309164203171[/C][/ROW]
[ROW][C]Biased Standard Deviation[/C][C]10.4829270854802[/C][C]8.01441928153981[/C][/ROW]
[ROW][C]Covariance[/C][C]48.2815546448088[/C][/ROW]
[ROW][C]Correlation[/C][C]0.565259717157914[/C][/ROW]
[ROW][C]Determination[/C][C]0.319518547841445[/C][/ROW]
[ROW][C]T-Test[/C][C]5.2633941884171[/C][/ROW]
[ROW][C]p-value (2 sided)[/C][C]2.07228182791397e-06[/C][/ROW]
[ROW][C]p-value (1 sided)[/C][C]1.03614091395698e-06[/C][/ROW]
[ROW][C]Degrees of Freedom[/C][C]59[/C][/ROW]
[ROW][C]Number of Observations[/C][C]61[/C][/ROW]
[/TABLE]
Source: https://freestatistics.org/blog/index.php?pk=17269&T=1

Globally Unique Identifier (entire table): ba.freestatistics.org/blog/index.php?pk=17269&T=1

As an alternative you can also use a QR Code:  

The GUIDs for individual cells are displayed in the table below:

Pearson Product Moment Correlation - Ungrouped Data
StatisticVariable XVariable Y
Mean86.8934426229508100.908196721311
Biased Variance109.89176027949564.2309164203171
Biased Standard Deviation10.48292708548028.01441928153981
Covariance48.2815546448088
Correlation0.565259717157914
Determination0.319518547841445
T-Test5.2633941884171
p-value (2 sided)2.07228182791397e-06
p-value (1 sided)1.03614091395698e-06
Degrees of Freedom59
Number of Observations61


Parameters (Session):
Parameters (R input):
par1 = ; par2 = ; par3 = ; par4 = ; par5 = ; par6 = ; par7 = ; par8 = ; par9 = ; par10 = ; par11 = ; par12 = ; par13 = ; par14 = ; par15 = ; par16 = ; par17 = ; par18 = ; par19 = ; par20 = ;
R code (references can be found in the software module):
bitmap(file='test1.png')
histx <- hist(x, plot=FALSE)
histy <- hist(y, plot=FALSE)
maxcounts <- max(c(histx$counts, histx$counts))
xrange <- c(min(x),max(x))
yrange <- c(min(y),max(y))
nf <- layout(matrix(c(2,0,1,3),2,2,byrow=TRUE), c(3,1), c(1,3), TRUE)
par(mar=c(4,4,1,1))
plot(x, y, xlim=xrange, ylim=yrange, xlab=xlab, ylab=ylab)
par(mar=c(0,4,1,1))
barplot(histx$counts, axes=FALSE, ylim=c(0, maxcounts), space=0)
par(mar=c(4,0,1,1))
barplot(histy$counts, axes=FALSE, xlim=c(0, maxcounts), space=0, horiz=TRUE)
dev.off()
lx = length(x)
makebiased = (lx-1)/lx
varx = var(x)*makebiased
vary = var(y)*makebiased
corxy <- cor.test(x,y,method='pearson')
cxy <- as.matrix(corxy$estimate)[1,1]
load(file='createtable')
a<-table.start()
a<-table.row.start(a)
a<-table.element(a,'Pearson Product Moment Correlation - Ungrouped Data',3,TRUE)
a<-table.row.end(a)
a<-table.row.start(a)
a<-table.element(a,'Statistic',1,TRUE)
a<-table.element(a,'Variable X',1,TRUE)
a<-table.element(a,'Variable Y',1,TRUE)
a<-table.row.end(a)
a<-table.row.start(a)
a<-table.element(a,hyperlink('arithmetic_mean.htm','Mean',''),header=TRUE)
a<-table.element(a,mean(x))
a<-table.element(a,mean(y))
a<-table.row.end(a)
a<-table.row.start(a)
a<-table.element(a,hyperlink('biased.htm','Biased Variance',''),header=TRUE)
a<-table.element(a,varx)
a<-table.element(a,vary)
a<-table.row.end(a)
a<-table.row.start(a)
a<-table.element(a,hyperlink('biased1.htm','Biased Standard Deviation',''),header=TRUE)
a<-table.element(a,sqrt(varx))
a<-table.element(a,sqrt(vary))
a<-table.row.end(a)
a<-table.row.start(a)
a<-table.element(a,hyperlink('covariance.htm','Covariance',''),header=TRUE)
a<-table.element(a,cov(x,y),2)
a<-table.row.end(a)
a<-table.row.start(a)
a<-table.element(a,hyperlink('pearson_correlation.htm','Correlation',''),header=TRUE)
a<-table.element(a,cxy,2)
a<-table.row.end(a)
a<-table.row.start(a)
a<-table.element(a,hyperlink('coeff_of_determination.htm','Determination',''),header=TRUE)
a<-table.element(a,cxy*cxy,2)
a<-table.row.end(a)
a<-table.row.start(a)
a<-table.element(a,hyperlink('ttest_statistic.htm','T-Test',''),header=TRUE)
a<-table.element(a,as.matrix(corxy$statistic)[1,1],2)
a<-table.row.end(a)
a<-table.row.start(a)
a<-table.element(a,'p-value (2 sided)',header=TRUE)
a<-table.element(a,(p2 <- as.matrix(corxy$p.value)[1,1]),2)
a<-table.row.end(a)
a<-table.row.start(a)
a<-table.element(a,'p-value (1 sided)',header=TRUE)
a<-table.element(a,p2/2,2)
a<-table.row.end(a)
a<-table.row.start(a)
a<-table.element(a,'Degrees of Freedom',header=TRUE)
a<-table.element(a,lx-2,2)
a<-table.row.end(a)
a<-table.row.start(a)
a<-table.element(a,'Number of Observations',header=TRUE)
a<-table.element(a,lx,2)
a<-table.row.end(a)
a<-table.end(a)
table.save(a,file='mytable.tab')