Free Statistics

of Irreproducible Research!

Author's title

Author*The author of this computation has been verified*
R Software Modulerwasp_centraltendency.wasp
Title produced by softwareCentral Tendency
Date of computationMon, 20 Oct 2008 06:47:42 -0600
Cite this page as followsStatistical Computations at FreeStatistics.org, Office for Research Development and Education, URL https://freestatistics.org/blog/index.php?v=date/2008/Oct/20/t1224506949y42sc7tj0kty6qi.htm/, Retrieved Sun, 19 May 2024 14:34:16 +0000
Statistical Computations at FreeStatistics.org, Office for Research Development and Education, URL https://freestatistics.org/blog/index.php?pk=17224, Retrieved Sun, 19 May 2024 14:34:16 +0000
QR Codes:

Original text written by user:
IsPrivate?No (this computation is public)
User-defined keywords
Estimated Impact174
Family? (F = Feedback message, R = changed R code, M = changed R Module, P = changed Parameters, D = changed Data)
F     [Central Tendency] [Q1 central tenden...] [2007-10-18 09:35:57] [b731da8b544846036771bbf9bf2f34ce]
F    D    [Central Tendency] [Investments] [2008-10-20 12:47:42] [de3f0516a1536f7c4a656924d8bc8d07] [Current]
Feedback Forum
2008-10-25 12:10:46 [Davy De Nef] [reply
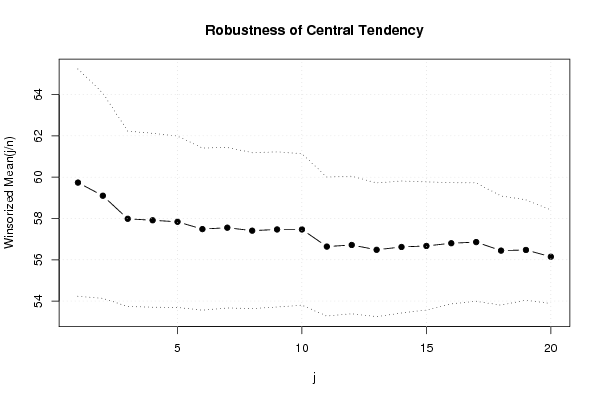
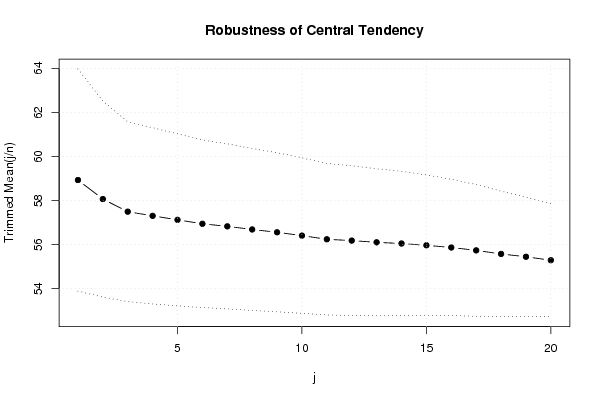
De student berekent aan de hand van de Winsorized mean en de trimmed mean de robuustheid van Central Tendency.
Beide grafieken vertonen een dalend verloop.
De trimmed mean verloopt vloeiender omdat er hier gewerkt wordt met een kleinere dataset. De staarten worden weggelaten. Dit is niet het geval bij de winsorized mean. Vandaar dat je daar een minder vloeiend verloop krijgt.
2008-10-25 13:32:41 [Astrid Sniekers] [reply
De uitleg van de student is miniem. Hij geeft niet echt een antwoord op de vraag.
Beter zou zijn: We kijken het beste naar de grafieken van winsorized en trimmed mean. Zowel bij winsorized mean als bij trimmed mean verkleint de dataset en convergeert naar de mediaan. Op deze manier gaan we een veel betere maat van gemiddelde krijgen. Omdat de winsorized mean en de trimmed mean bij de productie van kledij op een meer horizontale lijn liggen dan bij de investeringen, is de productie van kledij robuuster en niet zo gevoelig aan ‘outliers’ dan bij investeringen.
2008-10-26 13:22:01 [Kristof Augustyns] [reply
Men berekent hier dus via winsorized - en trimmed mean, de tendens bij de investeringen in de loop der jaren.
Het verschil tussen de winsorized mean en de trimmed mean is dat de dataset bij de trimmed mean kleiner is en dus minder nauwkeurig dan de winsorized mean.
Hoe meer datasets, hoe nauwkeuriger hebben we in de eerste opdracht opgemerkt.
Bij de winsorized mean merken we dus op dat de lijn vrij tot zeer vlot loopt zonder dat er veel gekronkel in voorkomt.
Dit wil dus zeggen dat het verloop van de investeringen normaal verloopt zonder dat er speciale veranderingen gebeuren in de loop der jaren.
Ook valt er te zien dat de midrange in de loop der jaren alsmaar meer naar de winsorized mean loop en tegelijkertijd doet die mediaan dat ook.
Er is hier dus spraken van een rustig dalende lijn met een paar kleine uitschieters in de eerste jaren en jaar 10, maar niet om te spreken van outliers.
Bij de trimmed mean is de lijn nog veel rechter omdat er minder gebruik is gemaakt van datasets en dus minder nauwkeurig is.
De student (ik dus) heeft in deze opdracht de juiste berekeningen gemaakt, maar de uitleg erbij is een beetje te gering.
2008-10-27 19:41:03 [Bart Haemels] [reply
De student zijn antwoord is zeer beknopt. Maar het is wel correct.

Je had er echter nog aan kunnen toevoegen dat je dataset verkort wordt bij de trimmed and de windsorized mean waardoor de dataset convergeert naar de mediaan. De dataset v kledij is duidelijker robuuster dan die van de investeringen

Post a new message
Dataseries X:
72.50
59.40
85.70
88.20
62.80
87.00
79.20
112.00
79.20
132.10
40.10
69.00
59.40
73.80
57.40
81.10
46.60
41.40
71.20
67.90
72.00
145.50
39.70
51.90
73.70
70.90
60.80
61.00
54.50
39.10
66.60
58.50
59.80
80.90
37.30
44.60
48.70
54.00
49.50
61.60
35.00
35.70
51.30
49.00
41.50
72.50
42.10
44.10
45.10
50.30
40.90
47.20
36.90
40.90
38.30
46.30
28.40
78.40
36.80
50.70
42.80


Summary of computational transaction
Raw Inputview raw input (R code)
Raw Outputview raw output of R engine
Computing time5 seconds
R Server'Herman Ole Andreas Wold' @ 193.190.124.10:1001

\begin{tabular}{lllllllll}
\hline
Summary of computational transaction \tabularnewline
Raw Input & view raw input (R code)  \tabularnewline
Raw Output & view raw output of R engine  \tabularnewline
Computing time & 5 seconds \tabularnewline
R Server & 'Herman Ole Andreas Wold' @ 193.190.124.10:1001 \tabularnewline
\hline
\end{tabular}
%Source: https://freestatistics.org/blog/index.php?pk=17224&T=0

[TABLE]
[ROW][C]Summary of computational transaction[/C][/ROW]
[ROW][C]Raw Input[/C][C]view raw input (R code) [/C][/ROW]
[ROW][C]Raw Output[/C][C]view raw output of R engine [/C][/ROW]
[ROW][C]Computing time[/C][C]5 seconds[/C][/ROW]
[ROW][C]R Server[/C][C]'Herman Ole Andreas Wold' @ 193.190.124.10:1001[/C][/ROW]
[/TABLE]
Source: https://freestatistics.org/blog/index.php?pk=17224&T=0

Globally Unique Identifier (entire table): ba.freestatistics.org/blog/index.php?pk=17224&T=0

As an alternative you can also use a QR Code:  

The GUIDs for individual cells are displayed in the table below:

Summary of computational transaction
Raw Inputview raw input (R code)
Raw Outputview raw output of R engine
Computing time5 seconds
R Server'Herman Ole Andreas Wold' @ 193.190.124.10:1001


Central Tendency - Ungrouped Data
MeasureValueS.E.Value/S.E.
Arithmetic Mean59.84918032786892.8716977927431720.8410440956248
Geometric Mean56.4524800704516
Harmonic Mean53.5884811561598
Quadratic Mean63.8492230077119
Winsorized Mean ( 1 / 20 )59.73770491803282.7507834591232221.7166148501829
Winsorized Mean ( 2 / 20 )59.10163934426232.4844681367291323.7884473020738
Winsorized Mean ( 3 / 20 )57.98524590163932.1239099886065327.3011785869903
Winsorized Mean ( 4 / 20 )57.91311475409842.1044260869047027.5196715695918
Winsorized Mean ( 5 / 20 )57.83934426229512.0747931343173827.8771619712944
Winsorized Mean ( 6 / 20 )57.48524590163931.9625159998172429.2916062376015
Winsorized Mean ( 7 / 20 )57.55409836065571.9431715579597929.6186397566893
Winsorized Mean ( 8 / 20 )57.40983606557381.8869999680269030.4238670049386
Winsorized Mean ( 9 / 20 )57.46885245901641.8778352566922730.603777543428
Winsorized Mean ( 10 / 20 )57.46885245901641.8327120770288731.3572727431267
Winsorized Mean ( 11 / 20 )56.63934426229511.6829168646018533.655461807791
Winsorized Mean ( 12 / 20 )56.71803278688521.6643620813053334.0779409864964
Winsorized Mean ( 13 / 20 )56.4836065573771.618236543274334.9044191296592
Winsorized Mean ( 14 / 20 )56.62131147540981.5971766667051035.4508756956843
Winsorized Mean ( 15 / 20 )56.67049180327871.5509900667720836.5382686951834
Winsorized Mean ( 16 / 20 )56.80163934426231.4664899765712838.733056653457
Winsorized Mean ( 17 / 20 )56.85737704918031.4328283371728239.6819183248206
Winsorized Mean ( 18 / 20 )56.4442622950821.3215211565311342.7115843103436
Winsorized Mean ( 19 / 20 )56.47540983606561.2146704690135046.4944289638756
Winsorized Mean ( 20 / 20 )56.14754098360661.1347602875275549.4796492270122
Trimmed Mean ( 1 / 20 )58.93050847457632.5244465217177423.343932211516
Trimmed Mean ( 2 / 20 )58.06666666666672.2275647454273926.0673306066018
Trimmed Mean ( 3 / 20 )57.49272727272732.0442624884095028.1239457255112
Trimmed Mean ( 4 / 20 )57.30377358490572.0013275025839928.6328816802441
Trimmed Mean ( 5 / 20 )57.1215686274511.9542579229005429.2292884977385
Trimmed Mean ( 6 / 20 )56.94285714285711.9041196833989929.9050829836547
Trimmed Mean ( 7 / 20 )56.82553191489361.8743866541316730.3168675415151
Trimmed Mean ( 8 / 20 )56.68444444444441.8396776055821230.8121620181967
Trimmed Mean ( 9 / 20 )56.55581395348841.8082201325896031.2770624185526
Trimmed Mean ( 10 / 20 )56.40487804878051.7669939722022131.9213754750295
Trimmed Mean ( 11 / 20 )56.23846153846151.7221374197896932.6561985659249
Trimmed Mean ( 12 / 20 )56.17837837837841.7004333272808933.0376836757319
Trimmed Mean ( 13 / 20 )56.11.6717675444538033.5572969974896
Trimmed Mean ( 14 / 20 )56.04545454545451.6409767676801934.1537160362634
Trimmed Mean ( 15 / 20 )55.96451612903231.5991163446083234.9971509688621
Trimmed Mean ( 16 / 20 )55.86551724137931.5486548736839236.0735746812892
Trimmed Mean ( 17 / 20 )55.73333333333331.4971007118128537.2275110776251
Trimmed Mean ( 18 / 20 )55.5721.4252312093130738.9915682710768
Trimmed Mean ( 19 / 20 )55.44347826086961.3545535280504840.9311829416336
Trimmed Mean ( 20 / 20 )55.28571428571431.2809275975651743.16068635792
Median54.5
Midrange86.95
Midmean - Weighted Average at Xnp55.43
Midmean - Weighted Average at X(n+1)p55.9645161290323
Midmean - Empirical Distribution Function55.9645161290323
Midmean - Empirical Distribution Function - Averaging55.9645161290323
Midmean - Empirical Distribution Function - Interpolation55.9645161290323
Midmean - Closest Observation55.53125
Midmean - True Basic - Statistics Graphics Toolkit55.9645161290323
Midmean - MS Excel (old versions)55.9645161290323
Number of observations61

\begin{tabular}{lllllllll}
\hline
Central Tendency - Ungrouped Data \tabularnewline
Measure & Value & S.E. & Value/S.E. \tabularnewline
Arithmetic Mean & 59.8491803278689 & 2.87169779274317 & 20.8410440956248 \tabularnewline
Geometric Mean & 56.4524800704516 &  &  \tabularnewline
Harmonic Mean & 53.5884811561598 &  &  \tabularnewline
Quadratic Mean & 63.8492230077119 &  &  \tabularnewline
Winsorized Mean ( 1 / 20 ) & 59.7377049180328 & 2.75078345912322 & 21.7166148501829 \tabularnewline
Winsorized Mean ( 2 / 20 ) & 59.1016393442623 & 2.48446813672913 & 23.7884473020738 \tabularnewline
Winsorized Mean ( 3 / 20 ) & 57.9852459016393 & 2.12390998860653 & 27.3011785869903 \tabularnewline
Winsorized Mean ( 4 / 20 ) & 57.9131147540984 & 2.10442608690470 & 27.5196715695918 \tabularnewline
Winsorized Mean ( 5 / 20 ) & 57.8393442622951 & 2.07479313431738 & 27.8771619712944 \tabularnewline
Winsorized Mean ( 6 / 20 ) & 57.4852459016393 & 1.96251599981724 & 29.2916062376015 \tabularnewline
Winsorized Mean ( 7 / 20 ) & 57.5540983606557 & 1.94317155795979 & 29.6186397566893 \tabularnewline
Winsorized Mean ( 8 / 20 ) & 57.4098360655738 & 1.88699996802690 & 30.4238670049386 \tabularnewline
Winsorized Mean ( 9 / 20 ) & 57.4688524590164 & 1.87783525669227 & 30.603777543428 \tabularnewline
Winsorized Mean ( 10 / 20 ) & 57.4688524590164 & 1.83271207702887 & 31.3572727431267 \tabularnewline
Winsorized Mean ( 11 / 20 ) & 56.6393442622951 & 1.68291686460185 & 33.655461807791 \tabularnewline
Winsorized Mean ( 12 / 20 ) & 56.7180327868852 & 1.66436208130533 & 34.0779409864964 \tabularnewline
Winsorized Mean ( 13 / 20 ) & 56.483606557377 & 1.6182365432743 & 34.9044191296592 \tabularnewline
Winsorized Mean ( 14 / 20 ) & 56.6213114754098 & 1.59717666670510 & 35.4508756956843 \tabularnewline
Winsorized Mean ( 15 / 20 ) & 56.6704918032787 & 1.55099006677208 & 36.5382686951834 \tabularnewline
Winsorized Mean ( 16 / 20 ) & 56.8016393442623 & 1.46648997657128 & 38.733056653457 \tabularnewline
Winsorized Mean ( 17 / 20 ) & 56.8573770491803 & 1.43282833717282 & 39.6819183248206 \tabularnewline
Winsorized Mean ( 18 / 20 ) & 56.444262295082 & 1.32152115653113 & 42.7115843103436 \tabularnewline
Winsorized Mean ( 19 / 20 ) & 56.4754098360656 & 1.21467046901350 & 46.4944289638756 \tabularnewline
Winsorized Mean ( 20 / 20 ) & 56.1475409836066 & 1.13476028752755 & 49.4796492270122 \tabularnewline
Trimmed Mean ( 1 / 20 ) & 58.9305084745763 & 2.52444652171774 & 23.343932211516 \tabularnewline
Trimmed Mean ( 2 / 20 ) & 58.0666666666667 & 2.22756474542739 & 26.0673306066018 \tabularnewline
Trimmed Mean ( 3 / 20 ) & 57.4927272727273 & 2.04426248840950 & 28.1239457255112 \tabularnewline
Trimmed Mean ( 4 / 20 ) & 57.3037735849057 & 2.00132750258399 & 28.6328816802441 \tabularnewline
Trimmed Mean ( 5 / 20 ) & 57.121568627451 & 1.95425792290054 & 29.2292884977385 \tabularnewline
Trimmed Mean ( 6 / 20 ) & 56.9428571428571 & 1.90411968339899 & 29.9050829836547 \tabularnewline
Trimmed Mean ( 7 / 20 ) & 56.8255319148936 & 1.87438665413167 & 30.3168675415151 \tabularnewline
Trimmed Mean ( 8 / 20 ) & 56.6844444444444 & 1.83967760558212 & 30.8121620181967 \tabularnewline
Trimmed Mean ( 9 / 20 ) & 56.5558139534884 & 1.80822013258960 & 31.2770624185526 \tabularnewline
Trimmed Mean ( 10 / 20 ) & 56.4048780487805 & 1.76699397220221 & 31.9213754750295 \tabularnewline
Trimmed Mean ( 11 / 20 ) & 56.2384615384615 & 1.72213741978969 & 32.6561985659249 \tabularnewline
Trimmed Mean ( 12 / 20 ) & 56.1783783783784 & 1.70043332728089 & 33.0376836757319 \tabularnewline
Trimmed Mean ( 13 / 20 ) & 56.1 & 1.67176754445380 & 33.5572969974896 \tabularnewline
Trimmed Mean ( 14 / 20 ) & 56.0454545454545 & 1.64097676768019 & 34.1537160362634 \tabularnewline
Trimmed Mean ( 15 / 20 ) & 55.9645161290323 & 1.59911634460832 & 34.9971509688621 \tabularnewline
Trimmed Mean ( 16 / 20 ) & 55.8655172413793 & 1.54865487368392 & 36.0735746812892 \tabularnewline
Trimmed Mean ( 17 / 20 ) & 55.7333333333333 & 1.49710071181285 & 37.2275110776251 \tabularnewline
Trimmed Mean ( 18 / 20 ) & 55.572 & 1.42523120931307 & 38.9915682710768 \tabularnewline
Trimmed Mean ( 19 / 20 ) & 55.4434782608696 & 1.35455352805048 & 40.9311829416336 \tabularnewline
Trimmed Mean ( 20 / 20 ) & 55.2857142857143 & 1.28092759756517 & 43.16068635792 \tabularnewline
Median & 54.5 &  &  \tabularnewline
Midrange & 86.95 &  &  \tabularnewline
Midmean - Weighted Average at Xnp & 55.43 &  &  \tabularnewline
Midmean - Weighted Average at X(n+1)p & 55.9645161290323 &  &  \tabularnewline
Midmean - Empirical Distribution Function & 55.9645161290323 &  &  \tabularnewline
Midmean - Empirical Distribution Function - Averaging & 55.9645161290323 &  &  \tabularnewline
Midmean - Empirical Distribution Function - Interpolation & 55.9645161290323 &  &  \tabularnewline
Midmean - Closest Observation & 55.53125 &  &  \tabularnewline
Midmean - True Basic - Statistics Graphics Toolkit & 55.9645161290323 &  &  \tabularnewline
Midmean - MS Excel (old versions) & 55.9645161290323 &  &  \tabularnewline
Number of observations & 61 &  &  \tabularnewline
\hline
\end{tabular}
%Source: https://freestatistics.org/blog/index.php?pk=17224&T=1

[TABLE]
[ROW][C]Central Tendency - Ungrouped Data[/C][/ROW]
[ROW][C]Measure[/C][C]Value[/C][C]S.E.[/C][C]Value/S.E.[/C][/ROW]
[ROW][C]Arithmetic Mean[/C][C]59.8491803278689[/C][C]2.87169779274317[/C][C]20.8410440956248[/C][/ROW]
[ROW][C]Geometric Mean[/C][C]56.4524800704516[/C][C][/C][C][/C][/ROW]
[ROW][C]Harmonic Mean[/C][C]53.5884811561598[/C][C][/C][C][/C][/ROW]
[ROW][C]Quadratic Mean[/C][C]63.8492230077119[/C][C][/C][C][/C][/ROW]
[ROW][C]Winsorized Mean ( 1 / 20 )[/C][C]59.7377049180328[/C][C]2.75078345912322[/C][C]21.7166148501829[/C][/ROW]
[ROW][C]Winsorized Mean ( 2 / 20 )[/C][C]59.1016393442623[/C][C]2.48446813672913[/C][C]23.7884473020738[/C][/ROW]
[ROW][C]Winsorized Mean ( 3 / 20 )[/C][C]57.9852459016393[/C][C]2.12390998860653[/C][C]27.3011785869903[/C][/ROW]
[ROW][C]Winsorized Mean ( 4 / 20 )[/C][C]57.9131147540984[/C][C]2.10442608690470[/C][C]27.5196715695918[/C][/ROW]
[ROW][C]Winsorized Mean ( 5 / 20 )[/C][C]57.8393442622951[/C][C]2.07479313431738[/C][C]27.8771619712944[/C][/ROW]
[ROW][C]Winsorized Mean ( 6 / 20 )[/C][C]57.4852459016393[/C][C]1.96251599981724[/C][C]29.2916062376015[/C][/ROW]
[ROW][C]Winsorized Mean ( 7 / 20 )[/C][C]57.5540983606557[/C][C]1.94317155795979[/C][C]29.6186397566893[/C][/ROW]
[ROW][C]Winsorized Mean ( 8 / 20 )[/C][C]57.4098360655738[/C][C]1.88699996802690[/C][C]30.4238670049386[/C][/ROW]
[ROW][C]Winsorized Mean ( 9 / 20 )[/C][C]57.4688524590164[/C][C]1.87783525669227[/C][C]30.603777543428[/C][/ROW]
[ROW][C]Winsorized Mean ( 10 / 20 )[/C][C]57.4688524590164[/C][C]1.83271207702887[/C][C]31.3572727431267[/C][/ROW]
[ROW][C]Winsorized Mean ( 11 / 20 )[/C][C]56.6393442622951[/C][C]1.68291686460185[/C][C]33.655461807791[/C][/ROW]
[ROW][C]Winsorized Mean ( 12 / 20 )[/C][C]56.7180327868852[/C][C]1.66436208130533[/C][C]34.0779409864964[/C][/ROW]
[ROW][C]Winsorized Mean ( 13 / 20 )[/C][C]56.483606557377[/C][C]1.6182365432743[/C][C]34.9044191296592[/C][/ROW]
[ROW][C]Winsorized Mean ( 14 / 20 )[/C][C]56.6213114754098[/C][C]1.59717666670510[/C][C]35.4508756956843[/C][/ROW]
[ROW][C]Winsorized Mean ( 15 / 20 )[/C][C]56.6704918032787[/C][C]1.55099006677208[/C][C]36.5382686951834[/C][/ROW]
[ROW][C]Winsorized Mean ( 16 / 20 )[/C][C]56.8016393442623[/C][C]1.46648997657128[/C][C]38.733056653457[/C][/ROW]
[ROW][C]Winsorized Mean ( 17 / 20 )[/C][C]56.8573770491803[/C][C]1.43282833717282[/C][C]39.6819183248206[/C][/ROW]
[ROW][C]Winsorized Mean ( 18 / 20 )[/C][C]56.444262295082[/C][C]1.32152115653113[/C][C]42.7115843103436[/C][/ROW]
[ROW][C]Winsorized Mean ( 19 / 20 )[/C][C]56.4754098360656[/C][C]1.21467046901350[/C][C]46.4944289638756[/C][/ROW]
[ROW][C]Winsorized Mean ( 20 / 20 )[/C][C]56.1475409836066[/C][C]1.13476028752755[/C][C]49.4796492270122[/C][/ROW]
[ROW][C]Trimmed Mean ( 1 / 20 )[/C][C]58.9305084745763[/C][C]2.52444652171774[/C][C]23.343932211516[/C][/ROW]
[ROW][C]Trimmed Mean ( 2 / 20 )[/C][C]58.0666666666667[/C][C]2.22756474542739[/C][C]26.0673306066018[/C][/ROW]
[ROW][C]Trimmed Mean ( 3 / 20 )[/C][C]57.4927272727273[/C][C]2.04426248840950[/C][C]28.1239457255112[/C][/ROW]
[ROW][C]Trimmed Mean ( 4 / 20 )[/C][C]57.3037735849057[/C][C]2.00132750258399[/C][C]28.6328816802441[/C][/ROW]
[ROW][C]Trimmed Mean ( 5 / 20 )[/C][C]57.121568627451[/C][C]1.95425792290054[/C][C]29.2292884977385[/C][/ROW]
[ROW][C]Trimmed Mean ( 6 / 20 )[/C][C]56.9428571428571[/C][C]1.90411968339899[/C][C]29.9050829836547[/C][/ROW]
[ROW][C]Trimmed Mean ( 7 / 20 )[/C][C]56.8255319148936[/C][C]1.87438665413167[/C][C]30.3168675415151[/C][/ROW]
[ROW][C]Trimmed Mean ( 8 / 20 )[/C][C]56.6844444444444[/C][C]1.83967760558212[/C][C]30.8121620181967[/C][/ROW]
[ROW][C]Trimmed Mean ( 9 / 20 )[/C][C]56.5558139534884[/C][C]1.80822013258960[/C][C]31.2770624185526[/C][/ROW]
[ROW][C]Trimmed Mean ( 10 / 20 )[/C][C]56.4048780487805[/C][C]1.76699397220221[/C][C]31.9213754750295[/C][/ROW]
[ROW][C]Trimmed Mean ( 11 / 20 )[/C][C]56.2384615384615[/C][C]1.72213741978969[/C][C]32.6561985659249[/C][/ROW]
[ROW][C]Trimmed Mean ( 12 / 20 )[/C][C]56.1783783783784[/C][C]1.70043332728089[/C][C]33.0376836757319[/C][/ROW]
[ROW][C]Trimmed Mean ( 13 / 20 )[/C][C]56.1[/C][C]1.67176754445380[/C][C]33.5572969974896[/C][/ROW]
[ROW][C]Trimmed Mean ( 14 / 20 )[/C][C]56.0454545454545[/C][C]1.64097676768019[/C][C]34.1537160362634[/C][/ROW]
[ROW][C]Trimmed Mean ( 15 / 20 )[/C][C]55.9645161290323[/C][C]1.59911634460832[/C][C]34.9971509688621[/C][/ROW]
[ROW][C]Trimmed Mean ( 16 / 20 )[/C][C]55.8655172413793[/C][C]1.54865487368392[/C][C]36.0735746812892[/C][/ROW]
[ROW][C]Trimmed Mean ( 17 / 20 )[/C][C]55.7333333333333[/C][C]1.49710071181285[/C][C]37.2275110776251[/C][/ROW]
[ROW][C]Trimmed Mean ( 18 / 20 )[/C][C]55.572[/C][C]1.42523120931307[/C][C]38.9915682710768[/C][/ROW]
[ROW][C]Trimmed Mean ( 19 / 20 )[/C][C]55.4434782608696[/C][C]1.35455352805048[/C][C]40.9311829416336[/C][/ROW]
[ROW][C]Trimmed Mean ( 20 / 20 )[/C][C]55.2857142857143[/C][C]1.28092759756517[/C][C]43.16068635792[/C][/ROW]
[ROW][C]Median[/C][C]54.5[/C][C][/C][C][/C][/ROW]
[ROW][C]Midrange[/C][C]86.95[/C][C][/C][C][/C][/ROW]
[ROW][C]Midmean - Weighted Average at Xnp[/C][C]55.43[/C][C][/C][C][/C][/ROW]
[ROW][C]Midmean - Weighted Average at X(n+1)p[/C][C]55.9645161290323[/C][C][/C][C][/C][/ROW]
[ROW][C]Midmean - Empirical Distribution Function[/C][C]55.9645161290323[/C][C][/C][C][/C][/ROW]
[ROW][C]Midmean - Empirical Distribution Function - Averaging[/C][C]55.9645161290323[/C][C][/C][C][/C][/ROW]
[ROW][C]Midmean - Empirical Distribution Function - Interpolation[/C][C]55.9645161290323[/C][C][/C][C][/C][/ROW]
[ROW][C]Midmean - Closest Observation[/C][C]55.53125[/C][C][/C][C][/C][/ROW]
[ROW][C]Midmean - True Basic - Statistics Graphics Toolkit[/C][C]55.9645161290323[/C][C][/C][C][/C][/ROW]
[ROW][C]Midmean - MS Excel (old versions)[/C][C]55.9645161290323[/C][C][/C][C][/C][/ROW]
[ROW][C]Number of observations[/C][C]61[/C][C][/C][C][/C][/ROW]
[/TABLE]
Source: https://freestatistics.org/blog/index.php?pk=17224&T=1

Globally Unique Identifier (entire table): ba.freestatistics.org/blog/index.php?pk=17224&T=1

As an alternative you can also use a QR Code:  

The GUIDs for individual cells are displayed in the table below:

Central Tendency - Ungrouped Data
MeasureValueS.E.Value/S.E.
Arithmetic Mean59.84918032786892.8716977927431720.8410440956248
Geometric Mean56.4524800704516
Harmonic Mean53.5884811561598
Quadratic Mean63.8492230077119
Winsorized Mean ( 1 / 20 )59.73770491803282.7507834591232221.7166148501829
Winsorized Mean ( 2 / 20 )59.10163934426232.4844681367291323.7884473020738
Winsorized Mean ( 3 / 20 )57.98524590163932.1239099886065327.3011785869903
Winsorized Mean ( 4 / 20 )57.91311475409842.1044260869047027.5196715695918
Winsorized Mean ( 5 / 20 )57.83934426229512.0747931343173827.8771619712944
Winsorized Mean ( 6 / 20 )57.48524590163931.9625159998172429.2916062376015
Winsorized Mean ( 7 / 20 )57.55409836065571.9431715579597929.6186397566893
Winsorized Mean ( 8 / 20 )57.40983606557381.8869999680269030.4238670049386
Winsorized Mean ( 9 / 20 )57.46885245901641.8778352566922730.603777543428
Winsorized Mean ( 10 / 20 )57.46885245901641.8327120770288731.3572727431267
Winsorized Mean ( 11 / 20 )56.63934426229511.6829168646018533.655461807791
Winsorized Mean ( 12 / 20 )56.71803278688521.6643620813053334.0779409864964
Winsorized Mean ( 13 / 20 )56.4836065573771.618236543274334.9044191296592
Winsorized Mean ( 14 / 20 )56.62131147540981.5971766667051035.4508756956843
Winsorized Mean ( 15 / 20 )56.67049180327871.5509900667720836.5382686951834
Winsorized Mean ( 16 / 20 )56.80163934426231.4664899765712838.733056653457
Winsorized Mean ( 17 / 20 )56.85737704918031.4328283371728239.6819183248206
Winsorized Mean ( 18 / 20 )56.4442622950821.3215211565311342.7115843103436
Winsorized Mean ( 19 / 20 )56.47540983606561.2146704690135046.4944289638756
Winsorized Mean ( 20 / 20 )56.14754098360661.1347602875275549.4796492270122
Trimmed Mean ( 1 / 20 )58.93050847457632.5244465217177423.343932211516
Trimmed Mean ( 2 / 20 )58.06666666666672.2275647454273926.0673306066018
Trimmed Mean ( 3 / 20 )57.49272727272732.0442624884095028.1239457255112
Trimmed Mean ( 4 / 20 )57.30377358490572.0013275025839928.6328816802441
Trimmed Mean ( 5 / 20 )57.1215686274511.9542579229005429.2292884977385
Trimmed Mean ( 6 / 20 )56.94285714285711.9041196833989929.9050829836547
Trimmed Mean ( 7 / 20 )56.82553191489361.8743866541316730.3168675415151
Trimmed Mean ( 8 / 20 )56.68444444444441.8396776055821230.8121620181967
Trimmed Mean ( 9 / 20 )56.55581395348841.8082201325896031.2770624185526
Trimmed Mean ( 10 / 20 )56.40487804878051.7669939722022131.9213754750295
Trimmed Mean ( 11 / 20 )56.23846153846151.7221374197896932.6561985659249
Trimmed Mean ( 12 / 20 )56.17837837837841.7004333272808933.0376836757319
Trimmed Mean ( 13 / 20 )56.11.6717675444538033.5572969974896
Trimmed Mean ( 14 / 20 )56.04545454545451.6409767676801934.1537160362634
Trimmed Mean ( 15 / 20 )55.96451612903231.5991163446083234.9971509688621
Trimmed Mean ( 16 / 20 )55.86551724137931.5486548736839236.0735746812892
Trimmed Mean ( 17 / 20 )55.73333333333331.4971007118128537.2275110776251
Trimmed Mean ( 18 / 20 )55.5721.4252312093130738.9915682710768
Trimmed Mean ( 19 / 20 )55.44347826086961.3545535280504840.9311829416336
Trimmed Mean ( 20 / 20 )55.28571428571431.2809275975651743.16068635792
Median54.5
Midrange86.95
Midmean - Weighted Average at Xnp55.43
Midmean - Weighted Average at X(n+1)p55.9645161290323
Midmean - Empirical Distribution Function55.9645161290323
Midmean - Empirical Distribution Function - Averaging55.9645161290323
Midmean - Empirical Distribution Function - Interpolation55.9645161290323
Midmean - Closest Observation55.53125
Midmean - True Basic - Statistics Graphics Toolkit55.9645161290323
Midmean - MS Excel (old versions)55.9645161290323
Number of observations61


Parameters (Session):
Parameters (R input):
R code (references can be found in the software module):
geomean <- function(x) {
return(exp(mean(log(x))))
}
harmean <- function(x) {
return(1/mean(1/x))
}
quamean <- function(x) {
return(sqrt(mean(x*x)))
}
winmean <- function(x) {
x <-sort(x[!is.na(x)])
n<-length(x)
denom <- 3
nodenom <- n/denom
if (nodenom>40) denom <- n/40
sqrtn = sqrt(n)
roundnodenom = floor(nodenom)
win <- array(NA,dim=c(roundnodenom,2))
for (j in 1:roundnodenom) {
win[j,1] <- (j*x[j+1]+sum(x[(j+1):(n-j)])+j*x[n-j])/n
win[j,2] <- sd(c(rep(x[j+1],j),x[(j+1):(n-j)],rep(x[n-j],j)))/sqrtn
}
return(win)
}
trimean <- function(x) {
x <-sort(x[!is.na(x)])
n<-length(x)
denom <- 3
nodenom <- n/denom
if (nodenom>40) denom <- n/40
sqrtn = sqrt(n)
roundnodenom = floor(nodenom)
tri <- array(NA,dim=c(roundnodenom,2))
for (j in 1:roundnodenom) {
tri[j,1] <- mean(x,trim=j/n)
tri[j,2] <- sd(x[(j+1):(n-j)]) / sqrt(n-j*2)
}
return(tri)
}
midrange <- function(x) {
return((max(x)+min(x))/2)
}
q1 <- function(data,n,p,i,f) {
np <- n*p;
i <<- floor(np)
f <<- np - i
qvalue <- (1-f)*data[i] + f*data[i+1]
}
q2 <- function(data,n,p,i,f) {
np <- (n+1)*p
i <<- floor(np)
f <<- np - i
qvalue <- (1-f)*data[i] + f*data[i+1]
}
q3 <- function(data,n,p,i,f) {
np <- n*p
i <<- floor(np)
f <<- np - i
if (f==0) {
qvalue <- data[i]
} else {
qvalue <- data[i+1]
}
}
q4 <- function(data,n,p,i,f) {
np <- n*p
i <<- floor(np)
f <<- np - i
if (f==0) {
qvalue <- (data[i]+data[i+1])/2
} else {
qvalue <- data[i+1]
}
}
q5 <- function(data,n,p,i,f) {
np <- (n-1)*p
i <<- floor(np)
f <<- np - i
if (f==0) {
qvalue <- data[i+1]
} else {
qvalue <- data[i+1] + f*(data[i+2]-data[i+1])
}
}
q6 <- function(data,n,p,i,f) {
np <- n*p+0.5
i <<- floor(np)
f <<- np - i
qvalue <- data[i]
}
q7 <- function(data,n,p,i,f) {
np <- (n+1)*p
i <<- floor(np)
f <<- np - i
if (f==0) {
qvalue <- data[i]
} else {
qvalue <- f*data[i] + (1-f)*data[i+1]
}
}
q8 <- function(data,n,p,i,f) {
np <- (n+1)*p
i <<- floor(np)
f <<- np - i
if (f==0) {
qvalue <- data[i]
} else {
if (f == 0.5) {
qvalue <- (data[i]+data[i+1])/2
} else {
if (f < 0.5) {
qvalue <- data[i]
} else {
qvalue <- data[i+1]
}
}
}
}
midmean <- function(x,def) {
x <-sort(x[!is.na(x)])
n<-length(x)
if (def==1) {
qvalue1 <- q1(x,n,0.25,i,f)
qvalue3 <- q1(x,n,0.75,i,f)
}
if (def==2) {
qvalue1 <- q2(x,n,0.25,i,f)
qvalue3 <- q2(x,n,0.75,i,f)
}
if (def==3) {
qvalue1 <- q3(x,n,0.25,i,f)
qvalue3 <- q3(x,n,0.75,i,f)
}
if (def==4) {
qvalue1 <- q4(x,n,0.25,i,f)
qvalue3 <- q4(x,n,0.75,i,f)
}
if (def==5) {
qvalue1 <- q5(x,n,0.25,i,f)
qvalue3 <- q5(x,n,0.75,i,f)
}
if (def==6) {
qvalue1 <- q6(x,n,0.25,i,f)
qvalue3 <- q6(x,n,0.75,i,f)
}
if (def==7) {
qvalue1 <- q7(x,n,0.25,i,f)
qvalue3 <- q7(x,n,0.75,i,f)
}
if (def==8) {
qvalue1 <- q8(x,n,0.25,i,f)
qvalue3 <- q8(x,n,0.75,i,f)
}
midm <- 0
myn <- 0
roundno4 <- round(n/4)
round3no4 <- round(3*n/4)
for (i in 1:n) {
if ((x[i]>=qvalue1) & (x[i]<=qvalue3)){
midm = midm + x[i]
myn = myn + 1
}
}
midm = midm / myn
return(midm)
}
(arm <- mean(x))
sqrtn <- sqrt(length(x))
(armse <- sd(x) / sqrtn)
(armose <- arm / armse)
(geo <- geomean(x))
(har <- harmean(x))
(qua <- quamean(x))
(win <- winmean(x))
(tri <- trimean(x))
(midr <- midrange(x))
midm <- array(NA,dim=8)
for (j in 1:8) midm[j] <- midmean(x,j)
midm
bitmap(file='test1.png')
lb <- win[,1] - 2*win[,2]
ub <- win[,1] + 2*win[,2]
if ((ylimmin == '') | (ylimmax == '')) plot(win[,1],type='b',main=main, xlab='j', pch=19, ylab='Winsorized Mean(j/n)', ylim=c(min(lb),max(ub))) else plot(win[,1],type='l',main=main, xlab='j', pch=19, ylab='Winsorized Mean(j/n)', ylim=c(ylimmin,ylimmax))
lines(ub,lty=3)
lines(lb,lty=3)
grid()
dev.off()
bitmap(file='test2.png')
lb <- tri[,1] - 2*tri[,2]
ub <- tri[,1] + 2*tri[,2]
if ((ylimmin == '') | (ylimmax == '')) plot(tri[,1],type='b',main=main, xlab='j', pch=19, ylab='Trimmed Mean(j/n)', ylim=c(min(lb),max(ub))) else plot(tri[,1],type='l',main=main, xlab='j', pch=19, ylab='Trimmed Mean(j/n)', ylim=c(ylimmin,ylimmax))
lines(ub,lty=3)
lines(lb,lty=3)
grid()
dev.off()
load(file='createtable')
a<-table.start()
a<-table.row.start(a)
a<-table.element(a,'Central Tendency - Ungrouped Data',4,TRUE)
a<-table.row.end(a)
a<-table.row.start(a)
a<-table.element(a,'Measure',header=TRUE)
a<-table.element(a,'Value',header=TRUE)
a<-table.element(a,'S.E.',header=TRUE)
a<-table.element(a,'Value/S.E.',header=TRUE)
a<-table.row.end(a)
a<-table.row.start(a)
a<-table.element(a,hyperlink('arithmetic_mean.htm', 'Arithmetic Mean', 'click to view the definition of the Arithmetic Mean'),header=TRUE)
a<-table.element(a,arm)
a<-table.element(a,hyperlink('arithmetic_mean_standard_error.htm', armse, 'click to view the definition of the Standard Error of the Arithmetic Mean'))
a<-table.element(a,armose)
a<-table.row.end(a)
a<-table.row.start(a)
a<-table.element(a,hyperlink('geometric_mean.htm', 'Geometric Mean', 'click to view the definition of the Geometric Mean'),header=TRUE)
a<-table.element(a,geo)
a<-table.element(a,'')
a<-table.row.end(a)
a<-table.row.start(a)
a<-table.element(a,hyperlink('harmonic_mean.htm', 'Harmonic Mean', 'click to view the definition of the Harmonic Mean'),header=TRUE)
a<-table.element(a,har)
a<-table.element(a,'')
a<-table.row.end(a)
a<-table.row.start(a)
a<-table.element(a,hyperlink('quadratic_mean.htm', 'Quadratic Mean', 'click to view the definition of the Quadratic Mean'),header=TRUE)
a<-table.element(a,qua)
a<-table.element(a,'')
a<-table.row.end(a)
for (j in 1:length(win[,1])) {
a<-table.row.start(a)
mylabel <- paste('Winsorized Mean (',j)
mylabel <- paste(mylabel,'/')
mylabel <- paste(mylabel,length(win[,1]))
mylabel <- paste(mylabel,')')
a<-table.element(a,hyperlink('winsorized_mean.htm', mylabel, 'click to view the definition of the Winsorized Mean'),header=TRUE)
a<-table.element(a,win[j,1])
a<-table.element(a,win[j,2])
a<-table.element(a,win[j,1]/win[j,2])
a<-table.row.end(a)
}
for (j in 1:length(tri[,1])) {
a<-table.row.start(a)
mylabel <- paste('Trimmed Mean (',j)
mylabel <- paste(mylabel,'/')
mylabel <- paste(mylabel,length(tri[,1]))
mylabel <- paste(mylabel,')')
a<-table.element(a,hyperlink('arithmetic_mean.htm', mylabel, 'click to view the definition of the Trimmed Mean'),header=TRUE)
a<-table.element(a,tri[j,1])
a<-table.element(a,tri[j,2])
a<-table.element(a,tri[j,1]/tri[j,2])
a<-table.row.end(a)
}
a<-table.row.start(a)
a<-table.element(a,hyperlink('median_1.htm', 'Median', 'click to view the definition of the Median'),header=TRUE)
a<-table.element(a,median(x))
a<-table.element(a,'')
a<-table.row.end(a)
a<-table.row.start(a)
a<-table.element(a,hyperlink('midrange.htm', 'Midrange', 'click to view the definition of the Midrange'),header=TRUE)
a<-table.element(a,midr)
a<-table.element(a,'')
a<-table.row.end(a)
a<-table.row.start(a)
mymid <- hyperlink('midmean.htm', 'Midmean', 'click to view the definition of the Midmean')
mylabel <- paste(mymid,hyperlink('method_1.htm','Weighted Average at Xnp',''),sep=' - ')
a<-table.element(a,mylabel,header=TRUE)
a<-table.element(a,midm[1])
a<-table.element(a,'')
a<-table.row.end(a)
a<-table.row.start(a)
mymid <- hyperlink('midmean.htm', 'Midmean', 'click to view the definition of the Midmean')
mylabel <- paste(mymid,hyperlink('method_2.htm','Weighted Average at X(n+1)p',''),sep=' - ')
a<-table.element(a,mylabel,header=TRUE)
a<-table.element(a,midm[2])
a<-table.element(a,'')
a<-table.row.end(a)
a<-table.row.start(a)
mymid <- hyperlink('midmean.htm', 'Midmean', 'click to view the definition of the Midmean')
mylabel <- paste(mymid,hyperlink('method_3.htm','Empirical Distribution Function',''),sep=' - ')
a<-table.element(a,mylabel,header=TRUE)
a<-table.element(a,midm[3])
a<-table.element(a,'')
a<-table.row.end(a)
a<-table.row.start(a)
mymid <- hyperlink('midmean.htm', 'Midmean', 'click to view the definition of the Midmean')
mylabel <- paste(mymid,hyperlink('method_4.htm','Empirical Distribution Function - Averaging',''),sep=' - ')
a<-table.element(a,mylabel,header=TRUE)
a<-table.element(a,midm[4])
a<-table.element(a,'')
a<-table.row.end(a)
a<-table.row.start(a)
mymid <- hyperlink('midmean.htm', 'Midmean', 'click to view the definition of the Midmean')
mylabel <- paste(mymid,hyperlink('method_5.htm','Empirical Distribution Function - Interpolation',''),sep=' - ')
a<-table.element(a,mylabel,header=TRUE)
a<-table.element(a,midm[5])
a<-table.element(a,'')
a<-table.row.end(a)
a<-table.row.start(a)
mymid <- hyperlink('midmean.htm', 'Midmean', 'click to view the definition of the Midmean')
mylabel <- paste(mymid,hyperlink('method_6.htm','Closest Observation',''),sep=' - ')
a<-table.element(a,mylabel,header=TRUE)
a<-table.element(a,midm[6])
a<-table.element(a,'')
a<-table.row.end(a)
a<-table.row.start(a)
mymid <- hyperlink('midmean.htm', 'Midmean', 'click to view the definition of the Midmean')
mylabel <- paste(mymid,hyperlink('method_7.htm','True Basic - Statistics Graphics Toolkit',''),sep=' - ')
a<-table.element(a,mylabel,header=TRUE)
a<-table.element(a,midm[7])
a<-table.element(a,'')
a<-table.row.end(a)
a<-table.row.start(a)
mymid <- hyperlink('midmean.htm', 'Midmean', 'click to view the definition of the Midmean')
mylabel <- paste(mymid,hyperlink('method_8.htm','MS Excel (old versions)',''),sep=' - ')
a<-table.element(a,mylabel,header=TRUE)
a<-table.element(a,midm[8])
a<-table.element(a,'')
a<-table.row.end(a)
a<-table.row.start(a)
a<-table.element(a,'Number of observations',header=TRUE)
a<-table.element(a,length(x))
a<-table.element(a,'')
a<-table.row.end(a)
a<-table.end(a)
table.save(a,file='mytable.tab')