Free Statistics
of Irreproducible Research!
Description of Statistical Computation | |||||||||||||||||||||||||||||||||||||||||
|---|---|---|---|---|---|---|---|---|---|---|---|---|---|---|---|---|---|---|---|---|---|---|---|---|---|---|---|---|---|---|---|---|---|---|---|---|---|---|---|---|---|
| Author's title | |||||||||||||||||||||||||||||||||||||||||
| Author | *The author of this computation has been verified* | ||||||||||||||||||||||||||||||||||||||||
| R Software Module | rwasp_univariatedataseries.wasp | ||||||||||||||||||||||||||||||||||||||||
| Title produced by software | Univariate Data Series | ||||||||||||||||||||||||||||||||||||||||
| Date of computation | Sun, 19 Oct 2008 23:47:20 -0600 | ||||||||||||||||||||||||||||||||||||||||
| Cite this page as follows | Statistical Computations at FreeStatistics.org, Office for Research Development and Education, URL https://freestatistics.org/blog/index.php?v=date/2008/Oct/20/t1224481689jftgwl3juiqw31y.htm/, Retrieved Sun, 19 May 2024 16:10:27 +0000 | ||||||||||||||||||||||||||||||||||||||||
| Statistical Computations at FreeStatistics.org, Office for Research Development and Education, URL https://freestatistics.org/blog/index.php?pk=17143, Retrieved Sun, 19 May 2024 16:10:27 +0000 | |||||||||||||||||||||||||||||||||||||||||
| QR Codes: | |||||||||||||||||||||||||||||||||||||||||
|
| |||||||||||||||||||||||||||||||||||||||||
| Original text written by user: | |||||||||||||||||||||||||||||||||||||||||
| IsPrivate? | No (this computation is public) | ||||||||||||||||||||||||||||||||||||||||
| User-defined keywords | |||||||||||||||||||||||||||||||||||||||||
| Estimated Impact | 176 | ||||||||||||||||||||||||||||||||||||||||
Tree of Dependent Computations | |||||||||||||||||||||||||||||||||||||||||
| Family? (F = Feedback message, R = changed R code, M = changed R Module, P = changed Parameters, D = changed Data) | |||||||||||||||||||||||||||||||||||||||||
| F [Univariate Data Series] [Industri�le produ...] [2008-10-13 18:29:40] [6743688719638b0cb1c0a6e0bf433315] - PD [Univariate Data Series] [Reeks 4 Productie...] [2008-10-20 05:47:20] [9b05d7ef5dbcfba4217d280d9092f628] [Current] - RMPD [Central Tendency] [Central tendency ...] [2008-10-20 15:52:55] [6743688719638b0cb1c0a6e0bf433315] | |||||||||||||||||||||||||||||||||||||||||
| Feedback Forum | |||||||||||||||||||||||||||||||||||||||||
Post a new message | |||||||||||||||||||||||||||||||||||||||||
Dataset | |||||||||||||||||||||||||||||||||||||||||
| Dataseries X: | |||||||||||||||||||||||||||||||||||||||||
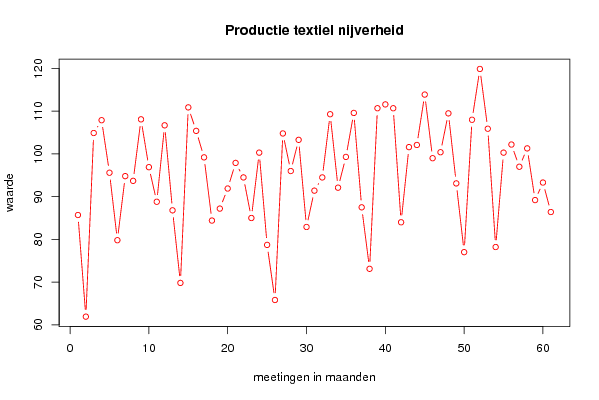
85,7 61,9 104,9 107,9 95,6 79,8 94,8 93,7 108,1 96,9 88,8 106,7 86,8 69,8 110,9 105,4 99,2 84,4 87,2 91,9 97,9 94,5 85 100,3 78,7 65,8 104,8 96 103,3 82,9 91,4 94,5 109,3 92,1 99,3 109,6 87,5 73,1 110,7 111,6 110,7 84 101,6 102,1 113,9 99 100,4 109,5 93,1 77 108 119,9 105,9 78,2 100,3 102,2 97 101,3 89,2 93,3 86,4 | |||||||||||||||||||||||||||||||||||||||||
Tables (Output of Computation) | |||||||||||||||||||||||||||||||||||||||||
| |||||||||||||||||||||||||||||||||||||||||
Figures (Output of Computation) | |||||||||||||||||||||||||||||||||||||||||
Input Parameters & R Code | |||||||||||||||||||||||||||||||||||||||||
| Parameters (Session): | |||||||||||||||||||||||||||||||||||||||||
| par1 = Industri�le productie in de textiel nijverheid ; par2 = http://www.nbb.be/belgostat/PresentationLinker?TableId=841000033&Lang=N ; par3 = Industri�le productie in de textiel nijverheid ; | |||||||||||||||||||||||||||||||||||||||||
| Parameters (R input): | |||||||||||||||||||||||||||||||||||||||||
| par1 = Industri�le productie in de textiel nijverheid ; par2 = http://www.nbb.be/belgostat/PresentationLinker?TableId=841000033&Lang=N ; par3 = Industri�le productie in de textiel nijverheid ; | |||||||||||||||||||||||||||||||||||||||||
| R code (references can be found in the software module): | |||||||||||||||||||||||||||||||||||||||||
bitmap(file='test1.png') | |||||||||||||||||||||||||||||||||||||||||