Free Statistics

of Irreproducible Research!

Author's title

Author*Unverified author*
R Software Modulerwasp_correlation.wasp
Title produced by softwarePearson Correlation
Date of computationSun, 19 Oct 2008 16:38:28 -0600
Cite this page as followsStatistical Computations at FreeStatistics.org, Office for Research Development and Education, URL https://freestatistics.org/blog/index.php?v=date/2008/Oct/20/t1224455990ze2mgx9wu3bc9ar.htm/, Retrieved Sun, 19 May 2024 13:55:00 +0000
Statistical Computations at FreeStatistics.org, Office for Research Development and Education, URL https://freestatistics.org/blog/index.php?pk=17114, Retrieved Sun, 19 May 2024 13:55:00 +0000
QR Codes:

Original text written by user:
IsPrivate?No (this computation is public)
User-defined keywords
Estimated Impact179
Family? (F = Feedback message, R = changed R code, M = changed R Module, P = changed Parameters, D = changed Data)
F       [Pearson Correlation] [Pearson correlati...] [2008-10-19 22:38:28] [e81ac192d6ae6d77191d83851a692999] [Current]
-    D    [Pearson Correlation] [Q5 Outliers wegge...] [2008-10-23 13:24:18] [73d6180dc45497329efd1b6934a84aba]
Feedback Forum
2008-10-23 13:36:00 [Gregory Van Overmeiren] [reply
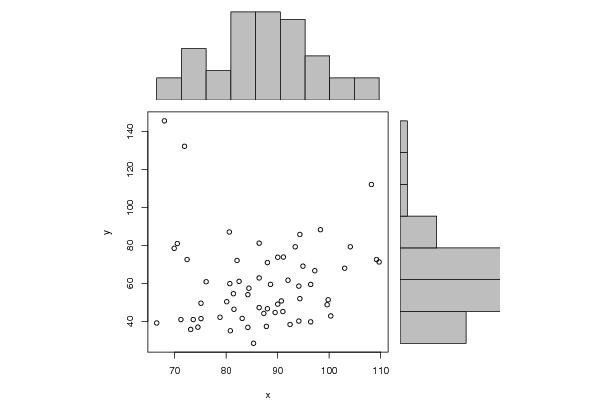
Als we de chart bekijken krijgen we een vertekend beeld te zien. Dit komt door die twee ouliers die zich links vanboven bevinden. Dit zijn namelijk de waarden 132.10 en 145.50 in de y-reeks. Als we bijvoorbeeld deze 2 outliers vervangen door het gemiddelde (mean) van datareeks Y (= 59.85) dan krijgen we een beter beeld van de correlatie ( http://www.freestatistics.org/blog/index.php?v=date/2008/Oct/23/t1224768452n0vjyuwpiz0wklm.htm )

Opvallend is dat, door dit te doen, onze correlatie gestegen is van 0.0425212799870432 naar 0.307758662640054
De gevonden (nieuwe) correlatie blijft zwak maar is al een pak sterker geworden tov het eerste gevonden resultaat!
2008-10-24 11:56:41 [Kim Wester] [reply
Hier wilde ik ook het verhaal omtrent de twee outliers in de linker bovenhoek vermelden. En dat bij verwijdering van deze twee outliers de correlatie zou stijgen. Echter, hier bent u zelf al mee gekomen. Deze bevinding en die uit het Word-document maken het antwoord op de vraag compleet.

Post a new message
Dataseries X:
109,20
88,60
94,30
98,30
86,40
80,60
104,10
108,20
93,40
71,90
94,10
94,90
96,40
91,10
84,40
86,40
88,00
75,10
109,70
103,00
82,10
68,00
96,40
94,30
90,00
88,00
76,10
82,50
81,40
66,50
97,20
94,10
80,70
70,50
87,80
89,50
99,60
84,20
75,10
92,00
80,80
73,10
99,80
90,00
83,10
72,40
78,80
87,30
91,00
80,10
73,60
86,40
74,50
71,20
92,40
81,50
85,30
69,90
84,20
90,70
100,30
Dataseries Y:
72,50
59,40
85,70
88,20
62,80
87,00
79,20
112,00
79,20
132,10
40,10
69,00
59,40
73,80
57,40
81,10
46,60
41,40
71,20
67,90
72,00
145,50
39,70
51,90
73,70
70,90
60,80
61,00
54,50
39,10
66,60
58,50
59,80
80,90
37,30
44,60
48,70
54,00
49,50
61,60
35,00
35,70
51,30
49,00
41,50
72,50
42,10
44,10
45,10
50,30
40,90
47,20
36,90
40,90
38,30
46,30
28,40
78,40
36,80
50,70
42,80


Summary of computational transaction
Raw Inputview raw input (R code)
Raw Outputview raw output of R engine
Computing time2 seconds
R Server'Gwilym Jenkins' @ 72.249.127.135

\begin{tabular}{lllllllll}
\hline
Summary of computational transaction \tabularnewline
Raw Input & view raw input (R code)  \tabularnewline
Raw Output & view raw output of R engine  \tabularnewline
Computing time & 2 seconds \tabularnewline
R Server & 'Gwilym Jenkins' @ 72.249.127.135 \tabularnewline
\hline
\end{tabular}
%Source: https://freestatistics.org/blog/index.php?pk=17114&T=0

[TABLE]
[ROW][C]Summary of computational transaction[/C][/ROW]
[ROW][C]Raw Input[/C][C]view raw input (R code) [/C][/ROW]
[ROW][C]Raw Output[/C][C]view raw output of R engine [/C][/ROW]
[ROW][C]Computing time[/C][C]2 seconds[/C][/ROW]
[ROW][C]R Server[/C][C]'Gwilym Jenkins' @ 72.249.127.135[/C][/ROW]
[/TABLE]
Source: https://freestatistics.org/blog/index.php?pk=17114&T=0

Globally Unique Identifier (entire table): ba.freestatistics.org/blog/index.php?pk=17114&T=0

As an alternative you can also use a QR Code:  

The GUIDs for individual cells are displayed in the table below:

Summary of computational transaction
Raw Inputview raw input (R code)
Raw Outputview raw output of R engine
Computing time2 seconds
R Server'Gwilym Jenkins' @ 72.249.127.135


Pearson Product Moment Correlation - Ungrouped Data
StatisticVariable XVariable Y
Mean86.893442622950859.8491803278689
Biased Variance109.891760279495494.798892770761
Biased Standard Deviation10.482927085480222.2440754532698
Covariance10.0804945355191
Correlation0.0425212799870432
Determination0.00180805925173652
T-Test0.326907817024733
p-value (2 sided)0.744894582950823
p-value (1 sided)0.372447291475412
Degrees of Freedom59
Number of Observations61

\begin{tabular}{lllllllll}
\hline
Pearson Product Moment Correlation - Ungrouped Data \tabularnewline
Statistic & Variable X & Variable Y \tabularnewline
Mean & 86.8934426229508 & 59.8491803278689 \tabularnewline
Biased Variance & 109.891760279495 & 494.798892770761 \tabularnewline
Biased Standard Deviation & 10.4829270854802 & 22.2440754532698 \tabularnewline
Covariance & 10.0804945355191 \tabularnewline
Correlation & 0.0425212799870432 \tabularnewline
Determination & 0.00180805925173652 \tabularnewline
T-Test & 0.326907817024733 \tabularnewline
p-value (2 sided) & 0.744894582950823 \tabularnewline
p-value (1 sided) & 0.372447291475412 \tabularnewline
Degrees of Freedom & 59 \tabularnewline
Number of Observations & 61 \tabularnewline
\hline
\end{tabular}
%Source: https://freestatistics.org/blog/index.php?pk=17114&T=1

[TABLE]
[ROW][C]Pearson Product Moment Correlation - Ungrouped Data[/C][/ROW]
[ROW][C]Statistic[/C][C]Variable X[/C][C]Variable Y[/C][/ROW]
[ROW][C]Mean[/C][C]86.8934426229508[/C][C]59.8491803278689[/C][/ROW]
[ROW][C]Biased Variance[/C][C]109.891760279495[/C][C]494.798892770761[/C][/ROW]
[ROW][C]Biased Standard Deviation[/C][C]10.4829270854802[/C][C]22.2440754532698[/C][/ROW]
[ROW][C]Covariance[/C][C]10.0804945355191[/C][/ROW]
[ROW][C]Correlation[/C][C]0.0425212799870432[/C][/ROW]
[ROW][C]Determination[/C][C]0.00180805925173652[/C][/ROW]
[ROW][C]T-Test[/C][C]0.326907817024733[/C][/ROW]
[ROW][C]p-value (2 sided)[/C][C]0.744894582950823[/C][/ROW]
[ROW][C]p-value (1 sided)[/C][C]0.372447291475412[/C][/ROW]
[ROW][C]Degrees of Freedom[/C][C]59[/C][/ROW]
[ROW][C]Number of Observations[/C][C]61[/C][/ROW]
[/TABLE]
Source: https://freestatistics.org/blog/index.php?pk=17114&T=1

Globally Unique Identifier (entire table): ba.freestatistics.org/blog/index.php?pk=17114&T=1

As an alternative you can also use a QR Code:  

The GUIDs for individual cells are displayed in the table below:

Pearson Product Moment Correlation - Ungrouped Data
StatisticVariable XVariable Y
Mean86.893442622950859.8491803278689
Biased Variance109.891760279495494.798892770761
Biased Standard Deviation10.482927085480222.2440754532698
Covariance10.0804945355191
Correlation0.0425212799870432
Determination0.00180805925173652
T-Test0.326907817024733
p-value (2 sided)0.744894582950823
p-value (1 sided)0.372447291475412
Degrees of Freedom59
Number of Observations61


Parameters (Session):
Parameters (R input):
R code (references can be found in the software module):
bitmap(file='test1.png')
histx <- hist(x, plot=FALSE)
histy <- hist(y, plot=FALSE)
maxcounts <- max(c(histx$counts, histx$counts))
xrange <- c(min(x),max(x))
yrange <- c(min(y),max(y))
nf <- layout(matrix(c(2,0,1,3),2,2,byrow=TRUE), c(3,1), c(1,3), TRUE)
par(mar=c(4,4,1,1))
plot(x, y, xlim=xrange, ylim=yrange, xlab=xlab, ylab=ylab)
par(mar=c(0,4,1,1))
barplot(histx$counts, axes=FALSE, ylim=c(0, maxcounts), space=0)
par(mar=c(4,0,1,1))
barplot(histy$counts, axes=FALSE, xlim=c(0, maxcounts), space=0, horiz=TRUE)
dev.off()
lx = length(x)
makebiased = (lx-1)/lx
varx = var(x)*makebiased
vary = var(y)*makebiased
corxy <- cor.test(x,y,method='pearson')
cxy <- as.matrix(corxy$estimate)[1,1]
load(file='createtable')
a<-table.start()
a<-table.row.start(a)
a<-table.element(a,'Pearson Product Moment Correlation - Ungrouped Data',3,TRUE)
a<-table.row.end(a)
a<-table.row.start(a)
a<-table.element(a,'Statistic',1,TRUE)
a<-table.element(a,'Variable X',1,TRUE)
a<-table.element(a,'Variable Y',1,TRUE)
a<-table.row.end(a)
a<-table.row.start(a)
a<-table.element(a,hyperlink('arithmetic_mean.htm','Mean',''),header=TRUE)
a<-table.element(a,mean(x))
a<-table.element(a,mean(y))
a<-table.row.end(a)
a<-table.row.start(a)
a<-table.element(a,hyperlink('biased.htm','Biased Variance',''),header=TRUE)
a<-table.element(a,varx)
a<-table.element(a,vary)
a<-table.row.end(a)
a<-table.row.start(a)
a<-table.element(a,hyperlink('biased1.htm','Biased Standard Deviation',''),header=TRUE)
a<-table.element(a,sqrt(varx))
a<-table.element(a,sqrt(vary))
a<-table.row.end(a)
a<-table.row.start(a)
a<-table.element(a,hyperlink('covariance.htm','Covariance',''),header=TRUE)
a<-table.element(a,cov(x,y),2)
a<-table.row.end(a)
a<-table.row.start(a)
a<-table.element(a,hyperlink('pearson_correlation.htm','Correlation',''),header=TRUE)
a<-table.element(a,cxy,2)
a<-table.row.end(a)
a<-table.row.start(a)
a<-table.element(a,hyperlink('coeff_of_determination.htm','Determination',''),header=TRUE)
a<-table.element(a,cxy*cxy,2)
a<-table.row.end(a)
a<-table.row.start(a)
a<-table.element(a,hyperlink('ttest_statistic.htm','T-Test',''),header=TRUE)
a<-table.element(a,as.matrix(corxy$statistic)[1,1],2)
a<-table.row.end(a)
a<-table.row.start(a)
a<-table.element(a,'p-value (2 sided)',header=TRUE)
a<-table.element(a,(p2 <- as.matrix(corxy$p.value)[1,1]),2)
a<-table.row.end(a)
a<-table.row.start(a)
a<-table.element(a,'p-value (1 sided)',header=TRUE)
a<-table.element(a,p2/2,2)
a<-table.row.end(a)
a<-table.row.start(a)
a<-table.element(a,'Degrees of Freedom',header=TRUE)
a<-table.element(a,lx-2,2)
a<-table.row.end(a)
a<-table.row.start(a)
a<-table.element(a,'Number of Observations',header=TRUE)
a<-table.element(a,lx,2)
a<-table.row.end(a)
a<-table.end(a)
table.save(a,file='mytable.tab')