Free Statistics

of Irreproducible Research!

Author's title

Author*The author of this computation has been verified*
R Software Modulerwasp_centraltendency.wasp
Title produced by softwareCentral Tendency
Date of computationSun, 19 Oct 2008 13:23:22 -0600
Cite this page as followsStatistical Computations at FreeStatistics.org, Office for Research Development and Education, URL https://freestatistics.org/blog/index.php?v=date/2008/Oct/19/t1224444243gj4vxkayy1yo88v.htm/, Retrieved Sun, 19 May 2024 16:31:53 +0000
Statistical Computations at FreeStatistics.org, Office for Research Development and Education, URL https://freestatistics.org/blog/index.php?pk=17079, Retrieved Sun, 19 May 2024 16:31:53 +0000
QR Codes:

Original text written by user:
IsPrivate?No (this computation is public)
User-defined keywords
Estimated Impact134
Family? (F = Feedback message, R = changed R code, M = changed R Module, P = changed Parameters, D = changed Data)
F     [Univariate Data Series] [blog 1e tijdreeks...] [2008-10-13 19:23:31] [7173087adebe3e3a714c80ea2417b3eb]
-   PD  [Univariate Data Series] [tijdreeksen opnie...] [2008-10-19 17:27:22] [7173087adebe3e3a714c80ea2417b3eb]
-   PD    [Univariate Data Series] [tijdreeksen opnie...] [2008-10-19 19:20:45] [7173087adebe3e3a714c80ea2417b3eb]
- RM          [Central Tendency] [central tendency ...] [2008-10-19 19:23:22] [95d95b0e883740fcbc85e18ec42dcafb] [Current]
Feedback Forum

Post a new message
Dataseries X:
1712
2641
2267
2126
2231
1517
2010
2628
2115
1829
1636
1787
2122
2620
2555
2337
2524
1801
2417
2389
2267
2135
1760
1905
2176
2344
2673
2766
2785
2003
2588
2739
2703
2464
1974
2164
2385
2936
2700
2855
2764
1808
2588
2600
2526
2259
1738
1902
2137
2460
2495
2525
2465
1828
2273
2377
2344
2071
1611
1671


Summary of computational transaction
Raw Inputview raw input (R code)
Raw Outputview raw output of R engine
Computing time1 seconds
R Server'George Udny Yule' @ 72.249.76.132

\begin{tabular}{lllllllll}
\hline
Summary of computational transaction \tabularnewline
Raw Input & view raw input (R code)  \tabularnewline
Raw Output & view raw output of R engine  \tabularnewline
Computing time & 1 seconds \tabularnewline
R Server & 'George Udny Yule' @ 72.249.76.132 \tabularnewline
\hline
\end{tabular}
%Source: https://freestatistics.org/blog/index.php?pk=17079&T=0

[TABLE]
[ROW][C]Summary of computational transaction[/C][/ROW]
[ROW][C]Raw Input[/C][C]view raw input (R code) [/C][/ROW]
[ROW][C]Raw Output[/C][C]view raw output of R engine [/C][/ROW]
[ROW][C]Computing time[/C][C]1 seconds[/C][/ROW]
[ROW][C]R Server[/C][C]'George Udny Yule' @ 72.249.76.132[/C][/ROW]
[/TABLE]
Source: https://freestatistics.org/blog/index.php?pk=17079&T=0

Globally Unique Identifier (entire table): ba.freestatistics.org/blog/index.php?pk=17079&T=0

As an alternative you can also use a QR Code:  

The GUIDs for individual cells are displayed in the table below:

Summary of computational transaction
Raw Inputview raw input (R code)
Raw Outputview raw output of R engine
Computing time1 seconds
R Server'George Udny Yule' @ 72.249.76.132


Central Tendency - Ungrouped Data
MeasureValueS.E.Value/S.E.
Arithmetic Mean2267.1333333333347.064983724973448.1702776438092
Geometric Mean2236.94317632963
Harmonic Mean2205.53667758703
Quadratic Mean2295.77551167356
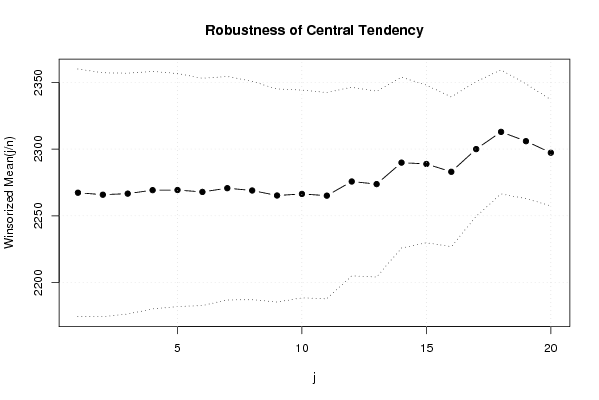
Winsorized Mean ( 1 / 20 )2267.3546.357465314612348.9101374419906
Winsorized Mean ( 2 / 20 )2265.8545.684528806986549.597753532121
Winsorized Mean ( 3 / 20 )2266.6545.103514494704450.2543986958295
Winsorized Mean ( 4 / 20 )2269.2544.482235551521251.0147471651163
Winsorized Mean ( 5 / 20 )2269.3333333333343.64216762177351.9986393205907
Winsorized Mean ( 6 / 20 )2267.9333333333342.552114054957853.2977828176575
Winsorized Mean ( 7 / 20 )2270.7333333333341.864186295232854.2404745984973
Winsorized Mean ( 8 / 20 )226940.885882248419755.4959285509291
Winsorized Mean ( 9 / 20 )2265.2539.896763847920356.777788008941
Winsorized Mean ( 10 / 20 )2266.4166666666738.911077037212158.246053289638
Winsorized Mean ( 11 / 20 )2265.1333333333338.646401274246758.6117531942821
Winsorized Mean ( 12 / 20 )2275.7333333333335.314213993534864.4424178250142
Winsorized Mean ( 13 / 20 )2273.7833333333334.796219449061865.3457004621414
Winsorized Mean ( 14 / 20 )2289.8833333333331.999126856614271.5608067555761
Winsorized Mean ( 15 / 20 )2288.8833333333329.51442328307677.5513487551631
Winsorized Mean ( 16 / 20 )2283.0166666666728.047976368051081.3968407812555
Winsorized Mean ( 17 / 20 )2300.0166666666725.246328721934491.1030150957504
Winsorized Mean ( 18 / 20 )2312.9166666666723.230207439125199.5650457589618
Winsorized Mean ( 19 / 20 )2305.9521.5177817020838107.164857043637
Winsorized Mean ( 20 / 20 )2297.2833333333319.8624804816801115.659438178036
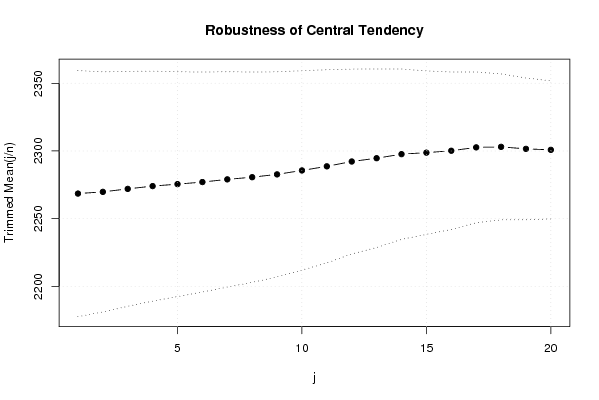
Trimmed Mean ( 1 / 20 )2268.5344827586245.456954073432449.9051141678777
Trimmed Mean ( 2 / 20 )2269.8035714285744.338276241051951.192869093251
Trimmed Mean ( 3 / 20 )227243.387017222345852.3658952713127
Trimmed Mean ( 4 / 20 )2274.0576923076942.464015583826153.552582369856
Trimmed Mean ( 5 / 20 )2275.541.531942464782054.7891542017224
Trimmed Mean ( 6 / 20 )2277.0416666666740.618871150709256.058713651054
Trimmed Mean ( 7 / 20 )2279.0217391304339.765040470296157.3121946357085
Trimmed Mean ( 8 / 20 )2280.6363636363638.837372899444958.7227248748578
Trimmed Mean ( 9 / 20 )2282.7142857142937.870129037322660.277436167819
Trimmed Mean ( 10 / 20 )2285.62536.825466514008562.0664234933872
Trimmed Mean ( 11 / 20 )2288.6578947368435.666271134063364.1686899685749
Trimmed Mean ( 12 / 20 )2292.2222222222234.121843097447867.1775617652282
Trimmed Mean ( 13 / 20 )2294.6470588235332.972437102408269.5928860731964
Trimmed Mean ( 14 / 20 )2297.6562531.457331873168073.0404046746197
Trimmed Mean ( 15 / 20 )2298.7666666666730.182535992311976.162144468318
Trimmed Mean ( 16 / 20 )2300.1785714285729.081351575334779.0946241088554
Trimmed Mean ( 17 / 20 )2302.6538461538527.846001912037782.6924401365648
Trimmed Mean ( 18 / 20 )2303.0416666666726.949528723707885.4575859295326
Trimmed Mean ( 19 / 20 )2301.5454545454526.180916290382587.9092782322109
Trimmed Mean ( 20 / 20 )2300.8525.495229171872890.2462960614754
Median2305
Midrange2226.5
Midmean - Weighted Average at Xnp2288.29032258065
Midmean - Weighted Average at X(n+1)p2298.76666666667
Midmean - Empirical Distribution Function2288.29032258065
Midmean - Empirical Distribution Function - Averaging2298.76666666667
Midmean - Empirical Distribution Function - Interpolation2298.76666666667
Midmean - Closest Observation2288.29032258065
Midmean - True Basic - Statistics Graphics Toolkit2298.76666666667
Midmean - MS Excel (old versions)2306.45454545455
Number of observations60

\begin{tabular}{lllllllll}
\hline
Central Tendency - Ungrouped Data \tabularnewline
Measure & Value & S.E. & Value/S.E. \tabularnewline
Arithmetic Mean & 2267.13333333333 & 47.0649837249734 & 48.1702776438092 \tabularnewline
Geometric Mean & 2236.94317632963 &  &  \tabularnewline
Harmonic Mean & 2205.53667758703 &  &  \tabularnewline
Quadratic Mean & 2295.77551167356 &  &  \tabularnewline
Winsorized Mean ( 1 / 20 ) & 2267.35 & 46.3574653146123 & 48.9101374419906 \tabularnewline
Winsorized Mean ( 2 / 20 ) & 2265.85 & 45.6845288069865 & 49.597753532121 \tabularnewline
Winsorized Mean ( 3 / 20 ) & 2266.65 & 45.1035144947044 & 50.2543986958295 \tabularnewline
Winsorized Mean ( 4 / 20 ) & 2269.25 & 44.4822355515212 & 51.0147471651163 \tabularnewline
Winsorized Mean ( 5 / 20 ) & 2269.33333333333 & 43.642167621773 & 51.9986393205907 \tabularnewline
Winsorized Mean ( 6 / 20 ) & 2267.93333333333 & 42.5521140549578 & 53.2977828176575 \tabularnewline
Winsorized Mean ( 7 / 20 ) & 2270.73333333333 & 41.8641862952328 & 54.2404745984973 \tabularnewline
Winsorized Mean ( 8 / 20 ) & 2269 & 40.8858822484197 & 55.4959285509291 \tabularnewline
Winsorized Mean ( 9 / 20 ) & 2265.25 & 39.8967638479203 & 56.777788008941 \tabularnewline
Winsorized Mean ( 10 / 20 ) & 2266.41666666667 & 38.9110770372121 & 58.246053289638 \tabularnewline
Winsorized Mean ( 11 / 20 ) & 2265.13333333333 & 38.6464012742467 & 58.6117531942821 \tabularnewline
Winsorized Mean ( 12 / 20 ) & 2275.73333333333 & 35.3142139935348 & 64.4424178250142 \tabularnewline
Winsorized Mean ( 13 / 20 ) & 2273.78333333333 & 34.7962194490618 & 65.3457004621414 \tabularnewline
Winsorized Mean ( 14 / 20 ) & 2289.88333333333 & 31.9991268566142 & 71.5608067555761 \tabularnewline
Winsorized Mean ( 15 / 20 ) & 2288.88333333333 & 29.514423283076 & 77.5513487551631 \tabularnewline
Winsorized Mean ( 16 / 20 ) & 2283.01666666667 & 28.0479763680510 & 81.3968407812555 \tabularnewline
Winsorized Mean ( 17 / 20 ) & 2300.01666666667 & 25.2463287219344 & 91.1030150957504 \tabularnewline
Winsorized Mean ( 18 / 20 ) & 2312.91666666667 & 23.2302074391251 & 99.5650457589618 \tabularnewline
Winsorized Mean ( 19 / 20 ) & 2305.95 & 21.5177817020838 & 107.164857043637 \tabularnewline
Winsorized Mean ( 20 / 20 ) & 2297.28333333333 & 19.8624804816801 & 115.659438178036 \tabularnewline
Trimmed Mean ( 1 / 20 ) & 2268.53448275862 & 45.4569540734324 & 49.9051141678777 \tabularnewline
Trimmed Mean ( 2 / 20 ) & 2269.80357142857 & 44.3382762410519 & 51.192869093251 \tabularnewline
Trimmed Mean ( 3 / 20 ) & 2272 & 43.3870172223458 & 52.3658952713127 \tabularnewline
Trimmed Mean ( 4 / 20 ) & 2274.05769230769 & 42.4640155838261 & 53.552582369856 \tabularnewline
Trimmed Mean ( 5 / 20 ) & 2275.5 & 41.5319424647820 & 54.7891542017224 \tabularnewline
Trimmed Mean ( 6 / 20 ) & 2277.04166666667 & 40.6188711507092 & 56.058713651054 \tabularnewline
Trimmed Mean ( 7 / 20 ) & 2279.02173913043 & 39.7650404702961 & 57.3121946357085 \tabularnewline
Trimmed Mean ( 8 / 20 ) & 2280.63636363636 & 38.8373728994449 & 58.7227248748578 \tabularnewline
Trimmed Mean ( 9 / 20 ) & 2282.71428571429 & 37.8701290373226 & 60.277436167819 \tabularnewline
Trimmed Mean ( 10 / 20 ) & 2285.625 & 36.8254665140085 & 62.0664234933872 \tabularnewline
Trimmed Mean ( 11 / 20 ) & 2288.65789473684 & 35.6662711340633 & 64.1686899685749 \tabularnewline
Trimmed Mean ( 12 / 20 ) & 2292.22222222222 & 34.1218430974478 & 67.1775617652282 \tabularnewline
Trimmed Mean ( 13 / 20 ) & 2294.64705882353 & 32.9724371024082 & 69.5928860731964 \tabularnewline
Trimmed Mean ( 14 / 20 ) & 2297.65625 & 31.4573318731680 & 73.0404046746197 \tabularnewline
Trimmed Mean ( 15 / 20 ) & 2298.76666666667 & 30.1825359923119 & 76.162144468318 \tabularnewline
Trimmed Mean ( 16 / 20 ) & 2300.17857142857 & 29.0813515753347 & 79.0946241088554 \tabularnewline
Trimmed Mean ( 17 / 20 ) & 2302.65384615385 & 27.8460019120377 & 82.6924401365648 \tabularnewline
Trimmed Mean ( 18 / 20 ) & 2303.04166666667 & 26.9495287237078 & 85.4575859295326 \tabularnewline
Trimmed Mean ( 19 / 20 ) & 2301.54545454545 & 26.1809162903825 & 87.9092782322109 \tabularnewline
Trimmed Mean ( 20 / 20 ) & 2300.85 & 25.4952291718728 & 90.2462960614754 \tabularnewline
Median & 2305 &  &  \tabularnewline
Midrange & 2226.5 &  &  \tabularnewline
Midmean - Weighted Average at Xnp & 2288.29032258065 &  &  \tabularnewline
Midmean - Weighted Average at X(n+1)p & 2298.76666666667 &  &  \tabularnewline
Midmean - Empirical Distribution Function & 2288.29032258065 &  &  \tabularnewline
Midmean - Empirical Distribution Function - Averaging & 2298.76666666667 &  &  \tabularnewline
Midmean - Empirical Distribution Function - Interpolation & 2298.76666666667 &  &  \tabularnewline
Midmean - Closest Observation & 2288.29032258065 &  &  \tabularnewline
Midmean - True Basic - Statistics Graphics Toolkit & 2298.76666666667 &  &  \tabularnewline
Midmean - MS Excel (old versions) & 2306.45454545455 &  &  \tabularnewline
Number of observations & 60 &  &  \tabularnewline
\hline
\end{tabular}
%Source: https://freestatistics.org/blog/index.php?pk=17079&T=1

[TABLE]
[ROW][C]Central Tendency - Ungrouped Data[/C][/ROW]
[ROW][C]Measure[/C][C]Value[/C][C]S.E.[/C][C]Value/S.E.[/C][/ROW]
[ROW][C]Arithmetic Mean[/C][C]2267.13333333333[/C][C]47.0649837249734[/C][C]48.1702776438092[/C][/ROW]
[ROW][C]Geometric Mean[/C][C]2236.94317632963[/C][C][/C][C][/C][/ROW]
[ROW][C]Harmonic Mean[/C][C]2205.53667758703[/C][C][/C][C][/C][/ROW]
[ROW][C]Quadratic Mean[/C][C]2295.77551167356[/C][C][/C][C][/C][/ROW]
[ROW][C]Winsorized Mean ( 1 / 20 )[/C][C]2267.35[/C][C]46.3574653146123[/C][C]48.9101374419906[/C][/ROW]
[ROW][C]Winsorized Mean ( 2 / 20 )[/C][C]2265.85[/C][C]45.6845288069865[/C][C]49.597753532121[/C][/ROW]
[ROW][C]Winsorized Mean ( 3 / 20 )[/C][C]2266.65[/C][C]45.1035144947044[/C][C]50.2543986958295[/C][/ROW]
[ROW][C]Winsorized Mean ( 4 / 20 )[/C][C]2269.25[/C][C]44.4822355515212[/C][C]51.0147471651163[/C][/ROW]
[ROW][C]Winsorized Mean ( 5 / 20 )[/C][C]2269.33333333333[/C][C]43.642167621773[/C][C]51.9986393205907[/C][/ROW]
[ROW][C]Winsorized Mean ( 6 / 20 )[/C][C]2267.93333333333[/C][C]42.5521140549578[/C][C]53.2977828176575[/C][/ROW]
[ROW][C]Winsorized Mean ( 7 / 20 )[/C][C]2270.73333333333[/C][C]41.8641862952328[/C][C]54.2404745984973[/C][/ROW]
[ROW][C]Winsorized Mean ( 8 / 20 )[/C][C]2269[/C][C]40.8858822484197[/C][C]55.4959285509291[/C][/ROW]
[ROW][C]Winsorized Mean ( 9 / 20 )[/C][C]2265.25[/C][C]39.8967638479203[/C][C]56.777788008941[/C][/ROW]
[ROW][C]Winsorized Mean ( 10 / 20 )[/C][C]2266.41666666667[/C][C]38.9110770372121[/C][C]58.246053289638[/C][/ROW]
[ROW][C]Winsorized Mean ( 11 / 20 )[/C][C]2265.13333333333[/C][C]38.6464012742467[/C][C]58.6117531942821[/C][/ROW]
[ROW][C]Winsorized Mean ( 12 / 20 )[/C][C]2275.73333333333[/C][C]35.3142139935348[/C][C]64.4424178250142[/C][/ROW]
[ROW][C]Winsorized Mean ( 13 / 20 )[/C][C]2273.78333333333[/C][C]34.7962194490618[/C][C]65.3457004621414[/C][/ROW]
[ROW][C]Winsorized Mean ( 14 / 20 )[/C][C]2289.88333333333[/C][C]31.9991268566142[/C][C]71.5608067555761[/C][/ROW]
[ROW][C]Winsorized Mean ( 15 / 20 )[/C][C]2288.88333333333[/C][C]29.514423283076[/C][C]77.5513487551631[/C][/ROW]
[ROW][C]Winsorized Mean ( 16 / 20 )[/C][C]2283.01666666667[/C][C]28.0479763680510[/C][C]81.3968407812555[/C][/ROW]
[ROW][C]Winsorized Mean ( 17 / 20 )[/C][C]2300.01666666667[/C][C]25.2463287219344[/C][C]91.1030150957504[/C][/ROW]
[ROW][C]Winsorized Mean ( 18 / 20 )[/C][C]2312.91666666667[/C][C]23.2302074391251[/C][C]99.5650457589618[/C][/ROW]
[ROW][C]Winsorized Mean ( 19 / 20 )[/C][C]2305.95[/C][C]21.5177817020838[/C][C]107.164857043637[/C][/ROW]
[ROW][C]Winsorized Mean ( 20 / 20 )[/C][C]2297.28333333333[/C][C]19.8624804816801[/C][C]115.659438178036[/C][/ROW]
[ROW][C]Trimmed Mean ( 1 / 20 )[/C][C]2268.53448275862[/C][C]45.4569540734324[/C][C]49.9051141678777[/C][/ROW]
[ROW][C]Trimmed Mean ( 2 / 20 )[/C][C]2269.80357142857[/C][C]44.3382762410519[/C][C]51.192869093251[/C][/ROW]
[ROW][C]Trimmed Mean ( 3 / 20 )[/C][C]2272[/C][C]43.3870172223458[/C][C]52.3658952713127[/C][/ROW]
[ROW][C]Trimmed Mean ( 4 / 20 )[/C][C]2274.05769230769[/C][C]42.4640155838261[/C][C]53.552582369856[/C][/ROW]
[ROW][C]Trimmed Mean ( 5 / 20 )[/C][C]2275.5[/C][C]41.5319424647820[/C][C]54.7891542017224[/C][/ROW]
[ROW][C]Trimmed Mean ( 6 / 20 )[/C][C]2277.04166666667[/C][C]40.6188711507092[/C][C]56.058713651054[/C][/ROW]
[ROW][C]Trimmed Mean ( 7 / 20 )[/C][C]2279.02173913043[/C][C]39.7650404702961[/C][C]57.3121946357085[/C][/ROW]
[ROW][C]Trimmed Mean ( 8 / 20 )[/C][C]2280.63636363636[/C][C]38.8373728994449[/C][C]58.7227248748578[/C][/ROW]
[ROW][C]Trimmed Mean ( 9 / 20 )[/C][C]2282.71428571429[/C][C]37.8701290373226[/C][C]60.277436167819[/C][/ROW]
[ROW][C]Trimmed Mean ( 10 / 20 )[/C][C]2285.625[/C][C]36.8254665140085[/C][C]62.0664234933872[/C][/ROW]
[ROW][C]Trimmed Mean ( 11 / 20 )[/C][C]2288.65789473684[/C][C]35.6662711340633[/C][C]64.1686899685749[/C][/ROW]
[ROW][C]Trimmed Mean ( 12 / 20 )[/C][C]2292.22222222222[/C][C]34.1218430974478[/C][C]67.1775617652282[/C][/ROW]
[ROW][C]Trimmed Mean ( 13 / 20 )[/C][C]2294.64705882353[/C][C]32.9724371024082[/C][C]69.5928860731964[/C][/ROW]
[ROW][C]Trimmed Mean ( 14 / 20 )[/C][C]2297.65625[/C][C]31.4573318731680[/C][C]73.0404046746197[/C][/ROW]
[ROW][C]Trimmed Mean ( 15 / 20 )[/C][C]2298.76666666667[/C][C]30.1825359923119[/C][C]76.162144468318[/C][/ROW]
[ROW][C]Trimmed Mean ( 16 / 20 )[/C][C]2300.17857142857[/C][C]29.0813515753347[/C][C]79.0946241088554[/C][/ROW]
[ROW][C]Trimmed Mean ( 17 / 20 )[/C][C]2302.65384615385[/C][C]27.8460019120377[/C][C]82.6924401365648[/C][/ROW]
[ROW][C]Trimmed Mean ( 18 / 20 )[/C][C]2303.04166666667[/C][C]26.9495287237078[/C][C]85.4575859295326[/C][/ROW]
[ROW][C]Trimmed Mean ( 19 / 20 )[/C][C]2301.54545454545[/C][C]26.1809162903825[/C][C]87.9092782322109[/C][/ROW]
[ROW][C]Trimmed Mean ( 20 / 20 )[/C][C]2300.85[/C][C]25.4952291718728[/C][C]90.2462960614754[/C][/ROW]
[ROW][C]Median[/C][C]2305[/C][C][/C][C][/C][/ROW]
[ROW][C]Midrange[/C][C]2226.5[/C][C][/C][C][/C][/ROW]
[ROW][C]Midmean - Weighted Average at Xnp[/C][C]2288.29032258065[/C][C][/C][C][/C][/ROW]
[ROW][C]Midmean - Weighted Average at X(n+1)p[/C][C]2298.76666666667[/C][C][/C][C][/C][/ROW]
[ROW][C]Midmean - Empirical Distribution Function[/C][C]2288.29032258065[/C][C][/C][C][/C][/ROW]
[ROW][C]Midmean - Empirical Distribution Function - Averaging[/C][C]2298.76666666667[/C][C][/C][C][/C][/ROW]
[ROW][C]Midmean - Empirical Distribution Function - Interpolation[/C][C]2298.76666666667[/C][C][/C][C][/C][/ROW]
[ROW][C]Midmean - Closest Observation[/C][C]2288.29032258065[/C][C][/C][C][/C][/ROW]
[ROW][C]Midmean - True Basic - Statistics Graphics Toolkit[/C][C]2298.76666666667[/C][C][/C][C][/C][/ROW]
[ROW][C]Midmean - MS Excel (old versions)[/C][C]2306.45454545455[/C][C][/C][C][/C][/ROW]
[ROW][C]Number of observations[/C][C]60[/C][C][/C][C][/C][/ROW]
[/TABLE]
Source: https://freestatistics.org/blog/index.php?pk=17079&T=1

Globally Unique Identifier (entire table): ba.freestatistics.org/blog/index.php?pk=17079&T=1

As an alternative you can also use a QR Code:  

The GUIDs for individual cells are displayed in the table below:

Central Tendency - Ungrouped Data
MeasureValueS.E.Value/S.E.
Arithmetic Mean2267.1333333333347.064983724973448.1702776438092
Geometric Mean2236.94317632963
Harmonic Mean2205.53667758703
Quadratic Mean2295.77551167356
Winsorized Mean ( 1 / 20 )2267.3546.357465314612348.9101374419906
Winsorized Mean ( 2 / 20 )2265.8545.684528806986549.597753532121
Winsorized Mean ( 3 / 20 )2266.6545.103514494704450.2543986958295
Winsorized Mean ( 4 / 20 )2269.2544.482235551521251.0147471651163
Winsorized Mean ( 5 / 20 )2269.3333333333343.64216762177351.9986393205907
Winsorized Mean ( 6 / 20 )2267.9333333333342.552114054957853.2977828176575
Winsorized Mean ( 7 / 20 )2270.7333333333341.864186295232854.2404745984973
Winsorized Mean ( 8 / 20 )226940.885882248419755.4959285509291
Winsorized Mean ( 9 / 20 )2265.2539.896763847920356.777788008941
Winsorized Mean ( 10 / 20 )2266.4166666666738.911077037212158.246053289638
Winsorized Mean ( 11 / 20 )2265.1333333333338.646401274246758.6117531942821
Winsorized Mean ( 12 / 20 )2275.7333333333335.314213993534864.4424178250142
Winsorized Mean ( 13 / 20 )2273.7833333333334.796219449061865.3457004621414
Winsorized Mean ( 14 / 20 )2289.8833333333331.999126856614271.5608067555761
Winsorized Mean ( 15 / 20 )2288.8833333333329.51442328307677.5513487551631
Winsorized Mean ( 16 / 20 )2283.0166666666728.047976368051081.3968407812555
Winsorized Mean ( 17 / 20 )2300.0166666666725.246328721934491.1030150957504
Winsorized Mean ( 18 / 20 )2312.9166666666723.230207439125199.5650457589618
Winsorized Mean ( 19 / 20 )2305.9521.5177817020838107.164857043637
Winsorized Mean ( 20 / 20 )2297.2833333333319.8624804816801115.659438178036
Trimmed Mean ( 1 / 20 )2268.5344827586245.456954073432449.9051141678777
Trimmed Mean ( 2 / 20 )2269.8035714285744.338276241051951.192869093251
Trimmed Mean ( 3 / 20 )227243.387017222345852.3658952713127
Trimmed Mean ( 4 / 20 )2274.0576923076942.464015583826153.552582369856
Trimmed Mean ( 5 / 20 )2275.541.531942464782054.7891542017224
Trimmed Mean ( 6 / 20 )2277.0416666666740.618871150709256.058713651054
Trimmed Mean ( 7 / 20 )2279.0217391304339.765040470296157.3121946357085
Trimmed Mean ( 8 / 20 )2280.6363636363638.837372899444958.7227248748578
Trimmed Mean ( 9 / 20 )2282.7142857142937.870129037322660.277436167819
Trimmed Mean ( 10 / 20 )2285.62536.825466514008562.0664234933872
Trimmed Mean ( 11 / 20 )2288.6578947368435.666271134063364.1686899685749
Trimmed Mean ( 12 / 20 )2292.2222222222234.121843097447867.1775617652282
Trimmed Mean ( 13 / 20 )2294.6470588235332.972437102408269.5928860731964
Trimmed Mean ( 14 / 20 )2297.6562531.457331873168073.0404046746197
Trimmed Mean ( 15 / 20 )2298.7666666666730.182535992311976.162144468318
Trimmed Mean ( 16 / 20 )2300.1785714285729.081351575334779.0946241088554
Trimmed Mean ( 17 / 20 )2302.6538461538527.846001912037782.6924401365648
Trimmed Mean ( 18 / 20 )2303.0416666666726.949528723707885.4575859295326
Trimmed Mean ( 19 / 20 )2301.5454545454526.180916290382587.9092782322109
Trimmed Mean ( 20 / 20 )2300.8525.495229171872890.2462960614754
Median2305
Midrange2226.5
Midmean - Weighted Average at Xnp2288.29032258065
Midmean - Weighted Average at X(n+1)p2298.76666666667
Midmean - Empirical Distribution Function2288.29032258065
Midmean - Empirical Distribution Function - Averaging2298.76666666667
Midmean - Empirical Distribution Function - Interpolation2298.76666666667
Midmean - Closest Observation2288.29032258065
Midmean - True Basic - Statistics Graphics Toolkit2298.76666666667
Midmean - MS Excel (old versions)2306.45454545455
Number of observations60


Parameters (Session):
par1 = grey ; par2 = grey ; par3 = TRUE ; par4 = bouwvergunningen ; par5 = werkelijk begonnen woningen ;
Parameters (R input):
R code (references can be found in the software module):
geomean <- function(x) {
return(exp(mean(log(x))))
}
harmean <- function(x) {
return(1/mean(1/x))
}
quamean <- function(x) {
return(sqrt(mean(x*x)))
}
winmean <- function(x) {
x <-sort(x[!is.na(x)])
n<-length(x)
denom <- 3
nodenom <- n/denom
if (nodenom>40) denom <- n/40
sqrtn = sqrt(n)
roundnodenom = floor(nodenom)
win <- array(NA,dim=c(roundnodenom,2))
for (j in 1:roundnodenom) {
win[j,1] <- (j*x[j+1]+sum(x[(j+1):(n-j)])+j*x[n-j])/n
win[j,2] <- sd(c(rep(x[j+1],j),x[(j+1):(n-j)],rep(x[n-j],j)))/sqrtn
}
return(win)
}
trimean <- function(x) {
x <-sort(x[!is.na(x)])
n<-length(x)
denom <- 3
nodenom <- n/denom
if (nodenom>40) denom <- n/40
sqrtn = sqrt(n)
roundnodenom = floor(nodenom)
tri <- array(NA,dim=c(roundnodenom,2))
for (j in 1:roundnodenom) {
tri[j,1] <- mean(x,trim=j/n)
tri[j,2] <- sd(x[(j+1):(n-j)]) / sqrt(n-j*2)
}
return(tri)
}
midrange <- function(x) {
return((max(x)+min(x))/2)
}
q1 <- function(data,n,p,i,f) {
np <- n*p;
i <<- floor(np)
f <<- np - i
qvalue <- (1-f)*data[i] + f*data[i+1]
}
q2 <- function(data,n,p,i,f) {
np <- (n+1)*p
i <<- floor(np)
f <<- np - i
qvalue <- (1-f)*data[i] + f*data[i+1]
}
q3 <- function(data,n,p,i,f) {
np <- n*p
i <<- floor(np)
f <<- np - i
if (f==0) {
qvalue <- data[i]
} else {
qvalue <- data[i+1]
}
}
q4 <- function(data,n,p,i,f) {
np <- n*p
i <<- floor(np)
f <<- np - i
if (f==0) {
qvalue <- (data[i]+data[i+1])/2
} else {
qvalue <- data[i+1]
}
}
q5 <- function(data,n,p,i,f) {
np <- (n-1)*p
i <<- floor(np)
f <<- np - i
if (f==0) {
qvalue <- data[i+1]
} else {
qvalue <- data[i+1] + f*(data[i+2]-data[i+1])
}
}
q6 <- function(data,n,p,i,f) {
np <- n*p+0.5
i <<- floor(np)
f <<- np - i
qvalue <- data[i]
}
q7 <- function(data,n,p,i,f) {
np <- (n+1)*p
i <<- floor(np)
f <<- np - i
if (f==0) {
qvalue <- data[i]
} else {
qvalue <- f*data[i] + (1-f)*data[i+1]
}
}
q8 <- function(data,n,p,i,f) {
np <- (n+1)*p
i <<- floor(np)
f <<- np - i
if (f==0) {
qvalue <- data[i]
} else {
if (f == 0.5) {
qvalue <- (data[i]+data[i+1])/2
} else {
if (f < 0.5) {
qvalue <- data[i]
} else {
qvalue <- data[i+1]
}
}
}
}
midmean <- function(x,def) {
x <-sort(x[!is.na(x)])
n<-length(x)
if (def==1) {
qvalue1 <- q1(x,n,0.25,i,f)
qvalue3 <- q1(x,n,0.75,i,f)
}
if (def==2) {
qvalue1 <- q2(x,n,0.25,i,f)
qvalue3 <- q2(x,n,0.75,i,f)
}
if (def==3) {
qvalue1 <- q3(x,n,0.25,i,f)
qvalue3 <- q3(x,n,0.75,i,f)
}
if (def==4) {
qvalue1 <- q4(x,n,0.25,i,f)
qvalue3 <- q4(x,n,0.75,i,f)
}
if (def==5) {
qvalue1 <- q5(x,n,0.25,i,f)
qvalue3 <- q5(x,n,0.75,i,f)
}
if (def==6) {
qvalue1 <- q6(x,n,0.25,i,f)
qvalue3 <- q6(x,n,0.75,i,f)
}
if (def==7) {
qvalue1 <- q7(x,n,0.25,i,f)
qvalue3 <- q7(x,n,0.75,i,f)
}
if (def==8) {
qvalue1 <- q8(x,n,0.25,i,f)
qvalue3 <- q8(x,n,0.75,i,f)
}
midm <- 0
myn <- 0
roundno4 <- round(n/4)
round3no4 <- round(3*n/4)
for (i in 1:n) {
if ((x[i]>=qvalue1) & (x[i]<=qvalue3)){
midm = midm + x[i]
myn = myn + 1
}
}
midm = midm / myn
return(midm)
}
(arm <- mean(x))
sqrtn <- sqrt(length(x))
(armse <- sd(x) / sqrtn)
(armose <- arm / armse)
(geo <- geomean(x))
(har <- harmean(x))
(qua <- quamean(x))
(win <- winmean(x))
(tri <- trimean(x))
(midr <- midrange(x))
midm <- array(NA,dim=8)
for (j in 1:8) midm[j] <- midmean(x,j)
midm
bitmap(file='test1.png')
lb <- win[,1] - 2*win[,2]
ub <- win[,1] + 2*win[,2]
if ((ylimmin == '') | (ylimmax == '')) plot(win[,1],type='b',main=main, xlab='j', pch=19, ylab='Winsorized Mean(j/n)', ylim=c(min(lb),max(ub))) else plot(win[,1],type='l',main=main, xlab='j', pch=19, ylab='Winsorized Mean(j/n)', ylim=c(ylimmin,ylimmax))
lines(ub,lty=3)
lines(lb,lty=3)
grid()
dev.off()
bitmap(file='test2.png')
lb <- tri[,1] - 2*tri[,2]
ub <- tri[,1] + 2*tri[,2]
if ((ylimmin == '') | (ylimmax == '')) plot(tri[,1],type='b',main=main, xlab='j', pch=19, ylab='Trimmed Mean(j/n)', ylim=c(min(lb),max(ub))) else plot(tri[,1],type='l',main=main, xlab='j', pch=19, ylab='Trimmed Mean(j/n)', ylim=c(ylimmin,ylimmax))
lines(ub,lty=3)
lines(lb,lty=3)
grid()
dev.off()
load(file='createtable')
a<-table.start()
a<-table.row.start(a)
a<-table.element(a,'Central Tendency - Ungrouped Data',4,TRUE)
a<-table.row.end(a)
a<-table.row.start(a)
a<-table.element(a,'Measure',header=TRUE)
a<-table.element(a,'Value',header=TRUE)
a<-table.element(a,'S.E.',header=TRUE)
a<-table.element(a,'Value/S.E.',header=TRUE)
a<-table.row.end(a)
a<-table.row.start(a)
a<-table.element(a,hyperlink('arithmetic_mean.htm', 'Arithmetic Mean', 'click to view the definition of the Arithmetic Mean'),header=TRUE)
a<-table.element(a,arm)
a<-table.element(a,hyperlink('arithmetic_mean_standard_error.htm', armse, 'click to view the definition of the Standard Error of the Arithmetic Mean'))
a<-table.element(a,armose)
a<-table.row.end(a)
a<-table.row.start(a)
a<-table.element(a,hyperlink('geometric_mean.htm', 'Geometric Mean', 'click to view the definition of the Geometric Mean'),header=TRUE)
a<-table.element(a,geo)
a<-table.element(a,'')
a<-table.row.end(a)
a<-table.row.start(a)
a<-table.element(a,hyperlink('harmonic_mean.htm', 'Harmonic Mean', 'click to view the definition of the Harmonic Mean'),header=TRUE)
a<-table.element(a,har)
a<-table.element(a,'')
a<-table.row.end(a)
a<-table.row.start(a)
a<-table.element(a,hyperlink('quadratic_mean.htm', 'Quadratic Mean', 'click to view the definition of the Quadratic Mean'),header=TRUE)
a<-table.element(a,qua)
a<-table.element(a,'')
a<-table.row.end(a)
for (j in 1:length(win[,1])) {
a<-table.row.start(a)
mylabel <- paste('Winsorized Mean (',j)
mylabel <- paste(mylabel,'/')
mylabel <- paste(mylabel,length(win[,1]))
mylabel <- paste(mylabel,')')
a<-table.element(a,hyperlink('winsorized_mean.htm', mylabel, 'click to view the definition of the Winsorized Mean'),header=TRUE)
a<-table.element(a,win[j,1])
a<-table.element(a,win[j,2])
a<-table.element(a,win[j,1]/win[j,2])
a<-table.row.end(a)
}
for (j in 1:length(tri[,1])) {
a<-table.row.start(a)
mylabel <- paste('Trimmed Mean (',j)
mylabel <- paste(mylabel,'/')
mylabel <- paste(mylabel,length(tri[,1]))
mylabel <- paste(mylabel,')')
a<-table.element(a,hyperlink('arithmetic_mean.htm', mylabel, 'click to view the definition of the Trimmed Mean'),header=TRUE)
a<-table.element(a,tri[j,1])
a<-table.element(a,tri[j,2])
a<-table.element(a,tri[j,1]/tri[j,2])
a<-table.row.end(a)
}
a<-table.row.start(a)
a<-table.element(a,hyperlink('median_1.htm', 'Median', 'click to view the definition of the Median'),header=TRUE)
a<-table.element(a,median(x))
a<-table.element(a,'')
a<-table.row.end(a)
a<-table.row.start(a)
a<-table.element(a,hyperlink('midrange.htm', 'Midrange', 'click to view the definition of the Midrange'),header=TRUE)
a<-table.element(a,midr)
a<-table.element(a,'')
a<-table.row.end(a)
a<-table.row.start(a)
mymid <- hyperlink('midmean.htm', 'Midmean', 'click to view the definition of the Midmean')
mylabel <- paste(mymid,hyperlink('method_1.htm','Weighted Average at Xnp',''),sep=' - ')
a<-table.element(a,mylabel,header=TRUE)
a<-table.element(a,midm[1])
a<-table.element(a,'')
a<-table.row.end(a)
a<-table.row.start(a)
mymid <- hyperlink('midmean.htm', 'Midmean', 'click to view the definition of the Midmean')
mylabel <- paste(mymid,hyperlink('method_2.htm','Weighted Average at X(n+1)p',''),sep=' - ')
a<-table.element(a,mylabel,header=TRUE)
a<-table.element(a,midm[2])
a<-table.element(a,'')
a<-table.row.end(a)
a<-table.row.start(a)
mymid <- hyperlink('midmean.htm', 'Midmean', 'click to view the definition of the Midmean')
mylabel <- paste(mymid,hyperlink('method_3.htm','Empirical Distribution Function',''),sep=' - ')
a<-table.element(a,mylabel,header=TRUE)
a<-table.element(a,midm[3])
a<-table.element(a,'')
a<-table.row.end(a)
a<-table.row.start(a)
mymid <- hyperlink('midmean.htm', 'Midmean', 'click to view the definition of the Midmean')
mylabel <- paste(mymid,hyperlink('method_4.htm','Empirical Distribution Function - Averaging',''),sep=' - ')
a<-table.element(a,mylabel,header=TRUE)
a<-table.element(a,midm[4])
a<-table.element(a,'')
a<-table.row.end(a)
a<-table.row.start(a)
mymid <- hyperlink('midmean.htm', 'Midmean', 'click to view the definition of the Midmean')
mylabel <- paste(mymid,hyperlink('method_5.htm','Empirical Distribution Function - Interpolation',''),sep=' - ')
a<-table.element(a,mylabel,header=TRUE)
a<-table.element(a,midm[5])
a<-table.element(a,'')
a<-table.row.end(a)
a<-table.row.start(a)
mymid <- hyperlink('midmean.htm', 'Midmean', 'click to view the definition of the Midmean')
mylabel <- paste(mymid,hyperlink('method_6.htm','Closest Observation',''),sep=' - ')
a<-table.element(a,mylabel,header=TRUE)
a<-table.element(a,midm[6])
a<-table.element(a,'')
a<-table.row.end(a)
a<-table.row.start(a)
mymid <- hyperlink('midmean.htm', 'Midmean', 'click to view the definition of the Midmean')
mylabel <- paste(mymid,hyperlink('method_7.htm','True Basic - Statistics Graphics Toolkit',''),sep=' - ')
a<-table.element(a,mylabel,header=TRUE)
a<-table.element(a,midm[7])
a<-table.element(a,'')
a<-table.row.end(a)
a<-table.row.start(a)
mymid <- hyperlink('midmean.htm', 'Midmean', 'click to view the definition of the Midmean')
mylabel <- paste(mymid,hyperlink('method_8.htm','MS Excel (old versions)',''),sep=' - ')
a<-table.element(a,mylabel,header=TRUE)
a<-table.element(a,midm[8])
a<-table.element(a,'')
a<-table.row.end(a)
a<-table.row.start(a)
a<-table.element(a,'Number of observations',header=TRUE)
a<-table.element(a,length(x))
a<-table.element(a,'')
a<-table.row.end(a)
a<-table.end(a)
table.save(a,file='mytable.tab')