Free Statistics

of Irreproducible Research!

Author's title

Author*The author of this computation has been verified*
R Software Modulerwasp_centraltendency.wasp
Title produced by softwareCentral Tendency
Date of computationSun, 19 Oct 2008 13:10:37 -0600
Cite this page as followsStatistical Computations at FreeStatistics.org, Office for Research Development and Education, URL https://freestatistics.org/blog/index.php?v=date/2008/Oct/19/t1224443475jiq7qm0xmxyalvo.htm/, Retrieved Tue, 28 May 2024 20:12:37 +0000
Statistical Computations at FreeStatistics.org, Office for Research Development and Education, URL https://freestatistics.org/blog/index.php?pk=17064, Retrieved Tue, 28 May 2024 20:12:37 +0000
QR Codes:

Original text written by user:
IsPrivate?No (this computation is public)
User-defined keywords
Estimated Impact173
Family? (F = Feedback message, R = changed R code, M = changed R Module, P = changed Parameters, D = changed Data)
F     [Univariate Data Series] [blog 1e tijdreeks...] [2008-10-13 19:23:31] [7173087adebe3e3a714c80ea2417b3eb]
-   PD  [Univariate Data Series] [tijdreeksen opnie...] [2008-10-19 17:13:12] [7173087adebe3e3a714c80ea2417b3eb]
-   PD    [Univariate Data Series] [tijdreeksen opnie...] [2008-10-19 18:55:20] [7173087adebe3e3a714c80ea2417b3eb]
- RM          [Central Tendency] [central tendency ...] [2008-10-19 19:10:37] [95d95b0e883740fcbc85e18ec42dcafb] [Current]
- RMP           [Standard Deviation-Mean Plot] [own data step 1 SMP] [2008-12-08 20:37:29] [7173087adebe3e3a714c80ea2417b3eb]
-    D            [Standard Deviation-Mean Plot] [] [2008-12-22 08:11:01] [82d1081ec88d38a0607f8d504e46982e]
- RMP           [Variance Reduction Matrix] [VRM own dataset s...] [2008-12-08 20:43:14] [7173087adebe3e3a714c80ea2417b3eb]
- RMP           [(Partial) Autocorrelation Function] [ACF step 2 own da...] [2008-12-08 20:48:28] [7173087adebe3e3a714c80ea2417b3eb]
-   PD            [(Partial) Autocorrelation Function] [] [2008-12-22 08:38:52] [82d1081ec88d38a0607f8d504e46982e]
- RMP             [Spectral Analysis] [spectral analysis...] [2008-12-22 11:28:58] [7173087adebe3e3a714c80ea2417b3eb]
- RMP           [ARIMA Backward Selection] [arima backward st...] [2008-12-08 22:03:24] [7173087adebe3e3a714c80ea2417b3eb]
-   PD            [ARIMA Backward Selection] [Backward inschr. ...] [2008-12-21 14:19:55] [8b0d202c3a0c4ea223fd8b8e731dacd8]
- RMPD            [ARIMA Forecasting] [Forecasting insch...] [2008-12-21 14:44:46] [8b0d202c3a0c4ea223fd8b8e731dacd8]
- RMP             [ARIMA Forecasting] [forecast bouwverg...] [2008-12-22 13:21:52] [7173087adebe3e3a714c80ea2417b3eb]
- RMP           [ARIMA Backward Selection] [step 5 arima back...] [2008-12-08 22:29:28] [7173087adebe3e3a714c80ea2417b3eb]
- RMP           [ARIMA Backward Selection] [step 5 arima back...] [2008-12-08 22:32:26] [7173087adebe3e3a714c80ea2417b3eb]
- RMP             [ARIMA Forecasting] [Arima forecasting...] [2008-12-22 13:03:25] [c993f605b206b366f754f7f8c1fcc291]
Feedback Forum

Post a new message
Dataseries X:
5014
6153
6441
5584
6427
6062
5589
6216
5809
4989
6706
7174
6122
8075
6292
6337
8576
6077
5931
6288
7167
6054
6468
6401
6927
7914
7728
8699
8522
6481
7502
7778
7424
6941
8574
9169
7701
9035
7158
8195
8124
7073
7017
7390
7776
6197
6889
7087
6485
7654
6501
6313
7826
6589
6729
5684
8105
6391
5901
6758


Summary of computational transaction
Raw Inputview raw input (R code)
Raw Outputview raw output of R engine
Computing time1 seconds
R Server'Gwilym Jenkins' @ 72.249.127.135

\begin{tabular}{lllllllll}
\hline
Summary of computational transaction \tabularnewline
Raw Input & view raw input (R code)  \tabularnewline
Raw Output & view raw output of R engine  \tabularnewline
Computing time & 1 seconds \tabularnewline
R Server & 'Gwilym Jenkins' @ 72.249.127.135 \tabularnewline
\hline
\end{tabular}
%Source: https://freestatistics.org/blog/index.php?pk=17064&T=0

[TABLE]
[ROW][C]Summary of computational transaction[/C][/ROW]
[ROW][C]Raw Input[/C][C]view raw input (R code) [/C][/ROW]
[ROW][C]Raw Output[/C][C]view raw output of R engine [/C][/ROW]
[ROW][C]Computing time[/C][C]1 seconds[/C][/ROW]
[ROW][C]R Server[/C][C]'Gwilym Jenkins' @ 72.249.127.135[/C][/ROW]
[/TABLE]
Source: https://freestatistics.org/blog/index.php?pk=17064&T=0

Globally Unique Identifier (entire table): ba.freestatistics.org/blog/index.php?pk=17064&T=0

As an alternative you can also use a QR Code:  

The GUIDs for individual cells are displayed in the table below:

Summary of computational transaction
Raw Inputview raw input (R code)
Raw Outputview raw output of R engine
Computing time1 seconds
R Server'Gwilym Jenkins' @ 72.249.127.135


Central Tendency - Ungrouped Data
MeasureValueS.E.Value/S.E.
Arithmetic Mean6936.48333333333126.12826735431054.995469919902
Geometric Mean6869.77662580253
Harmonic Mean6804.02022798683
Quadratic Mean7003.81275330326
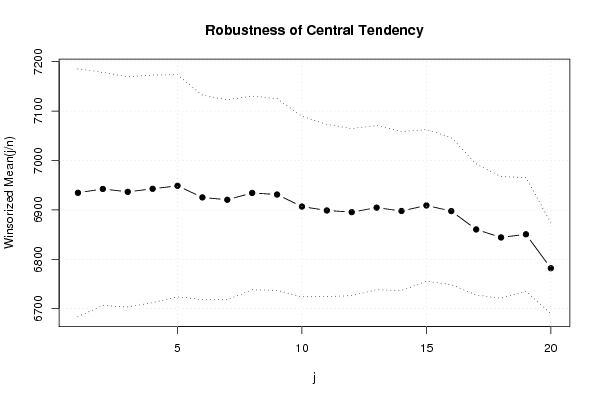
Winsorized Mean ( 1 / 20 )6934.66666666667125.36750195381355.3147072294818
Winsorized Mean ( 2 / 20 )6942.46666666667118.02062317786658.8241824160158
Winsorized Mean ( 3 / 20 )6936.56666666667116.46207492751459.560734007049
Winsorized Mean ( 4 / 20 )6942.76666666667115.22260049479660.2552505919203
Winsorized Mean ( 5 / 20 )6948.85112.32725802529161.8625445164473
Winsorized Mean ( 6 / 20 )6925.35103.46187055235466.9362535495201
Winsorized Mean ( 7 / 20 )6920.56666666667101.18141777619868.3976052003362
Winsorized Mean ( 8 / 20 )6934.4333333333398.06094140765370.7155492675307
Winsorized Mean ( 9 / 20 )6931.1333333333396.973394530171771.4745870959155
Winsorized Mean ( 10 / 20 )6906.891.39770546885675.5686367023022
Winsorized Mean ( 11 / 20 )6898.9166666666787.177691425602479.1362624296402
Winsorized Mean ( 12 / 20 )6895.5166666666784.53308612998381.571807943504
Winsorized Mean ( 13 / 20 )6904.6166666666783.058086990376483.1299746581771
Winsorized Mean ( 14 / 20 )6897.8580.443996819487985.7472312754227
Winsorized Mean ( 15 / 20 )6909.176.734300921120790.0392642802889
Winsorized Mean ( 16 / 20 )6897.6333333333374.41154065262792.6957468268711
Winsorized Mean ( 17 / 20 )6860.5166666666766.3357641933151103.421084389317
Winsorized Mean ( 18 / 20 )6844.3166666666761.5417018674186111.214289806473
Winsorized Mean ( 19 / 20 )6850.6557.4710087807973119.201840116107
Winsorized Mean ( 20 / 20 )6781.9833333333346.0308634589025147.335566263893
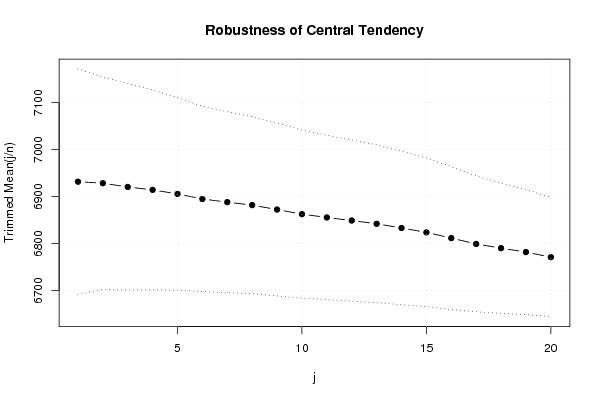
Trimmed Mean ( 1 / 20 )6931.56896551724119.91287952671257.8050414006875
Trimmed Mean ( 2 / 20 )6928.25113.15314082791061.228967656646
Trimmed Mean ( 3 / 20 )6920.35185185185109.77592690643763.0407052518004
Trimmed Mean ( 4 / 20 )6914.11538461538106.31204125602565.0360514474982
Trimmed Mean ( 5 / 20 )6905.52102.42263876024867.4218130247993
Trimmed Mean ( 6 / 20 )6894.687598.482448648025670.0093021106886
Trimmed Mean ( 7 / 20 )6888.0217391304396.30919656063571.5198754128723
Trimmed Mean ( 8 / 20 )6881.6818181818294.104501831949673.1280829738733
Trimmed Mean ( 9 / 20 )6872.261904761991.982968551313774.7123300432312
Trimmed Mean ( 10 / 20 )6862.4589.380553081924876.7778869494127
Trimmed Mean ( 11 / 20 )6855.4473684210587.391897842362578.4448849112638
Trimmed Mean ( 12 / 20 )6848.8611111111185.711894238390279.9056090402389
Trimmed Mean ( 13 / 20 )684283.950498953310681.500408994653
Trimmed Mean ( 14 / 20 )6832.9687581.669283970807783.6663237116467
Trimmed Mean ( 15 / 20 )6823.779.01843448528886.3557984215755
Trimmed Mean ( 16 / 20 )6811.576.041333441322589.5762829469069
Trimmed Mean ( 17 / 20 )6799.0769230769272.193200682973494.178909630758
Trimmed Mean ( 18 / 20 )6790.0416666666769.357519449783297.899142306882
Trimmed Mean ( 19 / 20 )6781.8181818181866.5595341479323101.891010335878
Trimmed Mean ( 20 / 20 )6770.9563.2820118700076106.996440219200
Median6743.5
Midrange7079
Midmean - Weighted Average at Xnp6804.09677419355
Midmean - Weighted Average at X(n+1)p6823.7
Midmean - Empirical Distribution Function6804.09677419355
Midmean - Empirical Distribution Function - Averaging6823.7
Midmean - Empirical Distribution Function - Interpolation6823.7
Midmean - Closest Observation6804.09677419355
Midmean - True Basic - Statistics Graphics Toolkit6823.7
Midmean - MS Excel (old versions)6832.96875
Number of observations60

\begin{tabular}{lllllllll}
\hline
Central Tendency - Ungrouped Data \tabularnewline
Measure & Value & S.E. & Value/S.E. \tabularnewline
Arithmetic Mean & 6936.48333333333 & 126.128267354310 & 54.995469919902 \tabularnewline
Geometric Mean & 6869.77662580253 &  &  \tabularnewline
Harmonic Mean & 6804.02022798683 &  &  \tabularnewline
Quadratic Mean & 7003.81275330326 &  &  \tabularnewline
Winsorized Mean ( 1 / 20 ) & 6934.66666666667 & 125.367501953813 & 55.3147072294818 \tabularnewline
Winsorized Mean ( 2 / 20 ) & 6942.46666666667 & 118.020623177866 & 58.8241824160158 \tabularnewline
Winsorized Mean ( 3 / 20 ) & 6936.56666666667 & 116.462074927514 & 59.560734007049 \tabularnewline
Winsorized Mean ( 4 / 20 ) & 6942.76666666667 & 115.222600494796 & 60.2552505919203 \tabularnewline
Winsorized Mean ( 5 / 20 ) & 6948.85 & 112.327258025291 & 61.8625445164473 \tabularnewline
Winsorized Mean ( 6 / 20 ) & 6925.35 & 103.461870552354 & 66.9362535495201 \tabularnewline
Winsorized Mean ( 7 / 20 ) & 6920.56666666667 & 101.181417776198 & 68.3976052003362 \tabularnewline
Winsorized Mean ( 8 / 20 ) & 6934.43333333333 & 98.060941407653 & 70.7155492675307 \tabularnewline
Winsorized Mean ( 9 / 20 ) & 6931.13333333333 & 96.9733945301717 & 71.4745870959155 \tabularnewline
Winsorized Mean ( 10 / 20 ) & 6906.8 & 91.397705468856 & 75.5686367023022 \tabularnewline
Winsorized Mean ( 11 / 20 ) & 6898.91666666667 & 87.1776914256024 & 79.1362624296402 \tabularnewline
Winsorized Mean ( 12 / 20 ) & 6895.51666666667 & 84.533086129983 & 81.571807943504 \tabularnewline
Winsorized Mean ( 13 / 20 ) & 6904.61666666667 & 83.0580869903764 & 83.1299746581771 \tabularnewline
Winsorized Mean ( 14 / 20 ) & 6897.85 & 80.4439968194879 & 85.7472312754227 \tabularnewline
Winsorized Mean ( 15 / 20 ) & 6909.1 & 76.7343009211207 & 90.0392642802889 \tabularnewline
Winsorized Mean ( 16 / 20 ) & 6897.63333333333 & 74.411540652627 & 92.6957468268711 \tabularnewline
Winsorized Mean ( 17 / 20 ) & 6860.51666666667 & 66.3357641933151 & 103.421084389317 \tabularnewline
Winsorized Mean ( 18 / 20 ) & 6844.31666666667 & 61.5417018674186 & 111.214289806473 \tabularnewline
Winsorized Mean ( 19 / 20 ) & 6850.65 & 57.4710087807973 & 119.201840116107 \tabularnewline
Winsorized Mean ( 20 / 20 ) & 6781.98333333333 & 46.0308634589025 & 147.335566263893 \tabularnewline
Trimmed Mean ( 1 / 20 ) & 6931.56896551724 & 119.912879526712 & 57.8050414006875 \tabularnewline
Trimmed Mean ( 2 / 20 ) & 6928.25 & 113.153140827910 & 61.228967656646 \tabularnewline
Trimmed Mean ( 3 / 20 ) & 6920.35185185185 & 109.775926906437 & 63.0407052518004 \tabularnewline
Trimmed Mean ( 4 / 20 ) & 6914.11538461538 & 106.312041256025 & 65.0360514474982 \tabularnewline
Trimmed Mean ( 5 / 20 ) & 6905.52 & 102.422638760248 & 67.4218130247993 \tabularnewline
Trimmed Mean ( 6 / 20 ) & 6894.6875 & 98.4824486480256 & 70.0093021106886 \tabularnewline
Trimmed Mean ( 7 / 20 ) & 6888.02173913043 & 96.309196560635 & 71.5198754128723 \tabularnewline
Trimmed Mean ( 8 / 20 ) & 6881.68181818182 & 94.1045018319496 & 73.1280829738733 \tabularnewline
Trimmed Mean ( 9 / 20 ) & 6872.2619047619 & 91.9829685513137 & 74.7123300432312 \tabularnewline
Trimmed Mean ( 10 / 20 ) & 6862.45 & 89.3805530819248 & 76.7778869494127 \tabularnewline
Trimmed Mean ( 11 / 20 ) & 6855.44736842105 & 87.3918978423625 & 78.4448849112638 \tabularnewline
Trimmed Mean ( 12 / 20 ) & 6848.86111111111 & 85.7118942383902 & 79.9056090402389 \tabularnewline
Trimmed Mean ( 13 / 20 ) & 6842 & 83.9504989533106 & 81.500408994653 \tabularnewline
Trimmed Mean ( 14 / 20 ) & 6832.96875 & 81.6692839708077 & 83.6663237116467 \tabularnewline
Trimmed Mean ( 15 / 20 ) & 6823.7 & 79.018434485288 & 86.3557984215755 \tabularnewline
Trimmed Mean ( 16 / 20 ) & 6811.5 & 76.0413334413225 & 89.5762829469069 \tabularnewline
Trimmed Mean ( 17 / 20 ) & 6799.07692307692 & 72.1932006829734 & 94.178909630758 \tabularnewline
Trimmed Mean ( 18 / 20 ) & 6790.04166666667 & 69.3575194497832 & 97.899142306882 \tabularnewline
Trimmed Mean ( 19 / 20 ) & 6781.81818181818 & 66.5595341479323 & 101.891010335878 \tabularnewline
Trimmed Mean ( 20 / 20 ) & 6770.95 & 63.2820118700076 & 106.996440219200 \tabularnewline
Median & 6743.5 &  &  \tabularnewline
Midrange & 7079 &  &  \tabularnewline
Midmean - Weighted Average at Xnp & 6804.09677419355 &  &  \tabularnewline
Midmean - Weighted Average at X(n+1)p & 6823.7 &  &  \tabularnewline
Midmean - Empirical Distribution Function & 6804.09677419355 &  &  \tabularnewline
Midmean - Empirical Distribution Function - Averaging & 6823.7 &  &  \tabularnewline
Midmean - Empirical Distribution Function - Interpolation & 6823.7 &  &  \tabularnewline
Midmean - Closest Observation & 6804.09677419355 &  &  \tabularnewline
Midmean - True Basic - Statistics Graphics Toolkit & 6823.7 &  &  \tabularnewline
Midmean - MS Excel (old versions) & 6832.96875 &  &  \tabularnewline
Number of observations & 60 &  &  \tabularnewline
\hline
\end{tabular}
%Source: https://freestatistics.org/blog/index.php?pk=17064&T=1

[TABLE]
[ROW][C]Central Tendency - Ungrouped Data[/C][/ROW]
[ROW][C]Measure[/C][C]Value[/C][C]S.E.[/C][C]Value/S.E.[/C][/ROW]
[ROW][C]Arithmetic Mean[/C][C]6936.48333333333[/C][C]126.128267354310[/C][C]54.995469919902[/C][/ROW]
[ROW][C]Geometric Mean[/C][C]6869.77662580253[/C][C][/C][C][/C][/ROW]
[ROW][C]Harmonic Mean[/C][C]6804.02022798683[/C][C][/C][C][/C][/ROW]
[ROW][C]Quadratic Mean[/C][C]7003.81275330326[/C][C][/C][C][/C][/ROW]
[ROW][C]Winsorized Mean ( 1 / 20 )[/C][C]6934.66666666667[/C][C]125.367501953813[/C][C]55.3147072294818[/C][/ROW]
[ROW][C]Winsorized Mean ( 2 / 20 )[/C][C]6942.46666666667[/C][C]118.020623177866[/C][C]58.8241824160158[/C][/ROW]
[ROW][C]Winsorized Mean ( 3 / 20 )[/C][C]6936.56666666667[/C][C]116.462074927514[/C][C]59.560734007049[/C][/ROW]
[ROW][C]Winsorized Mean ( 4 / 20 )[/C][C]6942.76666666667[/C][C]115.222600494796[/C][C]60.2552505919203[/C][/ROW]
[ROW][C]Winsorized Mean ( 5 / 20 )[/C][C]6948.85[/C][C]112.327258025291[/C][C]61.8625445164473[/C][/ROW]
[ROW][C]Winsorized Mean ( 6 / 20 )[/C][C]6925.35[/C][C]103.461870552354[/C][C]66.9362535495201[/C][/ROW]
[ROW][C]Winsorized Mean ( 7 / 20 )[/C][C]6920.56666666667[/C][C]101.181417776198[/C][C]68.3976052003362[/C][/ROW]
[ROW][C]Winsorized Mean ( 8 / 20 )[/C][C]6934.43333333333[/C][C]98.060941407653[/C][C]70.7155492675307[/C][/ROW]
[ROW][C]Winsorized Mean ( 9 / 20 )[/C][C]6931.13333333333[/C][C]96.9733945301717[/C][C]71.4745870959155[/C][/ROW]
[ROW][C]Winsorized Mean ( 10 / 20 )[/C][C]6906.8[/C][C]91.397705468856[/C][C]75.5686367023022[/C][/ROW]
[ROW][C]Winsorized Mean ( 11 / 20 )[/C][C]6898.91666666667[/C][C]87.1776914256024[/C][C]79.1362624296402[/C][/ROW]
[ROW][C]Winsorized Mean ( 12 / 20 )[/C][C]6895.51666666667[/C][C]84.533086129983[/C][C]81.571807943504[/C][/ROW]
[ROW][C]Winsorized Mean ( 13 / 20 )[/C][C]6904.61666666667[/C][C]83.0580869903764[/C][C]83.1299746581771[/C][/ROW]
[ROW][C]Winsorized Mean ( 14 / 20 )[/C][C]6897.85[/C][C]80.4439968194879[/C][C]85.7472312754227[/C][/ROW]
[ROW][C]Winsorized Mean ( 15 / 20 )[/C][C]6909.1[/C][C]76.7343009211207[/C][C]90.0392642802889[/C][/ROW]
[ROW][C]Winsorized Mean ( 16 / 20 )[/C][C]6897.63333333333[/C][C]74.411540652627[/C][C]92.6957468268711[/C][/ROW]
[ROW][C]Winsorized Mean ( 17 / 20 )[/C][C]6860.51666666667[/C][C]66.3357641933151[/C][C]103.421084389317[/C][/ROW]
[ROW][C]Winsorized Mean ( 18 / 20 )[/C][C]6844.31666666667[/C][C]61.5417018674186[/C][C]111.214289806473[/C][/ROW]
[ROW][C]Winsorized Mean ( 19 / 20 )[/C][C]6850.65[/C][C]57.4710087807973[/C][C]119.201840116107[/C][/ROW]
[ROW][C]Winsorized Mean ( 20 / 20 )[/C][C]6781.98333333333[/C][C]46.0308634589025[/C][C]147.335566263893[/C][/ROW]
[ROW][C]Trimmed Mean ( 1 / 20 )[/C][C]6931.56896551724[/C][C]119.912879526712[/C][C]57.8050414006875[/C][/ROW]
[ROW][C]Trimmed Mean ( 2 / 20 )[/C][C]6928.25[/C][C]113.153140827910[/C][C]61.228967656646[/C][/ROW]
[ROW][C]Trimmed Mean ( 3 / 20 )[/C][C]6920.35185185185[/C][C]109.775926906437[/C][C]63.0407052518004[/C][/ROW]
[ROW][C]Trimmed Mean ( 4 / 20 )[/C][C]6914.11538461538[/C][C]106.312041256025[/C][C]65.0360514474982[/C][/ROW]
[ROW][C]Trimmed Mean ( 5 / 20 )[/C][C]6905.52[/C][C]102.422638760248[/C][C]67.4218130247993[/C][/ROW]
[ROW][C]Trimmed Mean ( 6 / 20 )[/C][C]6894.6875[/C][C]98.4824486480256[/C][C]70.0093021106886[/C][/ROW]
[ROW][C]Trimmed Mean ( 7 / 20 )[/C][C]6888.02173913043[/C][C]96.309196560635[/C][C]71.5198754128723[/C][/ROW]
[ROW][C]Trimmed Mean ( 8 / 20 )[/C][C]6881.68181818182[/C][C]94.1045018319496[/C][C]73.1280829738733[/C][/ROW]
[ROW][C]Trimmed Mean ( 9 / 20 )[/C][C]6872.2619047619[/C][C]91.9829685513137[/C][C]74.7123300432312[/C][/ROW]
[ROW][C]Trimmed Mean ( 10 / 20 )[/C][C]6862.45[/C][C]89.3805530819248[/C][C]76.7778869494127[/C][/ROW]
[ROW][C]Trimmed Mean ( 11 / 20 )[/C][C]6855.44736842105[/C][C]87.3918978423625[/C][C]78.4448849112638[/C][/ROW]
[ROW][C]Trimmed Mean ( 12 / 20 )[/C][C]6848.86111111111[/C][C]85.7118942383902[/C][C]79.9056090402389[/C][/ROW]
[ROW][C]Trimmed Mean ( 13 / 20 )[/C][C]6842[/C][C]83.9504989533106[/C][C]81.500408994653[/C][/ROW]
[ROW][C]Trimmed Mean ( 14 / 20 )[/C][C]6832.96875[/C][C]81.6692839708077[/C][C]83.6663237116467[/C][/ROW]
[ROW][C]Trimmed Mean ( 15 / 20 )[/C][C]6823.7[/C][C]79.018434485288[/C][C]86.3557984215755[/C][/ROW]
[ROW][C]Trimmed Mean ( 16 / 20 )[/C][C]6811.5[/C][C]76.0413334413225[/C][C]89.5762829469069[/C][/ROW]
[ROW][C]Trimmed Mean ( 17 / 20 )[/C][C]6799.07692307692[/C][C]72.1932006829734[/C][C]94.178909630758[/C][/ROW]
[ROW][C]Trimmed Mean ( 18 / 20 )[/C][C]6790.04166666667[/C][C]69.3575194497832[/C][C]97.899142306882[/C][/ROW]
[ROW][C]Trimmed Mean ( 19 / 20 )[/C][C]6781.81818181818[/C][C]66.5595341479323[/C][C]101.891010335878[/C][/ROW]
[ROW][C]Trimmed Mean ( 20 / 20 )[/C][C]6770.95[/C][C]63.2820118700076[/C][C]106.996440219200[/C][/ROW]
[ROW][C]Median[/C][C]6743.5[/C][C][/C][C][/C][/ROW]
[ROW][C]Midrange[/C][C]7079[/C][C][/C][C][/C][/ROW]
[ROW][C]Midmean - Weighted Average at Xnp[/C][C]6804.09677419355[/C][C][/C][C][/C][/ROW]
[ROW][C]Midmean - Weighted Average at X(n+1)p[/C][C]6823.7[/C][C][/C][C][/C][/ROW]
[ROW][C]Midmean - Empirical Distribution Function[/C][C]6804.09677419355[/C][C][/C][C][/C][/ROW]
[ROW][C]Midmean - Empirical Distribution Function - Averaging[/C][C]6823.7[/C][C][/C][C][/C][/ROW]
[ROW][C]Midmean - Empirical Distribution Function - Interpolation[/C][C]6823.7[/C][C][/C][C][/C][/ROW]
[ROW][C]Midmean - Closest Observation[/C][C]6804.09677419355[/C][C][/C][C][/C][/ROW]
[ROW][C]Midmean - True Basic - Statistics Graphics Toolkit[/C][C]6823.7[/C][C][/C][C][/C][/ROW]
[ROW][C]Midmean - MS Excel (old versions)[/C][C]6832.96875[/C][C][/C][C][/C][/ROW]
[ROW][C]Number of observations[/C][C]60[/C][C][/C][C][/C][/ROW]
[/TABLE]
Source: https://freestatistics.org/blog/index.php?pk=17064&T=1

Globally Unique Identifier (entire table): ba.freestatistics.org/blog/index.php?pk=17064&T=1

As an alternative you can also use a QR Code:  

The GUIDs for individual cells are displayed in the table below:

Central Tendency - Ungrouped Data
MeasureValueS.E.Value/S.E.
Arithmetic Mean6936.48333333333126.12826735431054.995469919902
Geometric Mean6869.77662580253
Harmonic Mean6804.02022798683
Quadratic Mean7003.81275330326
Winsorized Mean ( 1 / 20 )6934.66666666667125.36750195381355.3147072294818
Winsorized Mean ( 2 / 20 )6942.46666666667118.02062317786658.8241824160158
Winsorized Mean ( 3 / 20 )6936.56666666667116.46207492751459.560734007049
Winsorized Mean ( 4 / 20 )6942.76666666667115.22260049479660.2552505919203
Winsorized Mean ( 5 / 20 )6948.85112.32725802529161.8625445164473
Winsorized Mean ( 6 / 20 )6925.35103.46187055235466.9362535495201
Winsorized Mean ( 7 / 20 )6920.56666666667101.18141777619868.3976052003362
Winsorized Mean ( 8 / 20 )6934.4333333333398.06094140765370.7155492675307
Winsorized Mean ( 9 / 20 )6931.1333333333396.973394530171771.4745870959155
Winsorized Mean ( 10 / 20 )6906.891.39770546885675.5686367023022
Winsorized Mean ( 11 / 20 )6898.9166666666787.177691425602479.1362624296402
Winsorized Mean ( 12 / 20 )6895.5166666666784.53308612998381.571807943504
Winsorized Mean ( 13 / 20 )6904.6166666666783.058086990376483.1299746581771
Winsorized Mean ( 14 / 20 )6897.8580.443996819487985.7472312754227
Winsorized Mean ( 15 / 20 )6909.176.734300921120790.0392642802889
Winsorized Mean ( 16 / 20 )6897.6333333333374.41154065262792.6957468268711
Winsorized Mean ( 17 / 20 )6860.5166666666766.3357641933151103.421084389317
Winsorized Mean ( 18 / 20 )6844.3166666666761.5417018674186111.214289806473
Winsorized Mean ( 19 / 20 )6850.6557.4710087807973119.201840116107
Winsorized Mean ( 20 / 20 )6781.9833333333346.0308634589025147.335566263893
Trimmed Mean ( 1 / 20 )6931.56896551724119.91287952671257.8050414006875
Trimmed Mean ( 2 / 20 )6928.25113.15314082791061.228967656646
Trimmed Mean ( 3 / 20 )6920.35185185185109.77592690643763.0407052518004
Trimmed Mean ( 4 / 20 )6914.11538461538106.31204125602565.0360514474982
Trimmed Mean ( 5 / 20 )6905.52102.42263876024867.4218130247993
Trimmed Mean ( 6 / 20 )6894.687598.482448648025670.0093021106886
Trimmed Mean ( 7 / 20 )6888.0217391304396.30919656063571.5198754128723
Trimmed Mean ( 8 / 20 )6881.6818181818294.104501831949673.1280829738733
Trimmed Mean ( 9 / 20 )6872.261904761991.982968551313774.7123300432312
Trimmed Mean ( 10 / 20 )6862.4589.380553081924876.7778869494127
Trimmed Mean ( 11 / 20 )6855.4473684210587.391897842362578.4448849112638
Trimmed Mean ( 12 / 20 )6848.8611111111185.711894238390279.9056090402389
Trimmed Mean ( 13 / 20 )684283.950498953310681.500408994653
Trimmed Mean ( 14 / 20 )6832.9687581.669283970807783.6663237116467
Trimmed Mean ( 15 / 20 )6823.779.01843448528886.3557984215755
Trimmed Mean ( 16 / 20 )6811.576.041333441322589.5762829469069
Trimmed Mean ( 17 / 20 )6799.0769230769272.193200682973494.178909630758
Trimmed Mean ( 18 / 20 )6790.0416666666769.357519449783297.899142306882
Trimmed Mean ( 19 / 20 )6781.8181818181866.5595341479323101.891010335878
Trimmed Mean ( 20 / 20 )6770.9563.2820118700076106.996440219200
Median6743.5
Midrange7079
Midmean - Weighted Average at Xnp6804.09677419355
Midmean - Weighted Average at X(n+1)p6823.7
Midmean - Empirical Distribution Function6804.09677419355
Midmean - Empirical Distribution Function - Averaging6823.7
Midmean - Empirical Distribution Function - Interpolation6823.7
Midmean - Closest Observation6804.09677419355
Midmean - True Basic - Statistics Graphics Toolkit6823.7
Midmean - MS Excel (old versions)6832.96875
Number of observations60


Parameters (Session):
par1 = grey ; par2 = grey ; par3 = TRUE ; par4 = bouwvergunningen ; par5 = werkelijk begonnen woningen ;
Parameters (R input):
R code (references can be found in the software module):
geomean <- function(x) {
return(exp(mean(log(x))))
}
harmean <- function(x) {
return(1/mean(1/x))
}
quamean <- function(x) {
return(sqrt(mean(x*x)))
}
winmean <- function(x) {
x <-sort(x[!is.na(x)])
n<-length(x)
denom <- 3
nodenom <- n/denom
if (nodenom>40) denom <- n/40
sqrtn = sqrt(n)
roundnodenom = floor(nodenom)
win <- array(NA,dim=c(roundnodenom,2))
for (j in 1:roundnodenom) {
win[j,1] <- (j*x[j+1]+sum(x[(j+1):(n-j)])+j*x[n-j])/n
win[j,2] <- sd(c(rep(x[j+1],j),x[(j+1):(n-j)],rep(x[n-j],j)))/sqrtn
}
return(win)
}
trimean <- function(x) {
x <-sort(x[!is.na(x)])
n<-length(x)
denom <- 3
nodenom <- n/denom
if (nodenom>40) denom <- n/40
sqrtn = sqrt(n)
roundnodenom = floor(nodenom)
tri <- array(NA,dim=c(roundnodenom,2))
for (j in 1:roundnodenom) {
tri[j,1] <- mean(x,trim=j/n)
tri[j,2] <- sd(x[(j+1):(n-j)]) / sqrt(n-j*2)
}
return(tri)
}
midrange <- function(x) {
return((max(x)+min(x))/2)
}
q1 <- function(data,n,p,i,f) {
np <- n*p;
i <<- floor(np)
f <<- np - i
qvalue <- (1-f)*data[i] + f*data[i+1]
}
q2 <- function(data,n,p,i,f) {
np <- (n+1)*p
i <<- floor(np)
f <<- np - i
qvalue <- (1-f)*data[i] + f*data[i+1]
}
q3 <- function(data,n,p,i,f) {
np <- n*p
i <<- floor(np)
f <<- np - i
if (f==0) {
qvalue <- data[i]
} else {
qvalue <- data[i+1]
}
}
q4 <- function(data,n,p,i,f) {
np <- n*p
i <<- floor(np)
f <<- np - i
if (f==0) {
qvalue <- (data[i]+data[i+1])/2
} else {
qvalue <- data[i+1]
}
}
q5 <- function(data,n,p,i,f) {
np <- (n-1)*p
i <<- floor(np)
f <<- np - i
if (f==0) {
qvalue <- data[i+1]
} else {
qvalue <- data[i+1] + f*(data[i+2]-data[i+1])
}
}
q6 <- function(data,n,p,i,f) {
np <- n*p+0.5
i <<- floor(np)
f <<- np - i
qvalue <- data[i]
}
q7 <- function(data,n,p,i,f) {
np <- (n+1)*p
i <<- floor(np)
f <<- np - i
if (f==0) {
qvalue <- data[i]
} else {
qvalue <- f*data[i] + (1-f)*data[i+1]
}
}
q8 <- function(data,n,p,i,f) {
np <- (n+1)*p
i <<- floor(np)
f <<- np - i
if (f==0) {
qvalue <- data[i]
} else {
if (f == 0.5) {
qvalue <- (data[i]+data[i+1])/2
} else {
if (f < 0.5) {
qvalue <- data[i]
} else {
qvalue <- data[i+1]
}
}
}
}
midmean <- function(x,def) {
x <-sort(x[!is.na(x)])
n<-length(x)
if (def==1) {
qvalue1 <- q1(x,n,0.25,i,f)
qvalue3 <- q1(x,n,0.75,i,f)
}
if (def==2) {
qvalue1 <- q2(x,n,0.25,i,f)
qvalue3 <- q2(x,n,0.75,i,f)
}
if (def==3) {
qvalue1 <- q3(x,n,0.25,i,f)
qvalue3 <- q3(x,n,0.75,i,f)
}
if (def==4) {
qvalue1 <- q4(x,n,0.25,i,f)
qvalue3 <- q4(x,n,0.75,i,f)
}
if (def==5) {
qvalue1 <- q5(x,n,0.25,i,f)
qvalue3 <- q5(x,n,0.75,i,f)
}
if (def==6) {
qvalue1 <- q6(x,n,0.25,i,f)
qvalue3 <- q6(x,n,0.75,i,f)
}
if (def==7) {
qvalue1 <- q7(x,n,0.25,i,f)
qvalue3 <- q7(x,n,0.75,i,f)
}
if (def==8) {
qvalue1 <- q8(x,n,0.25,i,f)
qvalue3 <- q8(x,n,0.75,i,f)
}
midm <- 0
myn <- 0
roundno4 <- round(n/4)
round3no4 <- round(3*n/4)
for (i in 1:n) {
if ((x[i]>=qvalue1) & (x[i]<=qvalue3)){
midm = midm + x[i]
myn = myn + 1
}
}
midm = midm / myn
return(midm)
}
(arm <- mean(x))
sqrtn <- sqrt(length(x))
(armse <- sd(x) / sqrtn)
(armose <- arm / armse)
(geo <- geomean(x))
(har <- harmean(x))
(qua <- quamean(x))
(win <- winmean(x))
(tri <- trimean(x))
(midr <- midrange(x))
midm <- array(NA,dim=8)
for (j in 1:8) midm[j] <- midmean(x,j)
midm
bitmap(file='test1.png')
lb <- win[,1] - 2*win[,2]
ub <- win[,1] + 2*win[,2]
if ((ylimmin == '') | (ylimmax == '')) plot(win[,1],type='b',main=main, xlab='j', pch=19, ylab='Winsorized Mean(j/n)', ylim=c(min(lb),max(ub))) else plot(win[,1],type='l',main=main, xlab='j', pch=19, ylab='Winsorized Mean(j/n)', ylim=c(ylimmin,ylimmax))
lines(ub,lty=3)
lines(lb,lty=3)
grid()
dev.off()
bitmap(file='test2.png')
lb <- tri[,1] - 2*tri[,2]
ub <- tri[,1] + 2*tri[,2]
if ((ylimmin == '') | (ylimmax == '')) plot(tri[,1],type='b',main=main, xlab='j', pch=19, ylab='Trimmed Mean(j/n)', ylim=c(min(lb),max(ub))) else plot(tri[,1],type='l',main=main, xlab='j', pch=19, ylab='Trimmed Mean(j/n)', ylim=c(ylimmin,ylimmax))
lines(ub,lty=3)
lines(lb,lty=3)
grid()
dev.off()
load(file='createtable')
a<-table.start()
a<-table.row.start(a)
a<-table.element(a,'Central Tendency - Ungrouped Data',4,TRUE)
a<-table.row.end(a)
a<-table.row.start(a)
a<-table.element(a,'Measure',header=TRUE)
a<-table.element(a,'Value',header=TRUE)
a<-table.element(a,'S.E.',header=TRUE)
a<-table.element(a,'Value/S.E.',header=TRUE)
a<-table.row.end(a)
a<-table.row.start(a)
a<-table.element(a,hyperlink('arithmetic_mean.htm', 'Arithmetic Mean', 'click to view the definition of the Arithmetic Mean'),header=TRUE)
a<-table.element(a,arm)
a<-table.element(a,hyperlink('arithmetic_mean_standard_error.htm', armse, 'click to view the definition of the Standard Error of the Arithmetic Mean'))
a<-table.element(a,armose)
a<-table.row.end(a)
a<-table.row.start(a)
a<-table.element(a,hyperlink('geometric_mean.htm', 'Geometric Mean', 'click to view the definition of the Geometric Mean'),header=TRUE)
a<-table.element(a,geo)
a<-table.element(a,'')
a<-table.row.end(a)
a<-table.row.start(a)
a<-table.element(a,hyperlink('harmonic_mean.htm', 'Harmonic Mean', 'click to view the definition of the Harmonic Mean'),header=TRUE)
a<-table.element(a,har)
a<-table.element(a,'')
a<-table.row.end(a)
a<-table.row.start(a)
a<-table.element(a,hyperlink('quadratic_mean.htm', 'Quadratic Mean', 'click to view the definition of the Quadratic Mean'),header=TRUE)
a<-table.element(a,qua)
a<-table.element(a,'')
a<-table.row.end(a)
for (j in 1:length(win[,1])) {
a<-table.row.start(a)
mylabel <- paste('Winsorized Mean (',j)
mylabel <- paste(mylabel,'/')
mylabel <- paste(mylabel,length(win[,1]))
mylabel <- paste(mylabel,')')
a<-table.element(a,hyperlink('winsorized_mean.htm', mylabel, 'click to view the definition of the Winsorized Mean'),header=TRUE)
a<-table.element(a,win[j,1])
a<-table.element(a,win[j,2])
a<-table.element(a,win[j,1]/win[j,2])
a<-table.row.end(a)
}
for (j in 1:length(tri[,1])) {
a<-table.row.start(a)
mylabel <- paste('Trimmed Mean (',j)
mylabel <- paste(mylabel,'/')
mylabel <- paste(mylabel,length(tri[,1]))
mylabel <- paste(mylabel,')')
a<-table.element(a,hyperlink('arithmetic_mean.htm', mylabel, 'click to view the definition of the Trimmed Mean'),header=TRUE)
a<-table.element(a,tri[j,1])
a<-table.element(a,tri[j,2])
a<-table.element(a,tri[j,1]/tri[j,2])
a<-table.row.end(a)
}
a<-table.row.start(a)
a<-table.element(a,hyperlink('median_1.htm', 'Median', 'click to view the definition of the Median'),header=TRUE)
a<-table.element(a,median(x))
a<-table.element(a,'')
a<-table.row.end(a)
a<-table.row.start(a)
a<-table.element(a,hyperlink('midrange.htm', 'Midrange', 'click to view the definition of the Midrange'),header=TRUE)
a<-table.element(a,midr)
a<-table.element(a,'')
a<-table.row.end(a)
a<-table.row.start(a)
mymid <- hyperlink('midmean.htm', 'Midmean', 'click to view the definition of the Midmean')
mylabel <- paste(mymid,hyperlink('method_1.htm','Weighted Average at Xnp',''),sep=' - ')
a<-table.element(a,mylabel,header=TRUE)
a<-table.element(a,midm[1])
a<-table.element(a,'')
a<-table.row.end(a)
a<-table.row.start(a)
mymid <- hyperlink('midmean.htm', 'Midmean', 'click to view the definition of the Midmean')
mylabel <- paste(mymid,hyperlink('method_2.htm','Weighted Average at X(n+1)p',''),sep=' - ')
a<-table.element(a,mylabel,header=TRUE)
a<-table.element(a,midm[2])
a<-table.element(a,'')
a<-table.row.end(a)
a<-table.row.start(a)
mymid <- hyperlink('midmean.htm', 'Midmean', 'click to view the definition of the Midmean')
mylabel <- paste(mymid,hyperlink('method_3.htm','Empirical Distribution Function',''),sep=' - ')
a<-table.element(a,mylabel,header=TRUE)
a<-table.element(a,midm[3])
a<-table.element(a,'')
a<-table.row.end(a)
a<-table.row.start(a)
mymid <- hyperlink('midmean.htm', 'Midmean', 'click to view the definition of the Midmean')
mylabel <- paste(mymid,hyperlink('method_4.htm','Empirical Distribution Function - Averaging',''),sep=' - ')
a<-table.element(a,mylabel,header=TRUE)
a<-table.element(a,midm[4])
a<-table.element(a,'')
a<-table.row.end(a)
a<-table.row.start(a)
mymid <- hyperlink('midmean.htm', 'Midmean', 'click to view the definition of the Midmean')
mylabel <- paste(mymid,hyperlink('method_5.htm','Empirical Distribution Function - Interpolation',''),sep=' - ')
a<-table.element(a,mylabel,header=TRUE)
a<-table.element(a,midm[5])
a<-table.element(a,'')
a<-table.row.end(a)
a<-table.row.start(a)
mymid <- hyperlink('midmean.htm', 'Midmean', 'click to view the definition of the Midmean')
mylabel <- paste(mymid,hyperlink('method_6.htm','Closest Observation',''),sep=' - ')
a<-table.element(a,mylabel,header=TRUE)
a<-table.element(a,midm[6])
a<-table.element(a,'')
a<-table.row.end(a)
a<-table.row.start(a)
mymid <- hyperlink('midmean.htm', 'Midmean', 'click to view the definition of the Midmean')
mylabel <- paste(mymid,hyperlink('method_7.htm','True Basic - Statistics Graphics Toolkit',''),sep=' - ')
a<-table.element(a,mylabel,header=TRUE)
a<-table.element(a,midm[7])
a<-table.element(a,'')
a<-table.row.end(a)
a<-table.row.start(a)
mymid <- hyperlink('midmean.htm', 'Midmean', 'click to view the definition of the Midmean')
mylabel <- paste(mymid,hyperlink('method_8.htm','MS Excel (old versions)',''),sep=' - ')
a<-table.element(a,mylabel,header=TRUE)
a<-table.element(a,midm[8])
a<-table.element(a,'')
a<-table.row.end(a)
a<-table.row.start(a)
a<-table.element(a,'Number of observations',header=TRUE)
a<-table.element(a,length(x))
a<-table.element(a,'')
a<-table.row.end(a)
a<-table.end(a)
table.save(a,file='mytable.tab')