Free Statistics

of Irreproducible Research!

Author's title

Author*The author of this computation has been verified*
R Software Modulerwasp_correlation.wasp
Title produced by softwarePearson Correlation
Date of computationSun, 19 Oct 2008 12:52:35 -0600
Cite this page as followsStatistical Computations at FreeStatistics.org, Office for Research Development and Education, URL https://freestatistics.org/blog/index.php?v=date/2008/Oct/19/t1224442404xp15zpj3786yhnu.htm/, Retrieved Sun, 19 May 2024 15:55:10 +0000
Statistical Computations at FreeStatistics.org, Office for Research Development and Education, URL https://freestatistics.org/blog/index.php?pk=17049, Retrieved Sun, 19 May 2024 15:55:10 +0000
QR Codes:

Original text written by user:
IsPrivate?No (this computation is public)
User-defined keywords
Estimated Impact141
Family? (F = Feedback message, R = changed R code, M = changed R Module, P = changed Parameters, D = changed Data)
F       [Pearson Correlation] [Correlation: Tota...] [2008-10-19 18:52:35] [6fc58909ffe15c247a4f6748c8841ab4] [Current]
Feedback Forum
2008-10-24 16:17:20 [Matthieu Blondeau] [reply
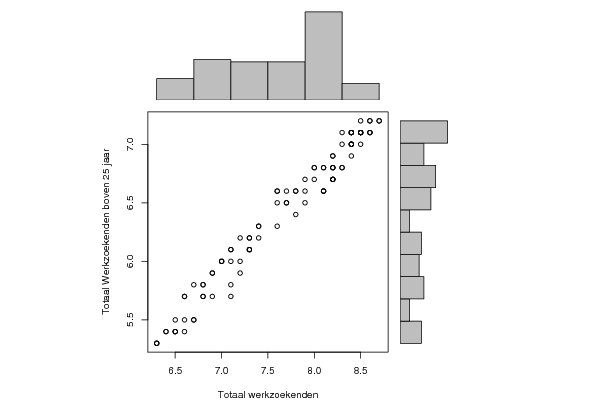
Ook hier is er een heel hoge correlatie. Dit is ook te merken aan de constante rechte in de grafiek. Er is een sterk verband tussen de totale werkloosheid en de totale werklossheid van mensen ouder dan 25 jaar.
2008-10-26 14:35:09 [a3bd64f7d45ff4aaf16467137b923bbb] [reply
Hier is er een heel sterke verband want als men een stijgende rechten zou trekken. Zouden alle punten bijna rond die rechte liggen. Dit betekent dat de werkloosheid boven de 25 groot is.

Post a new message
Dataseries X:
7.4
7.2
7.1
6.9
6.8
6.8
6.8
6.9
6.7
6.6
6.5
6.4
6.3
6.3
6.3
6.5
6.6
6.5
6.4
6.5
6.7
7.1
7.1
7.2
7.2
7.3
7.3
7.3
7.3
7.4
7.6
7.6
7.6
7.7
7.8
7.9
8.1
8.1
8.1
8.2
8.2
8.2
8.2
8.2
8.2
8.3
8.3
8.4
8.4
8.4
8.3
8.0
8.0
8.2
8.6
8.7
8.7
8.5
8.4
8.4
8.4
8.5
8.5
8.5
8.5
8.5
8.4
8.4
8.4
8.5
8.6
8.6
8.6
8.6
8.5
8.4
8.4
8.3
8.2
8.1
8.2
8.1
8.0
7.9
7.8
7.7
7.7
7.9
7.8
7.6
7.4
7.3
7.1
7.1
7.0
7.0
7.0
6.9
6.8
6.7
6.6
6.6
Dataseries Y:
6.3
6.2
6.1
5.9
5.8
5.7
5.7
5.7
5.5
5.5
5.5
5.4
5.3
5.3
5.3
5.4
5.4
5.4
5.4
5.4
5.5
5.7
5.8
5.9
6.0
6.1
6.1
6.1
6.2
6.3
6.6
6.6
6.5
6.5
6.6
6.6
6.6
6.6
6.6
6.8
6.8
6.7
6.7
6.7
6.7
6.8
6.8
6.9
7.0
7.0
7.0
6.8
6.8
6.9
7.1
7.2
7.2
7.0
7.0
7.0
7.0
7.1
7.1
7.1
7.1
7.1
7.1
7.1
7.1
7.1
7.1
7.1
7.2
7.2
7.2
7.1
7.1
7.1
6.9
6.8
6.8
6.8
6.7
6.7
6.6
6.6
6.5
6.5
6.4
6.3
6.2
6.2
6.1
6.0
6.0
6.0
6.0
5.9
5.8
5.8
5.7
5.7


Summary of computational transaction
Raw Inputview raw input (R code)
Raw Outputview raw output of R engine
Computing time2 seconds
R Server'Sir Ronald Aylmer Fisher' @ 193.190.124.24

\begin{tabular}{lllllllll}
\hline
Summary of computational transaction \tabularnewline
Raw Input & view raw input (R code)  \tabularnewline
Raw Output & view raw output of R engine  \tabularnewline
Computing time & 2 seconds \tabularnewline
R Server & 'Sir Ronald Aylmer Fisher' @ 193.190.124.24 \tabularnewline
\hline
\end{tabular}
%Source: https://freestatistics.org/blog/index.php?pk=17049&T=0

[TABLE]
[ROW][C]Summary of computational transaction[/C][/ROW]
[ROW][C]Raw Input[/C][C]view raw input (R code) [/C][/ROW]
[ROW][C]Raw Output[/C][C]view raw output of R engine [/C][/ROW]
[ROW][C]Computing time[/C][C]2 seconds[/C][/ROW]
[ROW][C]R Server[/C][C]'Sir Ronald Aylmer Fisher' @ 193.190.124.24[/C][/ROW]
[/TABLE]
Source: https://freestatistics.org/blog/index.php?pk=17049&T=0

Globally Unique Identifier (entire table): ba.freestatistics.org/blog/index.php?pk=17049&T=0

As an alternative you can also use a QR Code:  

The GUIDs for individual cells are displayed in the table below:

Summary of computational transaction
Raw Inputview raw input (R code)
Raw Outputview raw output of R engine
Computing time2 seconds
R Server'Sir Ronald Aylmer Fisher' @ 193.190.124.24


Pearson Product Moment Correlation - Ungrouped Data
StatisticVariable XVariable Y
Mean7.664705882352946.42156862745098
Biased Variance0.5342445213379470.348946559015763
Biased Standard Deviation0.730920324890440.590716987241575
Covariance0.429679673849738
Correlation0.985408974184917
Determination0.971030846404171
T-Test57.896006702447
p-value (2 sided)0
p-value (1 sided)0
Degrees of Freedom100
Number of Observations102

\begin{tabular}{lllllllll}
\hline
Pearson Product Moment Correlation - Ungrouped Data \tabularnewline
Statistic & Variable X & Variable Y \tabularnewline
Mean & 7.66470588235294 & 6.42156862745098 \tabularnewline
Biased Variance & 0.534244521337947 & 0.348946559015763 \tabularnewline
Biased Standard Deviation & 0.73092032489044 & 0.590716987241575 \tabularnewline
Covariance & 0.429679673849738 \tabularnewline
Correlation & 0.985408974184917 \tabularnewline
Determination & 0.971030846404171 \tabularnewline
T-Test & 57.896006702447 \tabularnewline
p-value (2 sided) & 0 \tabularnewline
p-value (1 sided) & 0 \tabularnewline
Degrees of Freedom & 100 \tabularnewline
Number of Observations & 102 \tabularnewline
\hline
\end{tabular}
%Source: https://freestatistics.org/blog/index.php?pk=17049&T=1

[TABLE]
[ROW][C]Pearson Product Moment Correlation - Ungrouped Data[/C][/ROW]
[ROW][C]Statistic[/C][C]Variable X[/C][C]Variable Y[/C][/ROW]
[ROW][C]Mean[/C][C]7.66470588235294[/C][C]6.42156862745098[/C][/ROW]
[ROW][C]Biased Variance[/C][C]0.534244521337947[/C][C]0.348946559015763[/C][/ROW]
[ROW][C]Biased Standard Deviation[/C][C]0.73092032489044[/C][C]0.590716987241575[/C][/ROW]
[ROW][C]Covariance[/C][C]0.429679673849738[/C][/ROW]
[ROW][C]Correlation[/C][C]0.985408974184917[/C][/ROW]
[ROW][C]Determination[/C][C]0.971030846404171[/C][/ROW]
[ROW][C]T-Test[/C][C]57.896006702447[/C][/ROW]
[ROW][C]p-value (2 sided)[/C][C]0[/C][/ROW]
[ROW][C]p-value (1 sided)[/C][C]0[/C][/ROW]
[ROW][C]Degrees of Freedom[/C][C]100[/C][/ROW]
[ROW][C]Number of Observations[/C][C]102[/C][/ROW]
[/TABLE]
Source: https://freestatistics.org/blog/index.php?pk=17049&T=1

Globally Unique Identifier (entire table): ba.freestatistics.org/blog/index.php?pk=17049&T=1

As an alternative you can also use a QR Code:  

The GUIDs for individual cells are displayed in the table below:

Pearson Product Moment Correlation - Ungrouped Data
StatisticVariable XVariable Y
Mean7.664705882352946.42156862745098
Biased Variance0.5342445213379470.348946559015763
Biased Standard Deviation0.730920324890440.590716987241575
Covariance0.429679673849738
Correlation0.985408974184917
Determination0.971030846404171
T-Test57.896006702447
p-value (2 sided)0
p-value (1 sided)0
Degrees of Freedom100
Number of Observations102


Parameters (Session):
Parameters (R input):
R code (references can be found in the software module):
bitmap(file='test1.png')
histx <- hist(x, plot=FALSE)
histy <- hist(y, plot=FALSE)
maxcounts <- max(c(histx$counts, histx$counts))
xrange <- c(min(x),max(x))
yrange <- c(min(y),max(y))
nf <- layout(matrix(c(2,0,1,3),2,2,byrow=TRUE), c(3,1), c(1,3), TRUE)
par(mar=c(4,4,1,1))
plot(x, y, xlim=xrange, ylim=yrange, xlab=xlab, ylab=ylab)
par(mar=c(0,4,1,1))
barplot(histx$counts, axes=FALSE, ylim=c(0, maxcounts), space=0)
par(mar=c(4,0,1,1))
barplot(histy$counts, axes=FALSE, xlim=c(0, maxcounts), space=0, horiz=TRUE)
dev.off()
lx = length(x)
makebiased = (lx-1)/lx
varx = var(x)*makebiased
vary = var(y)*makebiased
corxy <- cor.test(x,y,method='pearson')
cxy <- as.matrix(corxy$estimate)[1,1]
load(file='createtable')
a<-table.start()
a<-table.row.start(a)
a<-table.element(a,'Pearson Product Moment Correlation - Ungrouped Data',3,TRUE)
a<-table.row.end(a)
a<-table.row.start(a)
a<-table.element(a,'Statistic',1,TRUE)
a<-table.element(a,'Variable X',1,TRUE)
a<-table.element(a,'Variable Y',1,TRUE)
a<-table.row.end(a)
a<-table.row.start(a)
a<-table.element(a,hyperlink('arithmetic_mean.htm','Mean',''),header=TRUE)
a<-table.element(a,mean(x))
a<-table.element(a,mean(y))
a<-table.row.end(a)
a<-table.row.start(a)
a<-table.element(a,hyperlink('biased.htm','Biased Variance',''),header=TRUE)
a<-table.element(a,varx)
a<-table.element(a,vary)
a<-table.row.end(a)
a<-table.row.start(a)
a<-table.element(a,hyperlink('biased1.htm','Biased Standard Deviation',''),header=TRUE)
a<-table.element(a,sqrt(varx))
a<-table.element(a,sqrt(vary))
a<-table.row.end(a)
a<-table.row.start(a)
a<-table.element(a,hyperlink('covariance.htm','Covariance',''),header=TRUE)
a<-table.element(a,cov(x,y),2)
a<-table.row.end(a)
a<-table.row.start(a)
a<-table.element(a,hyperlink('pearson_correlation.htm','Correlation',''),header=TRUE)
a<-table.element(a,cxy,2)
a<-table.row.end(a)
a<-table.row.start(a)
a<-table.element(a,hyperlink('coeff_of_determination.htm','Determination',''),header=TRUE)
a<-table.element(a,cxy*cxy,2)
a<-table.row.end(a)
a<-table.row.start(a)
a<-table.element(a,hyperlink('ttest_statistic.htm','T-Test',''),header=TRUE)
a<-table.element(a,as.matrix(corxy$statistic)[1,1],2)
a<-table.row.end(a)
a<-table.row.start(a)
a<-table.element(a,'p-value (2 sided)',header=TRUE)
a<-table.element(a,(p2 <- as.matrix(corxy$p.value)[1,1]),2)
a<-table.row.end(a)
a<-table.row.start(a)
a<-table.element(a,'p-value (1 sided)',header=TRUE)
a<-table.element(a,p2/2,2)
a<-table.row.end(a)
a<-table.row.start(a)
a<-table.element(a,'Degrees of Freedom',header=TRUE)
a<-table.element(a,lx-2,2)
a<-table.row.end(a)
a<-table.row.start(a)
a<-table.element(a,'Number of Observations',header=TRUE)
a<-table.element(a,lx,2)
a<-table.row.end(a)
a<-table.end(a)
table.save(a,file='mytable.tab')